Antelope: Fire Incidents, California (CA)
Where are fire incidents reported in Antelope, CA
Something went wrong! Please refresh the page.
|
| |||||||||||||||||||||||||||||||||||||||||||||||||||||||||||||||||||||||||||||||||||||||||||||||||||||||||||||
2005 - 2018 National Fire Incident Reporting System (NFIRS) incidents
- Incident types reported to NFIRS in Antelope, CA
- 7,45572.1%Rescue & EMS
- 7877.6%Service Call
- 7697.4%Good Intent Call
- 6506.3%Fire
- 3503.4%False Alarm
- 3012.9%Hazardous Condition
- 170.2%Special Incident
- Fire incident types reported to NFIRS in Antelope, CA
- 34452.9%Outside Fires
- 18027.7%Structure Fires
- 7912.2%Mobile Property/Vehicle Fires
- 477.2%Other
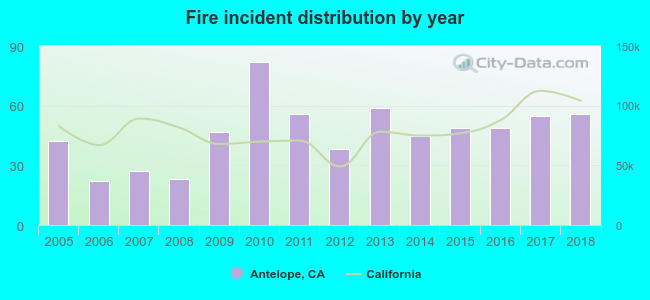 According to the data from the years 2005 - 2018 the average number of fires per year is 46. The highest number of reported fire incidents - 82 took place in 2010, and the least - 22 in 2006. The data has a rising trend.
The average number of yearly fire incidents per 10k residents in Antelope, CA compared to nearest cities:
(Note: Based on data for the last 3 years, including only cities with population 5,000 and above)
| Antelope: | 11.7 |
| Citrus Heights: | 28.1 |
| North Highlands: | 46.8 |
| Roseville: | 22.8 |
| Carmichael: | 16.0 |
| Fair Oaks: | 14.0 |
| Orangevale: | 13.5 |
| Rio Linda: | 39.7 |
| Elverta: | 94.1 |
 The median response time based on all reported fire incidents is 5 minutes. This is lower than the California median value.
The median response time in Antelope, CA compared to nearest cities:
(Note: Based on data for all years, including only cities with at least 500 fire incidents)
| Antelope: | 5 minutes |
| Citrus Heights: | 5 minutes |
| North Highlands: | 5 minutes |
| Roseville: | 5 minutes |
| Carmichael: | 5 minutes |
| Fair Oaks: | 5 minutes |
| Orangevale: | 5 minutes |
| Rio Linda: | 5 minutes |
| Elverta: | 6 minutes |
 28.3% incidents where reported in the morning and 71.7% in the evening. The most fires (15.8%) took place on Sunday, and the least (12.8%) on Tuesday.
 Based on the 650 fire incidents from years 2005 - 2018 most fires (15.7%) took place during July, and the least (5.8%) in April.
 Out of all 10,344 cases reported during the years 2005 - 2018, the most belonged to the categories: Rescue & EMS (72.1%), Service Call (7.6%), and Good Intent Call (7.4%).
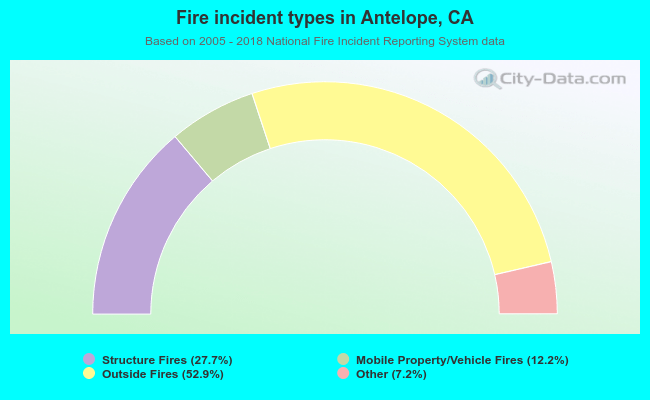 When looking into fire subcategories, the most reports belonged to: Outside Fires (52.9%), and Structure Fires (27.7%).