Blackfoot: Fire Incidents, Idaho (ID)
Where are fire incidents reported in Blackfoot, ID
Something went wrong! Please refresh the page.
| Fire incidents reported | |
|---|---|
| Sreet name | Count |
| HIGHWAY 39 | 128 |
| HIGHWAY 26 | 108 |
| MAIN STREET | 86 |
| HIGHWAY 91 | 64 |
| 100 SOUTH | 62 |
| 200 NORTH | 62 |
| AIRPORT ROAD | 56 |
| BROADWAY | 54 |
| 100 NORTH | 46 |
| 150 WEST | 44 |
| SHILLING AVENUE | 44 |
| 700 WEST | 42 |
| 350 NORTH | 38 |
| I-15 | 38 |
| 400 WEST | 36 |
| 900 WEST | 36 |
| CENTER STREET | 32 |
| RIVERTON ROAD | 32 |
| RICH LANE | 30 |
| 300 NORTH | 28 |
| BRIDGE STREET | 28 |
| 1400 WEST | 24 |
| HWY 39 | 24 |
| FISHER AVENUE | 20 |
| LANSING STREET | 20 |
| PARKWAY DRIVE | 20 |
| UNIVERSITY AVENUE | 20 |
| 1200 WEST | 18 |
| 200 | 18 |
| 400 NORTH | 18 |
| Other | 1,424 |
2002 - 2018 National Fire Incident Reporting System (NFIRS) incidents
- Incident types reported to NFIRS in Blackfoot, ID
- 2,70054.7%Fire
- 80316.3%Hazardous Condition
- 55911.3%False Alarm
- 4909.9%Good Intent Call
- 2905.9%Service Call
- 440.9%Special Incident
- 260.5%Rescue & EMS
- 220.4%Overpressure Rupture
- Fire incident types reported to NFIRS in Blackfoot, ID
- 1,70363.1%Outside Fires
- 50018.5%Structure Fires
- 27310.1%Mobile Property/Vehicle Fires
- 2248.3%Other
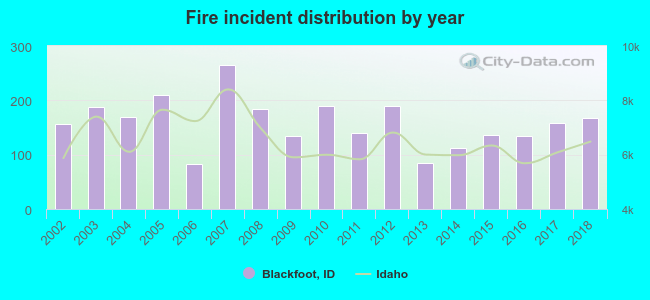 Based on the data from the years 2002 - 2018 the average number of fires per year is 159. The highest number of reported fire incidents - 265 took place in 2007, and the least - 83 in 2006. The data has a rising trend.
 The median response time based on all reported fire incidents is 8 minutes. This is comparable to the Idaho median value.
 Based on the data from the years 2002 - 2018 the average number of fire-related casualties per year is 0. The highest number of casualties - 1 took place in 2007, and the lowest - 0 in 2002. The data has a constant trend.
The average number of casualties per 1,000 fire incidents is 1. This indicator was the highest - 7 in 2009, and the lowest 0 in 2002. The trend for injuries per 1,000 fire incidents is constant. Compared to the Idaho value the number of injuries per 1,000 fire incidents is much lower.
Based on the data from the years 2002 - 2018 the average number of fire-related casualties per year is 0. The highest number of casualties - 1 took place in 2007, and the lowest - 0 in 2002. The data has a constant trend.
The average number of casualties per 1,000 fire incidents is 1. This indicator was the highest - 7 in 2009, and the lowest 0 in 2002. The trend for injuries per 1,000 fire incidents is constant. Compared to the Idaho value the number of injuries per 1,000 fire incidents is much lower.
 25.6% incidents where reported in the morning and 74.4% in the evening. The most fires (16.3%) took place on Saturday, and the least (12.3%) on Sunday.
 Based on the 2,700 incident reports from years 2002 - 2018 most fires (15.8%) took place during July, and the least (3.2%) in February.
 Out of all 4,938 cases reported during the years 2002 - 2018, the most belonged to the categories: Fire (54.7%), Hazardous Condition (16.3%), and False Alarm (11.3%).
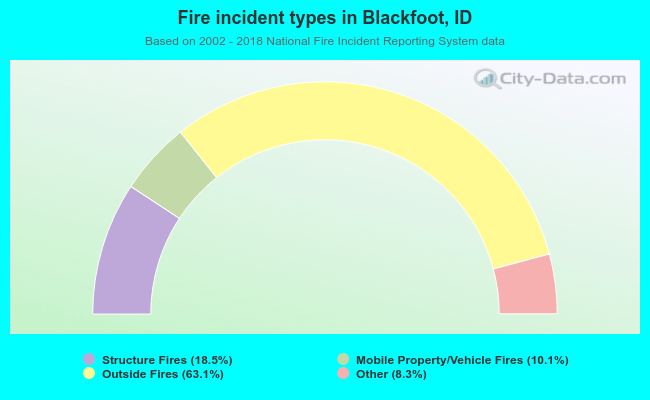 When looking into fire subcategories, the most reports belonged to: Outside Fires (63.1%), and Structure Fires (18.5%).