Boston: Fire Incidents, New York (NY)
Where are fire incidents reported in Boston, NY
Something went wrong! Please refresh the page.
|
| |||||||||||||||||||||||||||||||||||||||||||||||||||||||||||||||||||||||||||||||||||||||||||||||||||||||||||||
2002 - 2018 National Fire Incident Reporting System (NFIRS) incidents
- Incident types reported to NFIRS in Boston, NY
- 41126.4%Fire
- 36823.6%Hazardous Condition
- 33121.2%Rescue & EMS
- 19712.6%Good Intent Call
- 1187.6%False Alarm
- 1107.1%Service Call
- 151.0%Severe Weather
- 60.4%Overpressure Rupture
- 30.2%Special Incident
- Fire incident types reported to NFIRS in Boston, NY
- 28268.6%Structure Fires
- 5413.1%Outside Fires
- 5012.2%Mobile Property/Vehicle Fires
- 256.1%Other
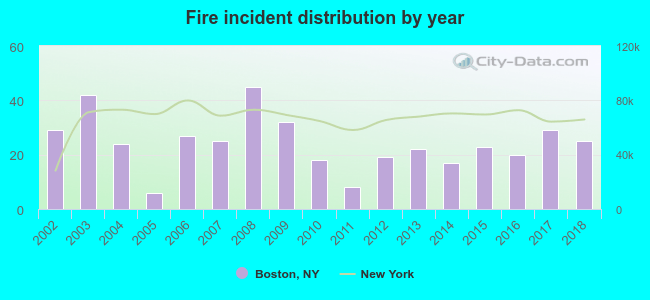 Based on the data from the years 2002 - 2018 the average number of fires per year is 24. The highest number of reported fire incidents - 45 took place in 2008, and the least - 6 in 2005. The data has a dropping trend.
The average number of yearly fire incidents per 10k residents in Boston, NY compared to nearest cities:
(Note: Based on data for the last 3 years, including only cities with population 5,000 and above)
| Boston: | 30.7 |
| Hamburg: | 177.0 |
| Concord: | 2.4 |
| East Aurora: | 27.7 |
| Lackawanna: | 37.7 |
| West Seneca: | 37.2 |
| Elma: | 14.1 |
| Collins: | 12.1 |
| Evans: | 3.5 |
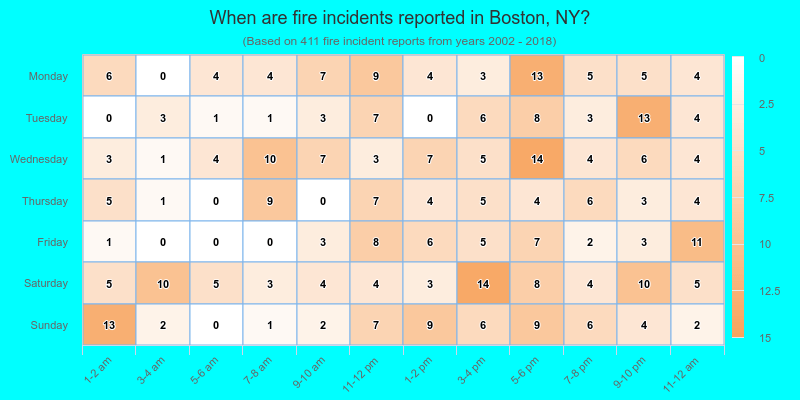
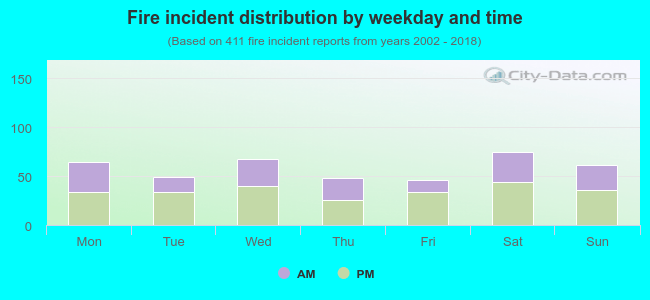 39.7% incidents where reported in the morning and 60.3% in the evening. The most fires (18.2%) took place on Saturday, and the least (11.2%) on Friday.
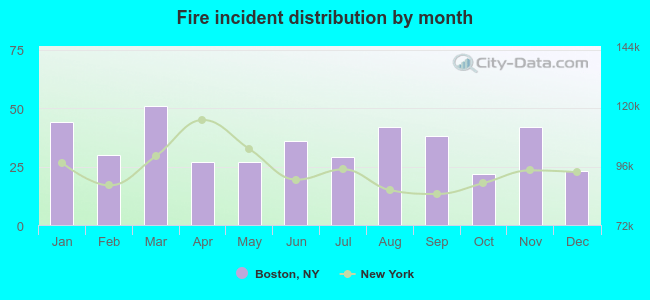 Based on the 411 incident reports from years 2002 - 2018 most fires (12.4%) took place during March, and the least (5.4%) in October.
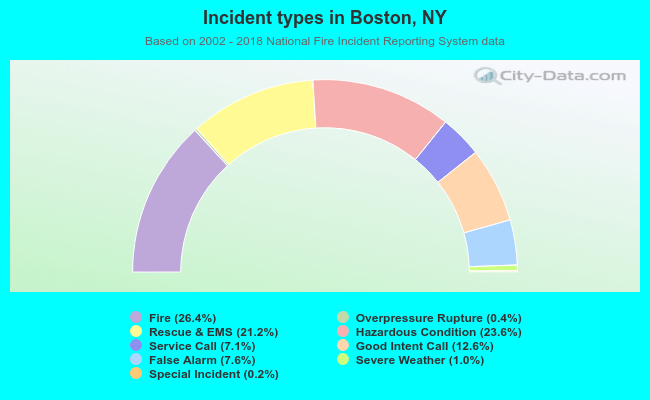 Out of all 1,559 cases reported during the years 2002 - 2018, the most belonged to the categories: Fire (26.4%), Hazardous Condition (23.6%), and Rescue & EMS (21.2%).
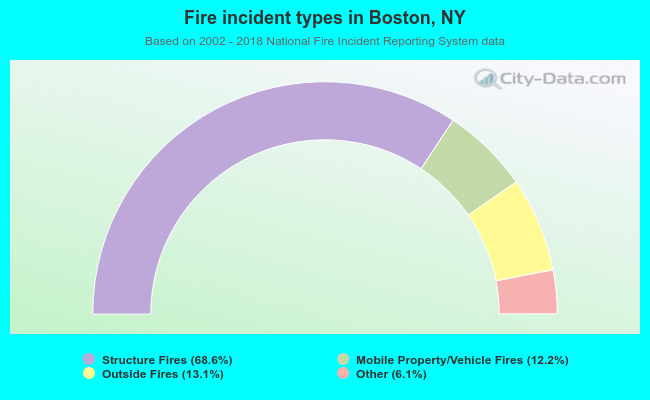 When looking into fire subcategories, the most incidents belonged to: Structure Fires (68.6%), and Outside Fires (13.1%).