Folsom: Fire Incidents, California (CA)
Where are fire incidents reported in Folsom, CA
Something went wrong! Please refresh the page.
|
| |||||||||||||||||||||||||||||||||||||||||||||||||||||||||||||||||||||||||||||||||||||||||||||||||||||||||||||
2005 - 2018 National Fire Incident Reporting System (NFIRS) incidents
- Incident types reported to NFIRS in Folsom, CA
- 4,61861.8%Rescue & EMS
- 97813.1%Good Intent Call
- 6979.3%Service Call
- 4486.0%False Alarm
- 3895.2%Fire
- 3284.4%Hazardous Condition
- 80.1%Special Incident
- Fire incident types reported to NFIRS in Folsom, CA
- 16442.2%Outside Fires
- 12632.4%Structure Fires
- 6817.5%Mobile Property/Vehicle Fires
- 318.0%Other
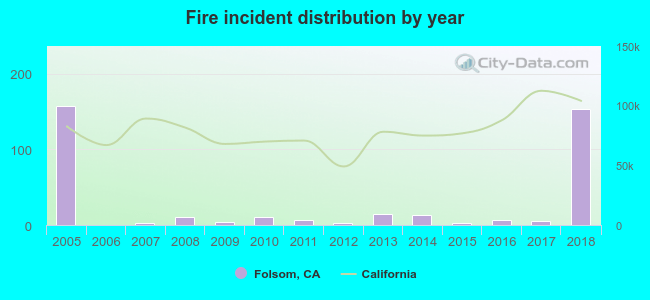 According to the data from the years 2005 - 2018 the average number of fire incidents per year is 28. The highest number of reported fire incidents - 158 took place in 2005, and the least - 0 in 2006. The data has a decreasing trend.
The average number of yearly fire incidents per 10k residents in Folsom, CA compared to nearest cities:
(Note: Based on data for the last 3 years, including only cities with population 5,000 and above)
| Folsom: | 7.3 |
| Orangevale: | 13.5 |
| El Dorado Hills: | 24.3 |
| Granite Bay: | 28.4 |
| Fair Oaks: | 14.0 |
| Gold River: | 2.5 |
| Citrus Heights: | 28.1 |
| Roseville: | 22.8 |
| Cameron Park: | 17.6 |

 30.6% incidents where reported in the morning and 69.4% in the evening. The most fires (18.3%) took place on Tuesday, and the least (10.0%) on Friday.
 Based on the 389 incident reports from years 2005 - 2018 most fires (18.8%) took place during July, and the least (4.1%) in March.
 Out of all 7,471 cases reported during the years 2005 - 2018, the most belonged to the categories: Rescue & EMS (61.8%), Good Intent Call (13.1%), and Service Call (9.3%).
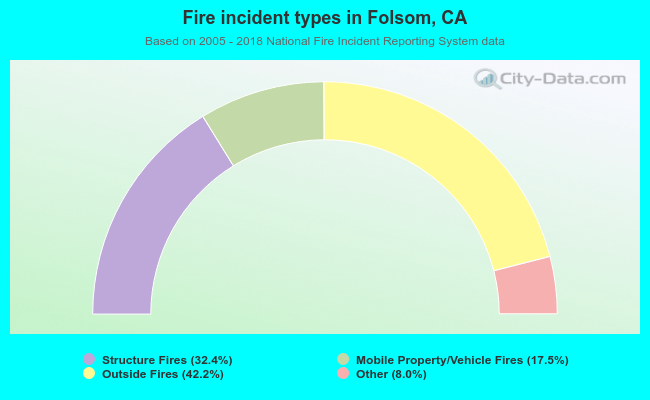 When looking into fire subcategories, the most incidents belonged to: Outside Fires (42.2%), and Structure Fires (32.4%).