Garberville: Fire Incidents, California (CA)
Where are fire incidents reported in Garberville, CA
Something went wrong! Please refresh the page.
|
| |||||||||||||||||||||||||||||||||||||||||||||||||||||||||||||||||||||||||||||||||||||||||||||||||||||||||||||
2006 - 2018 National Fire Incident Reporting System (NFIRS) incidents
- Incident types reported to NFIRS in Garberville, CA
- 26638.4%Rescue & EMS
- 17825.7%Fire
- 11416.5%Good Intent Call
- 618.8%False Alarm
- 426.1%Service Call
- 273.9%Hazardous Condition
- 20.3%Overpressure Rupture
- 20.3%Special Incident
- Fire incident types reported to NFIRS in Garberville, CA
- 11866.3%Outside Fires
- 2312.9%Structure Fires
- 1910.7%Other
- 1810.1%Mobile Property/Vehicle Fires
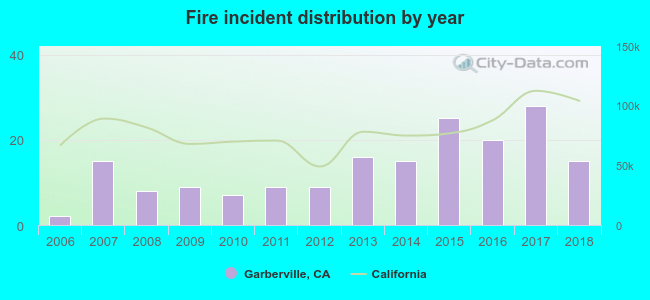 Based on the data from the years 2006 - 2018 the average number of fires per year is 14. The highest number of fire incidents - 28 took place in 2017, and the least - 2 in 2006. The data has an increasing trend.
The average number of yearly fire incidents per 10k residents in Garberville, CA compared to nearest cities:
(Note: Based on data for the last 3 years, including only cities with population 5,000 and above)
| Garberville: | 16.9 |
| Fortuna: | 1.7 |
| Eureka: | 2.5 |
| Arcata: | 51.3 |
| McKinleyville: | 36.0 |
| Fort Bragg: | 25.1 |
| Redding: | 33.0 |
| Ukiah: | 86.8 |

 32.0% incidents where reported in the morning and 68.0% in the evening. The most fires (19.7%) took place on Thursday, and the least (8.4%) on Monday.
 According to the 178 fire incidents from years 2006 - 2018 most fires (19.7%) took place during July, and the least (1.1%) in March.
 Out of all 692 cases reported during the years 2006 - 2018, the most belonged to the categories: Rescue & EMS (38.4%), Fire (25.7%), and Good Intent Call (16.5%).
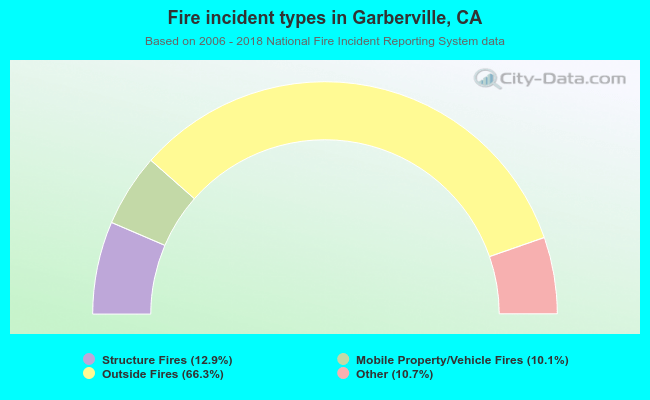 When looking into fire subcategories, the most incidents belonged to: Outside Fires (66.3%), and Structure Fires (12.9%).