Hewlett: Fire Incidents, New York (NY)
Where are fire incidents reported in Hewlett, NY
Something went wrong! Please refresh the page.
|
| |||||||||||||||||||||||||||||||||||||||||||||||||||||||||||||||||||||||||||||||||||||||||||||||||||||||||||||
2003 - 2018 National Fire Incident Reporting System (NFIRS) incidents
- Incident types reported to NFIRS in Hewlett, NY
- 57627.2%False Alarm
- 46722.1%Hazardous Condition
- 42119.9%Rescue & EMS
- 28213.3%Fire
- 25712.2%Good Intent Call
- 1125.3%Service Call
- Fire incident types reported to NFIRS in Hewlett, NY
- 17060.3%Structure Fires
- 6121.6%Outside Fires
- 3612.8%Mobile Property/Vehicle Fires
- 155.3%Other
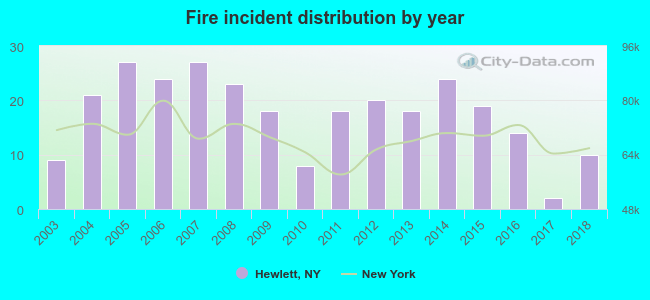 According to the data from the years 2003 - 2018 the average number of fire incidents per year is 18. The highest number of fires - 27 took place in 2005, and the least - 2 in 2017. The data has an increasing trend.
The average number of yearly fire incidents per 10k residents in Hewlett, NY compared to nearest cities:
(Note: Based on data for the last 3 years, including only cities with population 5,000 and above)
| Hewlett: | 12.7 |
| Woodmere: | 17.7 |
| East Rockaway: | 1.5 |
| Lynbrook: | 6.6 |
| Valley Stream: | 12.8 |
| Cedarhurst: | 28.5 |
| Malverne: | 6.2 |
| Lawrence: | 38.2 |
| Oceanside: | 8.7 |
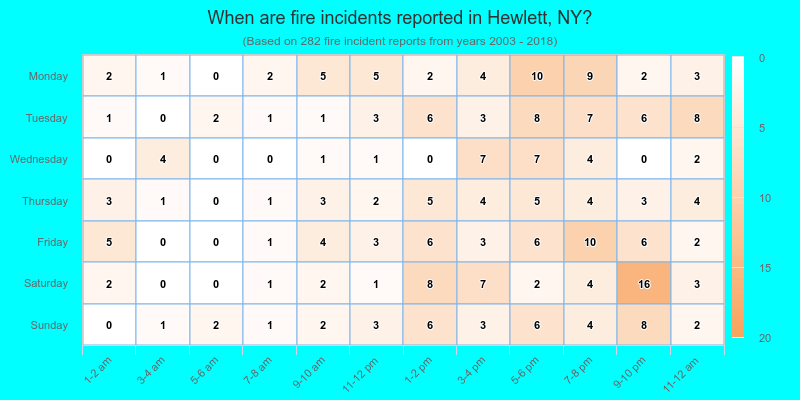
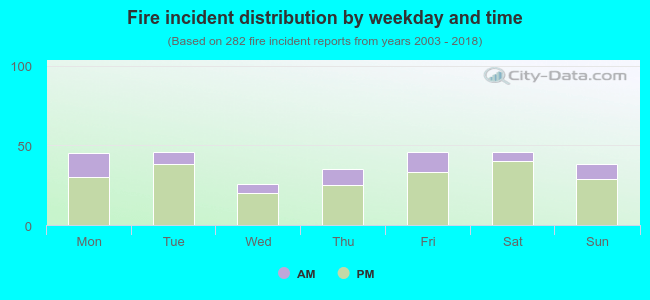 23.8% incidents where reported in the morning and 76.2% in the evening. The most fires (16.3%) took place on Tuesday, and the least (9.2%) on Wednesday.
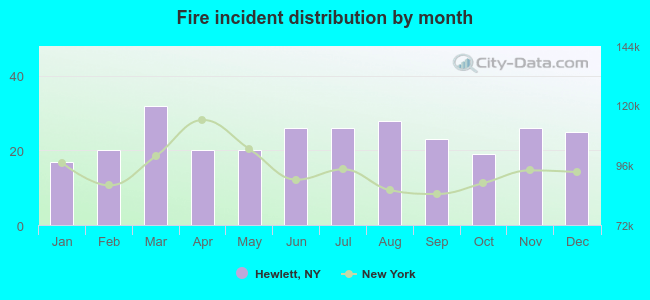 According to the 282 fire incident reports from years 2003 - 2018 most fires (11.3%) took place during March, and the least (6.0%) in January.
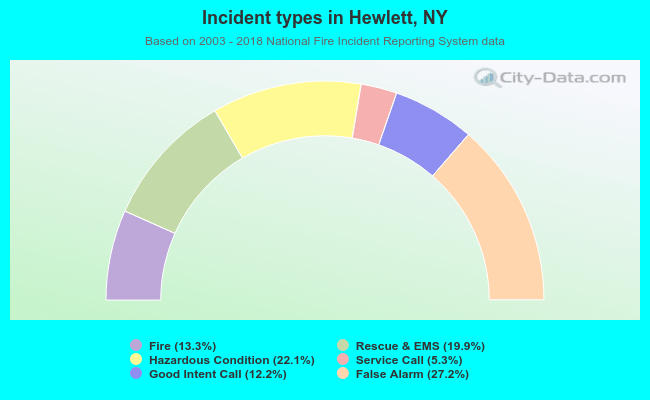 Out of all 2,115 cases reported during the years 2003 - 2018, the most belonged to the categories: Good Intent Call (27.2%), Rescue & EMS (22.1%), and Overpressure Rupture (19.9%).
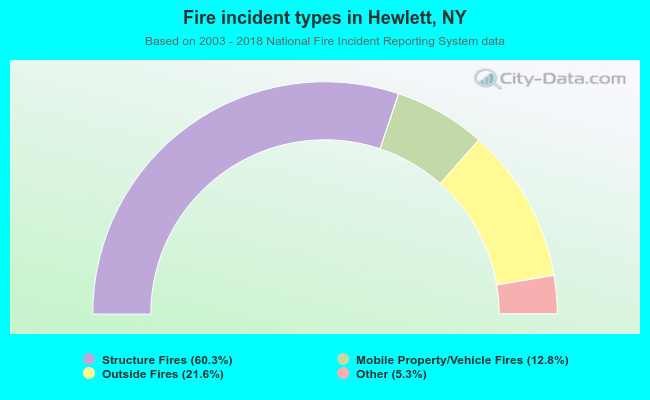 When looking into fire subcategories, the most reports belonged to: Structure Fires (60.3%), and Outside Fires (21.6%).