Jerome: Fire Incidents, Idaho (ID)
Where are fire incidents reported in Jerome, ID
Something went wrong! Please refresh the page.
| Fire incidents reported | |
|---|---|
| Sreet name | Count |
| LINCOLN ST | 108 |
| MAIN ST | 104 |
| LINCOLN AVE | 92 |
| 4TH AVE | 52 |
| FILLMORE ST | 52 |
| 10TH AVE | 40 |
| 2ND AVE | 36 |
| FIR ST | 36 |
| BUCHANAN ST | 34 |
| DAVIS ST | 32 |
| 6TH AVE | 30 |
| 7TH AVE | 30 |
| 5TH AVE | 28 |
| 8TH AVE | 26 |
| 16TH AVE | 24 |
| AVE F | 24 |
| TIGER DR | 24 |
| MILE 165 I 84 | 22 |
| AVE B | 20 |
| AVE C | 20 |
| DATE ST | 20 |
| DEVIL CORRAL RD. | 20 |
| MILE 170 I 84 | 20 |
| 1ST AVE | 18 |
| AVENUE I | 18 |
| 350 SHOSHONE FALLS RD | 16 |
| 3RD AVE | 16 |
| AVE I | 16 |
| AVENUE F | 16 |
| 200 | 14 |
| Other | 1,254 |
2002 - 2018 National Fire Incident Reporting System (NFIRS) incidents
- Incident types reported to NFIRS in Jerome, ID
- 4,19940.9%Rescue & EMS
- 2,40223.4%Hazardous Condition
- 2,26222.0%Fire
- 6806.6%Good Intent Call
- 4364.2%False Alarm
- 2562.5%Service Call
- 160.2%Special Incident
- Fire incident types reported to NFIRS in Jerome, ID
- 1,40862.2%Outside Fires
- 42318.7%Structure Fires
- 33614.9%Mobile Property/Vehicle Fires
- 954.2%Other
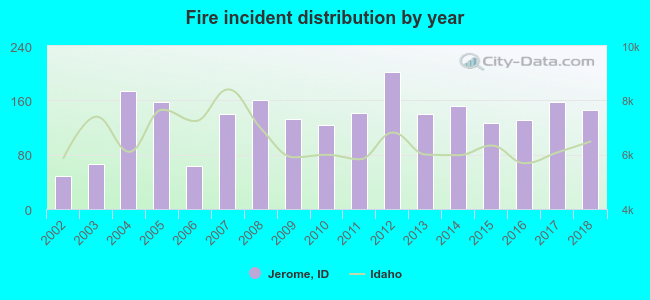 According to the data from the years 2002 - 2018 the average number of fires per year is 133. The highest number of reported fire incidents - 201 took place in 2012, and the least - 49 in 2002. The data has an increasing trend.
The average number of yearly fire incidents per 10k residents in Jerome, ID compared to nearest cities:
(Note: Based on data for the last 3 years, including only cities with population 5,000 and above)
| Jerome: | 129.3 |
| Twin Falls: | 26.6 |
| Burley: | 83.7 |
| Rupert: | 95.8 |
| Hailey: | 76.8 |
| Mountain Home: | 46.9 |
| Chubbuck: | 18.5 |
| Pocatello: | 25.5 |
| Boise: | 24.6 |
 The median response time based on all reported fire incidents is 7 minutes. This is close to the Idaho median value.
The median response time in Jerome, ID compared to nearest cities:
(Note: Based on data for all years, including only cities with at least 500 fire incidents)
| Jerome: | 7 minutes |
| Wendell: | 8 minutes |
| Twin Falls: | 5 minutes |
| Filer: | 9 minutes |
| Buhl: | 8 minutes |
| Kimberly: | 9 minutes |
| Gooding: | 10 minutes |
| Hagerman: | 11 minutes |
| Paul: | 6 minutes |
 According to the reports from the years 2002 - 2018 the average number of fire-related casualties per year is 0. The highest number of reported casualties - 1 took place in 2012, and the lowest - 0 in 2002. The data has a constant trend.
The average number of casualties per 1,000 fires is 1. This indicator was the highest - 8 in 2016, and the lowest 0 in 2002. The trend for injuries per 1,000 incidents is constant. Compared to the state value the number of injuries per 1,000 fires is much lower.
According to the reports from the years 2002 - 2018 the average number of fire-related casualties per year is 0. The highest number of reported casualties - 1 took place in 2012, and the lowest - 0 in 2002. The data has a constant trend.
The average number of casualties per 1,000 fires is 1. This indicator was the highest - 8 in 2016, and the lowest 0 in 2002. The trend for injuries per 1,000 incidents is constant. Compared to the state value the number of injuries per 1,000 fires is much lower.
 24.4% incidents where reported in the morning and 75.6% in the evening. The most fires (16.4%) took place on Saturday, and the least (12.2%) on Sunday.
 Based on the 2,262 incident reports from years 2002 - 2018 most fires (19.2%) took place during July, and the least (3.8%) in January.
 Out of all 10,262 cases reported during the years 2002 - 2018, the most belonged to the categories: Rescue & EMS (40.9%), Hazardous Condition (23.4%), and Fire (22.0%).
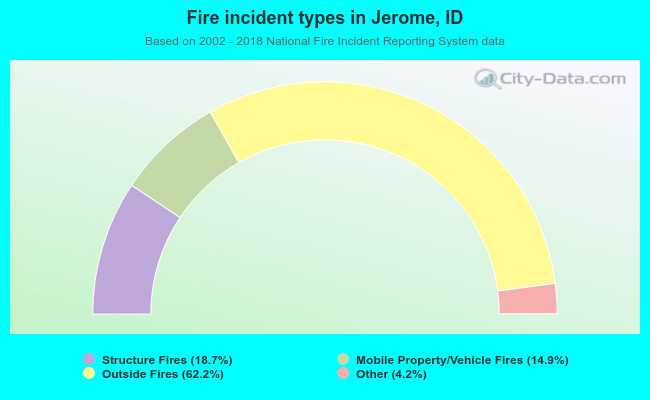 When looking into fire subcategories, the most incidents belonged to: Outside Fires (62.2%), and Structure Fires (18.7%).