Ketchikan: Fire Incidents, Alaska (AK)
Where are fire incidents reported in Ketchikan, AK
Something went wrong! Please refresh the page.
| Fire incidents reported | |
|---|---|
| Sreet name | Count |
| TONGASS HWY | 162 |
| TONGASS AVE | 132 |
| NORTH TONGASS HIGHWAY | 122 |
| BRYANT ST | 68 |
| WATER ST | 60 |
| SCHOENBAR RD | 50 |
| STEDMAN ST | 48 |
| FRONT ST | 42 |
| PARK AVE | 40 |
| BUREN RD | 34 |
| HEMLOCK ST | 34 |
| BARANOF AVE | 30 |
| DOCK ST | 30 |
| MISSION ST | 30 |
| DEERMOUNT ST | 28 |
| JACKSON ST | 28 |
| SHORELINE DR | 28 |
| KILLER WHALE ST | 26 |
| SOUTH TONGASS SERVICE ARA | 26 |
| TONGASS | 24 |
| MAIN ST | 22 |
| ROOSEVELT DR | 20 |
| SECOND AVE | 20 |
| AUSTIN ST | 16 |
| FOREST PARK DR | 16 |
| BAWDEN ST | 14 |
| KETCHIKAN LAKES RD | 14 |
| AUSTIN | 12 |
| BAR HARBOR | 12 |
| BROWN DEER RD | 12 |
| Other | 22 |
2002 - 2018 National Fire Incident Reporting System (NFIRS) incidents
- Incident types reported to NFIRS in Ketchikan, AK
- 9,46169.2%Rescue & EMS
- 1,2228.9%Fire
- 1,1608.5%Good Intent Call
- 6764.9%False Alarm
- 5864.3%Hazardous Condition
- 5283.9%Service Call
- 160.1%Overpressure Rupture
- Fire incident types reported to NFIRS in Ketchikan, AK
- 61450.2%Structure Fires
- 38231.3%Outside Fires
- 16513.5%Mobile Property/Vehicle Fires
- 615.0%Other
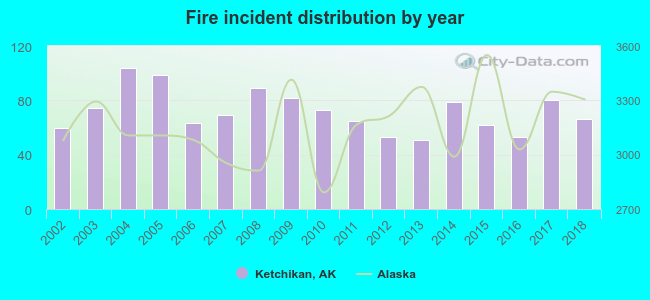 Based on the data from the years 2002 - 2018 the average number of fire incidents per year is 72. The highest number of reported fire incidents - 104 took place in 2004, and the least - 51 in 2013. The data has a growing trend.
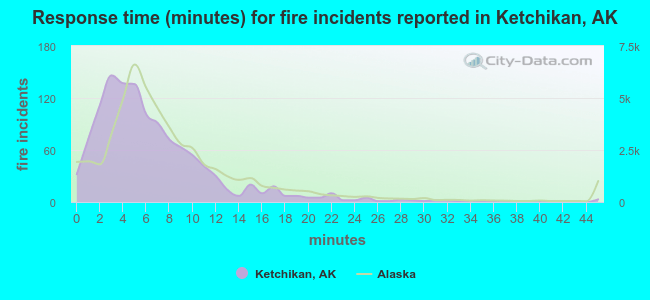 The median response time based on all reported fire incidents is 5 minutes. This is lower than the state median value.
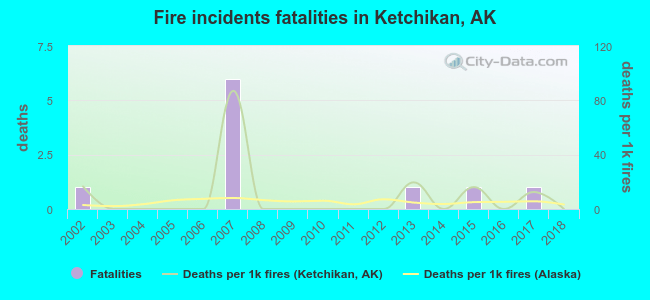 Based on the reports from the years 2002 - 2018 the average number of fire-related fatalities per year is 1. The highest number of reported deaths - 6 took place in 2007, and the lowest - 0 in 2003. The data has a declining trend.
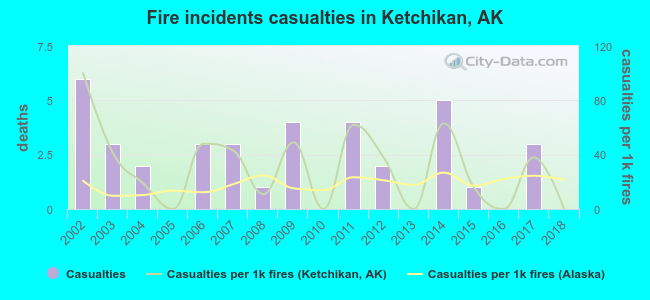 Based on the reports from the years 2002 - 2018 the average number of fire-related yearly casualties is 2. The highest number of reported injuries - 6 took place in 2002, and the lowest - 0 in 2005. The data has a decreasing trend.
The average number of injuries per 1,000 fire incidents is 31. This indicator was the highest - 100 in 2002, and the lowest 0 in 2005. The trend for casualties per 1,000 fires is declining. Compared to the state value the number of casualties per 1,000 fire incidents is higher.
Based on the reports from the years 2002 - 2018 the average number of fire-related yearly casualties is 2. The highest number of reported injuries - 6 took place in 2002, and the lowest - 0 in 2005. The data has a decreasing trend.
The average number of injuries per 1,000 fire incidents is 31. This indicator was the highest - 100 in 2002, and the lowest 0 in 2005. The trend for casualties per 1,000 fires is declining. Compared to the state value the number of casualties per 1,000 fire incidents is higher.
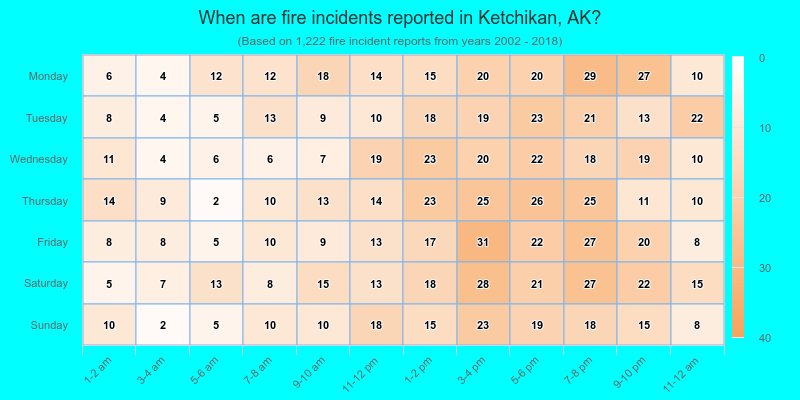
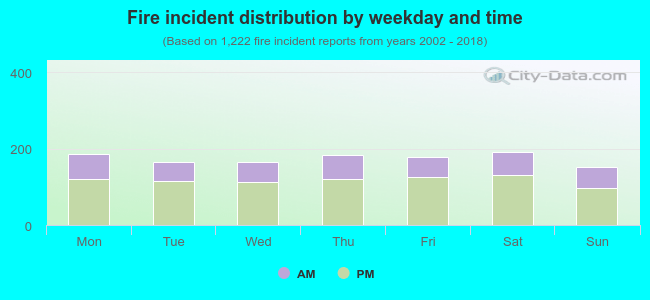 32.7% incidents where reported in the morning and 67.3% in the evening. The most fires (15.7%) took place on Saturday, and the least (12.5%) on Sunday.
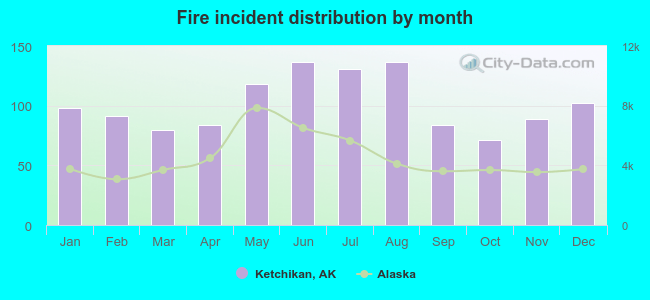 Based on the 1,222 incident reports from years 2002 - 2018 most fires (11.2%) took place during June, and the least (5.8%) in October.
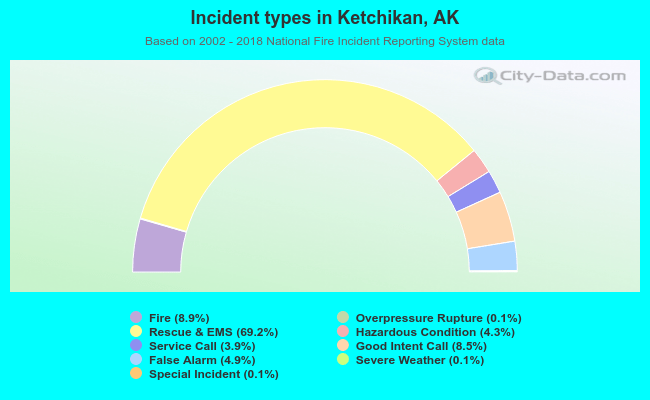 Out of all 13,673 cases reported during the years 2002 - 2018, the most belonged to the categories: Rescue & EMS (69.2%), Fire (8.9%), and Good Intent Call (8.5%).
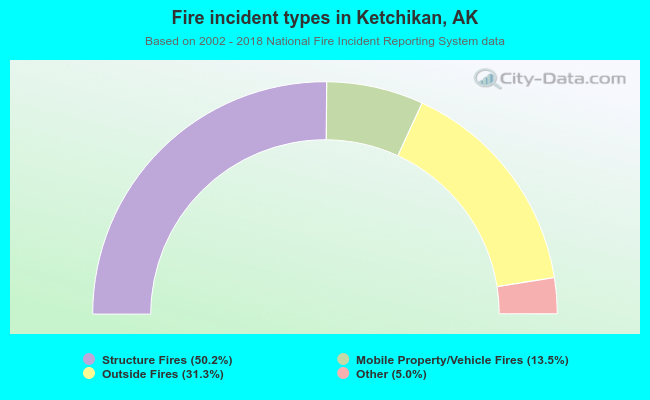 When looking into fire subcategories, the most incidents belonged to: Structure Fires (50.2%), and Outside Fires (31.3%).