Mastic: Fire Incidents, New York (NY)
Where are fire incidents reported in Mastic, NY
Something went wrong! Please refresh the page.
|
| |||||||||||||||||||||||||||||||||||||||||||||||||||||||||||||||||||||||||||||||||||||||||||||||||||||||||||||
2002 - 2018 National Fire Incident Reporting System (NFIRS) incidents
- Incident types reported to NFIRS in Mastic, NY
- 58930.6%Hazardous Condition
- 54528.4%False Alarm
- 28414.8%Service Call
- 24412.7%Rescue & EMS
- 1296.7%Good Intent Call
- 1276.6%Fire
- 20.1%Overpressure Rupture
- 20.1%Special Incident
- Fire incident types reported to NFIRS in Mastic, NY
- 7760.6%Structure Fires
- 4434.6%Outside Fires
- 53.9%Other
- 10.8%Mobile Property/Vehicle Fires
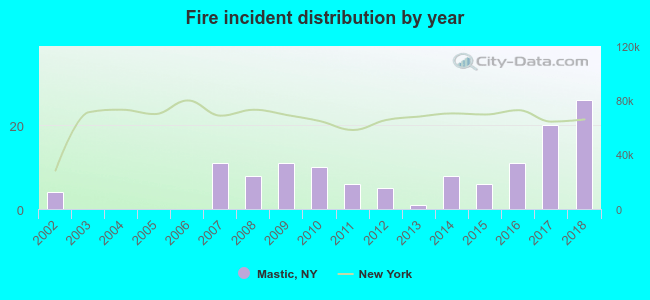 Based on the data from the years 2002 - 2018 the average number of fire incidents per year is 7. The highest number of reported fire incidents - 26 took place in 2018, and the least - 0 in 2003. The data has a rising trend.
The average number of yearly fire incidents per 10k residents in Mastic, NY compared to nearest cities:
(Note: Based on data for the last 3 years, including only cities with population 5,000 and above)
| Mastic: | 12.3 |
| Shirley: | 20.6 |
| Center Moriches: | 7.9 |
| Mastic Beach: | 21.3 |
| Manorville: | 12.1 |
| East Moriches: | 13.3 |
| Yaphank: | 26.4 |
| Medford: | 37.3 |
| Ridge: | 25.5 |

 33.1% incidents where reported in the morning and 66.9% in the evening. The most fires (20.5%) took place on Friday, and the least (10.2%) on Saturday.
 According to the 127 incident reports from years 2002 - 2018 most fires (12.6%) took place during July, and the least (3.9%) in October.
 Out of all 1,922 cases reported during the years 2002 - 2018, the most belonged to the categories: Hazardous Condition (30.6%), False Alarm (28.4%), and Service Call (14.8%).
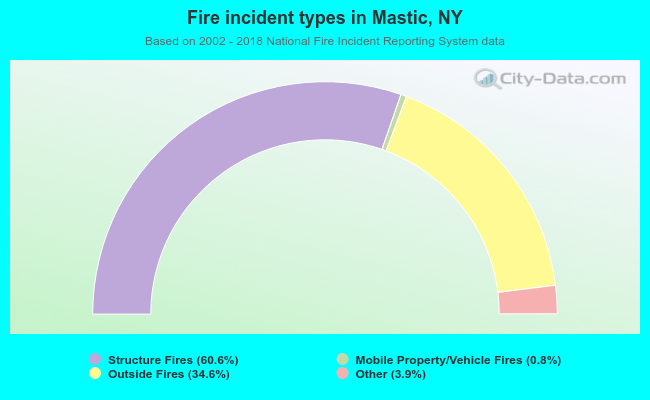 When looking into fire subcategories, the most reports belonged to: Structure Fires (60.6%), and Outside Fires (34.6%).