North Tonawanda: Fire Incidents, New York (NY)
Where are fire incidents reported in North Tonawanda, NY
Something went wrong! Please refresh the page.
| Fire incidents reported | |
|---|---|
| Sreet name | Count |
| OLIVER ST | 156 |
| PAYNE AVE | 126 |
| NIAGARA FALLS BLVD | 98 |
| NASH RD | 80 |
| SWEENEY ST | 78 |
| MEADOW DR | 66 |
| RIVER RD | 66 |
| ROBINSON ST | 64 |
| SHAWNEE RD | 58 |
| WARD RD | 56 |
| WHEATFIELD ST | 42 |
| RIDGE RD | 40 |
| SCHENCK ST | 40 |
| TOWNLINE RD | 38 |
| ROBERT DR | 36 |
| TONAWANDA CREEK RD | 36 |
| GOUNDRY ST | 32 |
| MAIN ST | 32 |
| MILLER ST | 30 |
| BRIDGE ST | 28 |
| CAMPBELL BLVD | 28 |
| DIVISION ST | 28 |
| RUMBOLD AVE | 28 |
| STENZIL ST | 28 |
| BEAR RIDGE RD | 26 |
| SCHULTZ RD | 26 |
| TREMONT ST | 26 |
| BRYANT ST | 24 |
| WITMER RD | 24 |
| ERIE AVE | 22 |
| Other | 66 |
2002 - 2018 National Fire Incident Reporting System (NFIRS) incidents
- Incident types reported to NFIRS in North Tonawanda, NY
- 15,32264.8%Rescue & EMS
- 2,2659.6%False Alarm
- 2,2039.3%Hazardous Condition
- 1,5416.5%Service Call
- 1,5286.5%Fire
- 5832.5%Good Intent Call
- 1340.6%Overpressure Rupture
- 440.2%Special Incident
- Fire incident types reported to NFIRS in North Tonawanda, NY
- 59138.7%Outside Fires
- 48231.5%Structure Fires
- 28318.5%Other
- 17211.3%Mobile Property/Vehicle Fires
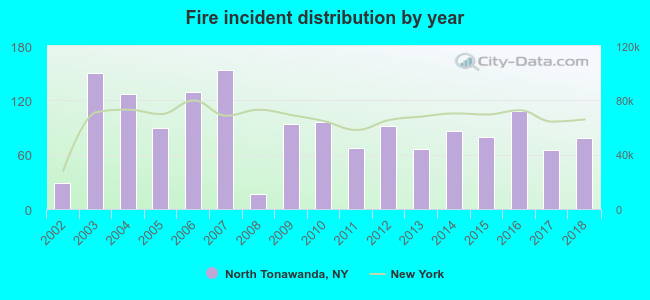 Based on the data from the years 2002 - 2018 the average number of fire incidents per year is 90. The highest number of reported fires - 154 took place in 2007, and the least - 17 in 2008. The data has an increasing trend.
The average number of yearly fire incidents per 10k residents in North Tonawanda, NY compared to nearest cities:
(Note: Based on data for the last 3 years, including only cities with population 5,000 and above)
| North Tonawanda: | 27.1 |
| Tonawanda: | 81.5 |
| Grand Island: | 26.7 |
| Kenmore: | 21.9 |
| Amherst: | 14.9 |
| Eggertsville: | 1.0 |
| Pendleton: | 1.6 |
| Niagara Falls: | 80.8 |
| Williamsville: | 100.3 |
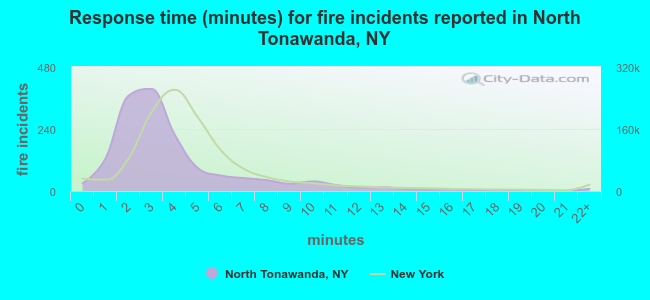 The median response time based on all reported fire incidents is 3 minutes. This is lower compared to the New York median value.
The median response time in North Tonawanda, NY compared to nearest cities:
(Note: Based on data for all years, including only cities with at least 500 fire incidents)
| North Tonawanda: | 3 minutes |
| Tonawanda: | 2 minutes |
| Grand Island: | 4 minutes |
| Kenmore: | 2 minutes |
| Amherst: | 4 minutes |
| Niagara Falls: | 3 minutes |
| Williamsville: | 4 minutes |
| Buffalo: | 3 minutes |
| Cheektowaga: | 4 minutes |
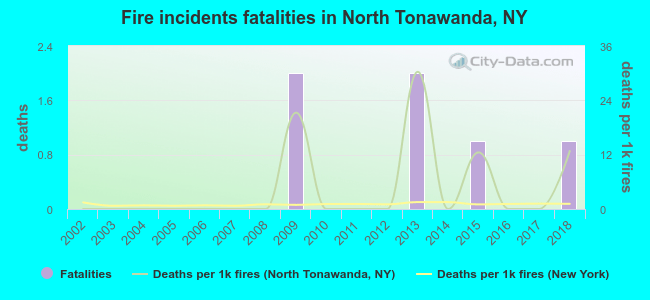 According to the data from the years 2002 - 2018 the average number of fire-related yearly deaths is 0. The highest number of deaths - 2 took place in 2009, and the lowest - 0 in 2002. The data has a growing trend.
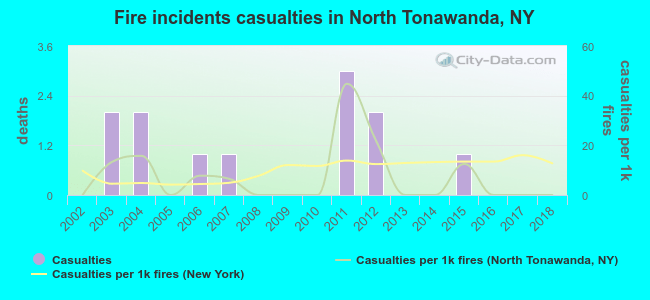 According to the data from the years 2002 - 2018 the average number of fire-related casualties per year is 1. The highest number of casualties - 3 took place in 2011, and the lowest - 0 in 2002. The data has a constant trend.
The average number of casualties per 1,000 fires is 7. This indicator was the highest - 45 in 2011, and the lowest 0 in 2002. The trend for injuries per 1,000 fire incidents is constant. Compared to the state value the number of casualties per 1,000 fire incidents is lower.
According to the data from the years 2002 - 2018 the average number of fire-related casualties per year is 1. The highest number of casualties - 3 took place in 2011, and the lowest - 0 in 2002. The data has a constant trend.
The average number of casualties per 1,000 fires is 7. This indicator was the highest - 45 in 2011, and the lowest 0 in 2002. The trend for injuries per 1,000 fire incidents is constant. Compared to the state value the number of casualties per 1,000 fire incidents is lower.Casualties per 1,000 incidents in North Tonawanda, NY compared to nearest cities:
(Note: Based on data for all years, including only cities with at least 500 fire incidents)
| North Tonawanda: | 7.9 |
| Tonawanda: | 20.9 |
| Grand Island: | 8.1 |
| Kenmore: | 35.6 |
| Amherst: | 6.6 |
| Niagara Falls: | 22.3 |
| Williamsville: | 3.3 |
| Buffalo: | 5.5 |
| Cheektowaga: | 9.8 |
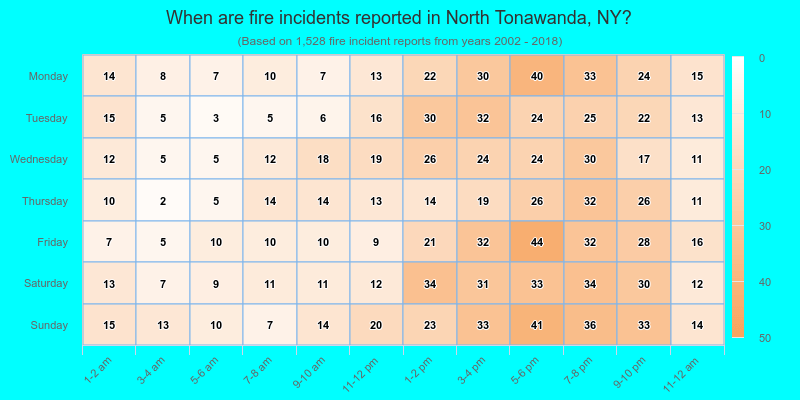
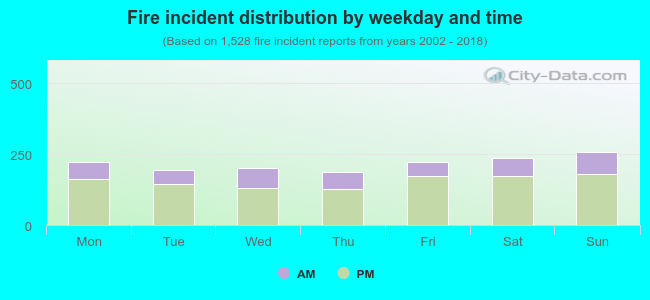 28.2% incidents where reported in the morning and 71.8% in the evening. The most fires (17.0%) took place on Sunday, and the least (12.2%) on Thursday.
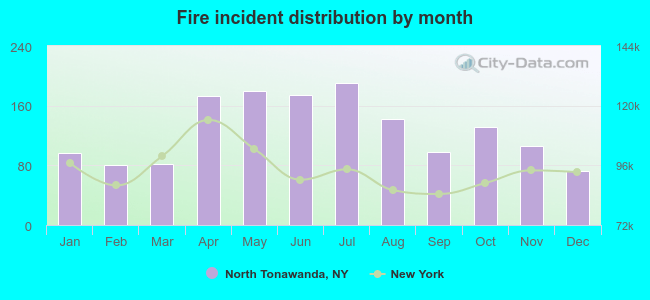 Based on the 1,528 reports from years 2002 - 2018 most fires (12.5%) took place during July, and the least (4.7%) in December.
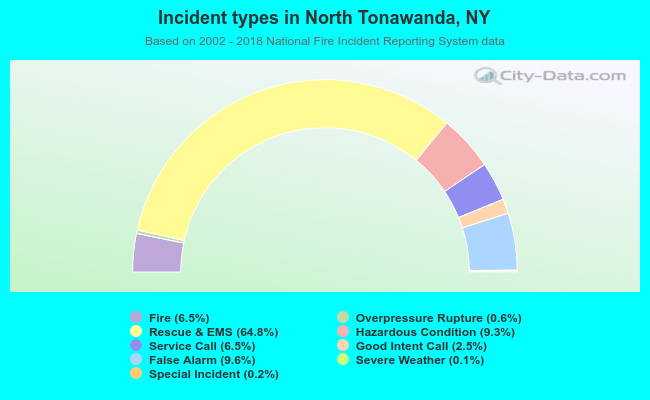 Out of all 23,640 cases reported during the years 2002 - 2018, the most belonged to the categories: Rescue & EMS (64.8%), False Alarm (9.6%), and Hazardous Condition (9.3%).
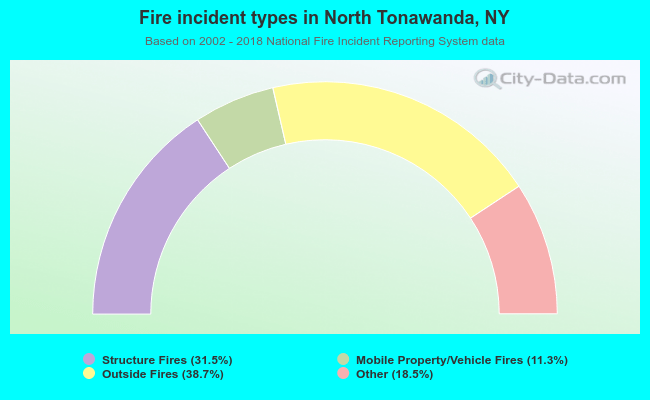 When looking into fire subcategories, the most reports belonged to: Outside Fires (38.7%), and Structure Fires (31.5%).