Porterville: Fire Incidents, California (CA)
Where are fire incidents reported in Porterville, CA
Something went wrong! Please refresh the page.
| Fire incidents reported | |
|---|---|
| Sreet name | Count |
| TULE RIVER RIV | 344 |
| TULE RIVER | 274 |
| OLIVE AVE | 196 |
| MAIN ST | 180 |
| HENDERSON AVE | 162 |
| PLANO ST | 154 |
| RESERVATION RD | 152 |
| HWY 65 HWY | 148 |
| PUTNAM AVE | 126 |
| MORTON AVE | 114 |
| SPRINGVILLE DR | 110 |
| NEWCOMB ST | 104 |
| INDIANA ST | 90 |
| DATE AVE | 88 |
| HWY 190 | 86 |
| E ST | 80 |
| POPLAR AVE | 78 |
| ORANGE AVE | 74 |
| HWY 190 HWY | 70 |
| JAYE ST | 64 |
| CLEO AVE | 58 |
| VANDALIA AVE | 54 |
| H190 HWY | 52 |
| MAIN | 52 |
| G ST | 50 |
| OLIVE | 50 |
| PLANO | 50 |
| RIVER AVE | 50 |
| TOMAH AVE | 50 |
| SPRINGVILLE AVE | 48 |
| Other | 552 |
2005 - 2018 National Fire Incident Reporting System (NFIRS) incidents
- Incident types reported to NFIRS in Porterville, CA
- 8,68949.7%Rescue & EMS
- 3,76021.5%Fire
- 1,82510.4%Service Call
- 1,3908.0%Good Intent Call
- 1,0486.0%Hazardous Condition
- 6743.9%False Alarm
- 560.3%Special Incident
- 290.2%Overpressure Rupture
- Fire incident types reported to NFIRS in Porterville, CA
- 2,24659.7%Outside Fires
- 88723.6%Structure Fires
- 51013.6%Mobile Property/Vehicle Fires
- 1173.1%Other
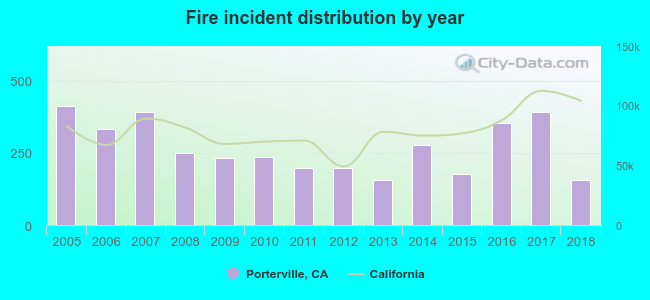 Based on the data from the years 2005 - 2018 the average number of fire incidents per year is 269. The highest number of reported fire incidents - 413 took place in 2005, and the least - 155 in 2018. The data has a declining trend.
The average number of yearly fire incidents per 10k residents in Porterville, CA compared to nearest cities:
(Note: Based on data for the last 3 years, including only cities with population 5,000 and above)
| Porterville: | 54.1 |
| Lindsay: | 35.6 |
| Exeter: | 87.5 |
| Earlimart: | 91.4 |
| Farmersville: | 36.5 |
| Tulare: | 50.4 |
| Visalia: | 41.3 |
| Delano: | 26.3 |
| Woodlake: | 77.9 |
 The median response time based on all reported fire incidents is 5 minutes. This is lower than the California median value.
The median response time in Porterville, CA compared to nearest cities:
(Note: Based on data for all years, including only cities with at least 500 fire incidents)
| Porterville: | 5 minutes |
| Lindsay: | 8 minutes |
| Exeter: | 7 minutes |
| Earlimart: | 8 minutes |
| Farmersville: | 5 minutes |
| Tulare: | 5 minutes |
| Visalia: | 6 minutes |
| Delano: | 7 minutes |
| Woodlake: | 7 minutes |
 Based on the reports from the years 2005 - 2018 the average number of fire-related fatalities per year is 1. The highest number of reported deaths - 3 took place in 2007, and the lowest - 0 in 2005. The data has a constant trend.
The average number of deaths per 1,000 fires is 2. This indicator was the highest - 8 in 2007, and the lowest 0 in 2005. The trend for fatalities per 1,000 incidents is constant. Compared to the California value the number of fatalities per 1,000 fires is higher.
Based on the reports from the years 2005 - 2018 the average number of fire-related fatalities per year is 1. The highest number of reported deaths - 3 took place in 2007, and the lowest - 0 in 2005. The data has a constant trend.
The average number of deaths per 1,000 fires is 2. This indicator was the highest - 8 in 2007, and the lowest 0 in 2005. The trend for fatalities per 1,000 incidents is constant. Compared to the California value the number of fatalities per 1,000 fires is higher.
 Based on the reports from the years 2005 - 2018 the average number of fire-related yearly casualties is 2. The highest number of reported casualties - 5 took place in 2012, and the lowest - 0 in 2006. The data has a decreasing trend.
The average number of casualties per 1,000 fire incidents is 8. This indicator was the highest - 25 in 2012, and the lowest 0 in 2006. The trend for injuries per 1,000 fires is decreasing. Compared to the California value the number of casualties per 1,000 incidents is higher.
Based on the reports from the years 2005 - 2018 the average number of fire-related yearly casualties is 2. The highest number of reported casualties - 5 took place in 2012, and the lowest - 0 in 2006. The data has a decreasing trend.
The average number of casualties per 1,000 fire incidents is 8. This indicator was the highest - 25 in 2012, and the lowest 0 in 2006. The trend for injuries per 1,000 fires is decreasing. Compared to the California value the number of casualties per 1,000 incidents is higher.
 32.8% incidents where reported in the morning and 67.2% in the evening. The most fires (16.0%) took place on Sunday, and the least (13.3%) on Tuesday.
 According to the 3,760 fire incident reports from years 2005 - 2018 most fires (15.7%) took place during June, and the least (3.8%) in February.
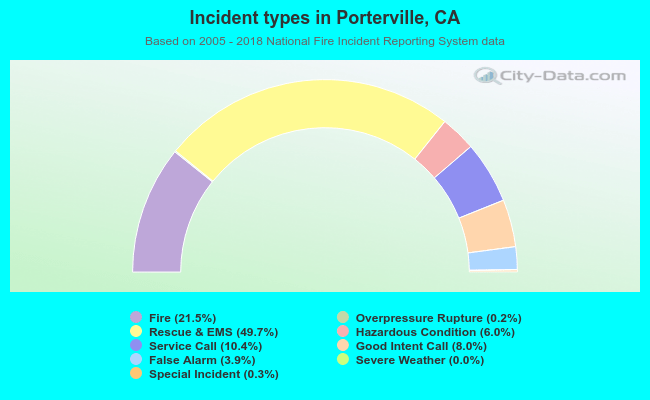 Out of all 17,474 cases reported during the years 2005 - 2018, the most belonged to the categories: Rescue & EMS (49.7%), Fire (21.5%), and Service Call (10.4%).
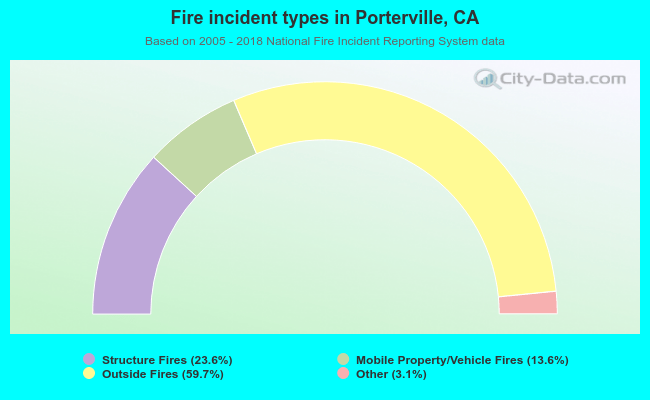 When looking into fire subcategories, the most incidents belonged to: Outside Fires (59.7%), and Structure Fires (23.6%).