Riverbank: Fire Incidents, California (CA)
Where are fire incidents reported in Riverbank, CA
Something went wrong! Please refresh the page.
|
| |||||||||||||||||||||||||||||||||||||||||||||||||||||||||||||||||||||||||||||||||||||||||||||||||||||||||||||
2005 - 2018 National Fire Incident Reporting System (NFIRS) incidents
- Incident types reported to NFIRS in Riverbank, CA
- 3,81657.0%Rescue & EMS
- 1,02615.3%Good Intent Call
- 74311.1%Fire
- 5828.7%Service Call
- 2944.4%Hazardous Condition
- 2013.0%False Alarm
- 250.4%Special Incident
- Fire incident types reported to NFIRS in Riverbank, CA
- 35247.4%Outside Fires
- 29439.6%Structure Fires
- 658.7%Mobile Property/Vehicle Fires
- 324.3%Other
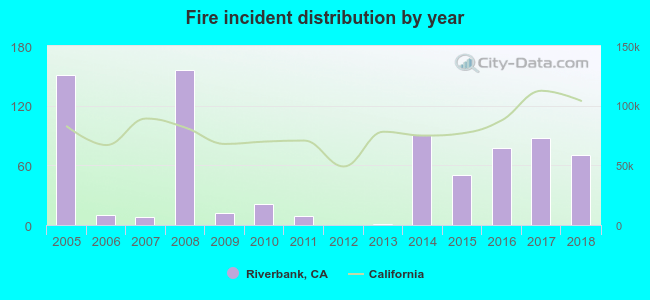 Based on the data from the years 2005 - 2018 the average number of fire incidents per year is 53. The highest number of fires - 156 took place in 2008, and the least - 0 in 2012. The data has a dropping trend.
The average number of yearly fire incidents per 10k residents in Riverbank, CA compared to nearest cities:
(Note: Based on data for the last 3 years, including only cities with population 5,000 and above)
| Riverbank: | 32.8 |
| Escalon: | 70.4 |
| Oakdale: | 39.2 |
| Modesto: | 68.9 |
| Salida: | 6.6 |
| Ceres: | 36.3 |
| Hughson: | 25.4 |
| Ripon: | 46.5 |
| Waterford: | 54.2 |
 The median response time based on all reported fire incidents is 6 minutes. This is close to the California median value.
The median response time in Riverbank, CA compared to nearest cities:
(Note: Based on data for all years, including only cities with at least 500 fire incidents)
| Riverbank: | 6 minutes |
| Oakdale: | 6 minutes |
| Modesto: | 5 minutes |
| Ceres: | 5 minutes |
| Ripon: | 6 minutes |
| Manteca: | 5 minutes |
| Turlock: | 5 minutes |
| Lathrop: | 6 minutes |
| Patterson: | 5 minutes |
 34.7% incidents where reported in the morning and 65.3% in the evening. The most fires (16.2%) took place on Sunday, and the least (11.7%) on Monday.
 According to the 743 incident reports from years 2005 - 2018 most fires (15.1%) took place during July, and the least (3.4%) in March.
 Out of all 6,693 cases reported during the years 2005 - 2018, the most belonged to the categories: Rescue & EMS (57.0%), Good Intent Call (15.3%), and Fire (11.1%).
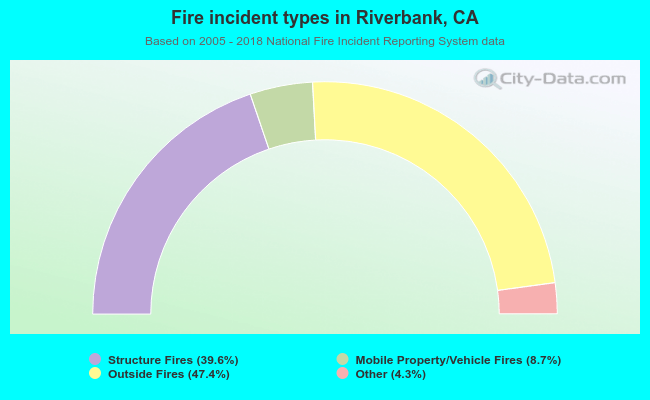 When looking into fire subcategories, the most reports belonged to: Outside Fires (47.4%), and Structure Fires (39.6%).