Rye Brook: Fire Incidents, New York (NY)
Where are fire incidents reported in Rye Brook, NY
Something went wrong! Please refresh the page.
|
| |||||||||||||||||||||||||||||||||||||||||||||||||||||||||||||||||||||||||||||||||||||||||||||||||||||||||||||
2002 - 2018 National Fire Incident Reporting System (NFIRS) incidents
- Incident types reported to NFIRS in Rye Brook, NY
- 1,25836.9%False Alarm
- 76922.6%Hazardous Condition
- 63118.5%Rescue & EMS
- 2718.0%Good Intent Call
- 2366.9%Fire
- 2286.7%Service Call
- 110.3%Overpressure Rupture
- Fire incident types reported to NFIRS in Rye Brook, NY
- 12854.2%Structure Fires
- 6427.1%Outside Fires
- 3514.8%Mobile Property/Vehicle Fires
- 93.8%Other
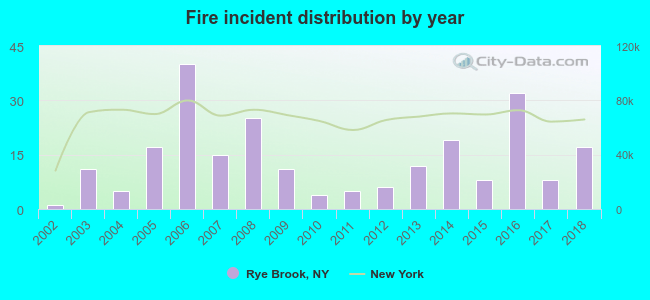 Based on the data from the years 2002 - 2018 the average number of fires per year is 14. The highest number of reported fires - 40 took place in 2006, and the least - 1 in 2002. The data has an increasing trend.
The average number of yearly fire incidents per 10k residents in Rye Brook, NY compared to nearest cities:
(Note: Based on data for the last 3 years, including only cities with population 5,000 and above)
| Rye Brook: | 19.9 |
| Port Chester: | 7.6 |
| Harrison: | 10.5 |
| Rye: | 23.8 |
| White Plains: | 29.4 |
| Scarsdale: | 26.9 |
| Hartsdale: | 102.7 |
| North Castle: | 5.9 |
| Larchmont: | 22.9 |

 26.3% incidents where reported in the morning and 73.7% in the evening. The most fires (18.6%) took place on Sunday, and the least (10.2%) on Saturday.
 Based on the 236 reports from years 2002 - 2018 most fires (14.0%) took place during March, and the least (4.2%) in May.
 Out of all 3,405 cases reported during the years 2002 - 2018, the most belonged to the categories: False Alarm (36.9%), Hazardous Condition (22.6%), and Rescue & EMS (18.5%).
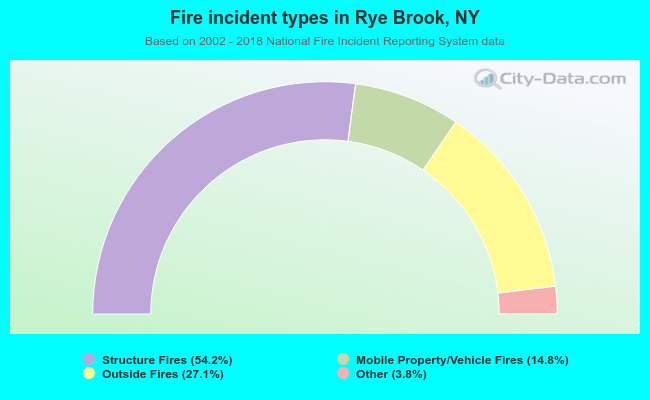 When looking into fire subcategories, the most reports belonged to: Structure Fires (54.2%), and Outside Fires (27.1%).