San Bruno: Fire Incidents, California (CA)
Where are fire incidents reported in San Bruno, CA
Something went wrong! Please refresh the page.
| Fire incidents reported | |
|---|---|
| Sreet name | Count |
| EL CAMINO REAL | 222 |
| 280 | 104 |
| SAN MATEO AV | 96 |
| 101 | 78 |
| SHELTER CREEK LA | 66 |
| CRYSTAL SPRINGS RD | 64 |
| 380 | 62 |
| COMMODORE DR | 56 |
| CHERRY AV | 52 |
| FLEETWOOD DR | 50 |
| HUNTINGTON AV | 50 |
| CRESTMOOR DR | 46 |
| NATIONAL AV | 42 |
| SHELTER CREEK | 40 |
| SHELTER CREEK LANE | 38 |
| HUNTINGTON AVE | 36 |
| LINDEN AV | 36 |
| SAN MATEO | 36 |
| BAYSHORE CIR | 34 |
| GREEN AV | 32 |
| NATIONAL | 32 |
| SAN ANTONIO AV | 32 |
| COLLEGE DR | 30 |
| ROLLINGWOOD DR | 30 |
| 4TH AV | 28 |
| BOARDWALK DR | 28 |
| EASTON AV | 28 |
| LAKE DR | 28 |
| POPLAR AV | 28 |
| SAN BRUNO AV | 28 |
| Other | 375 |
2005 - 2018 National Fire Incident Reporting System (NFIRS) incidents
- Incident types reported to NFIRS in San Bruno, CA
- 8,71951.6%Rescue & EMS
- 2,52214.9%Hazardous Condition
- 1,90711.3%Fire
- 1,5349.1%Good Intent Call
- 1,1576.8%Service Call
- 1,0176.0%False Alarm
- 280.2%Overpressure Rupture
- Fire incident types reported to NFIRS in San Bruno, CA
- 1,02153.5%Structure Fires
- 57230.0%Outside Fires
- 25613.4%Mobile Property/Vehicle Fires
- 583.0%Other
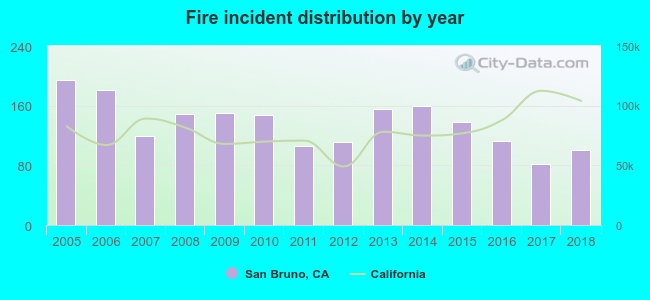 According to the data from the years 2005 - 2018 the average number of fire incidents per year is 136. The highest number of reported fires - 195 took place in 2005, and the least - 82 in 2017. The data has a decreasing trend.
The average number of yearly fire incidents per 10k residents in San Bruno, CA compared to nearest cities:
(Note: Based on data for the last 3 years, including only cities with population 5,000 and above)
| San Bruno: | 22.9 |
| South San Francisco: | 19.8 |
| Millbrae: | 25.4 |
| Pacifica: | 20.9 |
| Burlingame: | 17.3 |
| Daly City: | 14.1 |
| Hillsborough: | 12.6 |
| San Mateo: | 14.1 |
| El Granada: | 4.9 |
 The median response time based on all reported fire incidents is 4 minutes. This is lower compared to the California median value.
The median response time in San Bruno, CA compared to nearest cities:
(Note: Based on data for all years, including only cities with at least 500 fire incidents)
| San Bruno: | 4 minutes |
| South San Francisco: | 4 minutes |
| Millbrae: | 4 minutes |
| Pacifica: | 5 minutes |
| Brisbane: | 5 minutes |
| Burlingame: | 4 minutes |
| Daly City: | 4 minutes |
| San Mateo: | 4 minutes |
| San Francisco: | 4 minutes |
 According to the reports from the years 2005 - 2018 the average number of fire-related casualties per year is 1. The highest number of casualties - 3 took place in 2012, and the lowest - 0 in 2009. The data has a decreasing trend.
The average number of injuries per 1,000 fires is 7. This indicator was the highest - 27 in 2012, and the lowest 0 in 2009. The trend for casualties per 1,000 fires is dropping. Compared to the state value the number of injuries per 1,000 fires is higher.
According to the reports from the years 2005 - 2018 the average number of fire-related casualties per year is 1. The highest number of casualties - 3 took place in 2012, and the lowest - 0 in 2009. The data has a decreasing trend.
The average number of injuries per 1,000 fires is 7. This indicator was the highest - 27 in 2012, and the lowest 0 in 2009. The trend for casualties per 1,000 fires is dropping. Compared to the state value the number of injuries per 1,000 fires is higher.Casualties per 1,000 incidents in San Bruno, CA compared to nearest cities:
(Note: Based on data for all years, including only cities with at least 500 fire incidents)
| San Bruno: | 6.8 |
| South San Francisco: | 7.0 |
| Millbrae: | 2.1 |
| Pacifica: | 5.2 |
| Brisbane: | 2.9 |
| Burlingame: | 4.7 |
| Daly City: | 5.2 |
| San Mateo: | 0.7 |
| San Francisco: | 5.9 |
 31.4% incidents where reported in the morning and 68.6% in the evening. The most fires (14.7%) took place on Saturday, and the least (13.8%) on Monday.
 According to the 1,907 fire incident reports from years 2005 - 2018 most fires (15.2%) took place during July, and the least (5.5%) in November.
 Out of all 16,893 cases reported during the years 2005 - 2018, the most belonged to the categories: Rescue & EMS (51.6%), Hazardous Condition (14.9%), and Fire (11.3%).
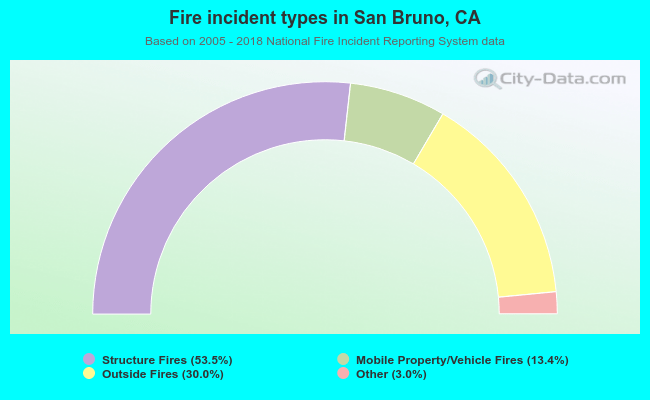 When looking into fire subcategories, the most reports belonged to: Structure Fires (53.5%), and Outside Fires (30.0%).