San Carlos: Fire Incidents, California (CA)
Where are fire incidents reported in San Carlos, CA
Something went wrong! Please refresh the page.
|
| |||||||||||||||||||||||||||||||||||||||||||||||||||||||||||||||||||||||||||||||||||||||||||||||||||||||||||||
2005 - 2018 National Fire Incident Reporting System (NFIRS) incidents
- Incident types reported to NFIRS in San Carlos, CA
- 4,12949.6%Rescue & EMS
- 1,04712.6%Hazardous Condition
- 99712.0%Service Call
- 84210.1%Good Intent Call
- 6698.0%Fire
- 6037.3%False Alarm
- 190.2%Overpressure Rupture
- Fire incident types reported to NFIRS in San Carlos, CA
- 37455.9%Structure Fires
- 13420.0%Outside Fires
- 8612.9%Mobile Property/Vehicle Fires
- 7511.2%Other
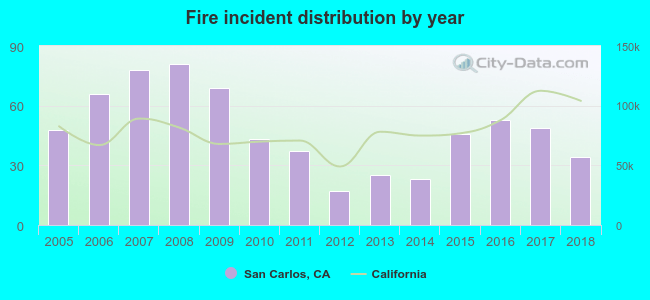 Based on the data from the years 2005 - 2018 the average number of fire incidents per year is 48. The highest number of fires - 81 took place in 2008, and the least - 17 in 2012. The data has a decreasing trend.
The average number of yearly fire incidents per 10k residents in San Carlos, CA compared to nearest cities:
(Note: Based on data for the last 3 years, including only cities with population 5,000 and above)
| San Carlos: | 15.2 |
| Redwood City: | 23.3 |
| Belmont: | 17.4 |
| Foster City: | 10.7 |
| Atherton: | 10.3 |
| San Mateo: | 14.1 |
| Woodside: | 83.2 |
| Menlo Park: | 21.6 |
| Hillsborough: | 12.6 |
 The median response time based on all reported fire incidents is 5 minutes. This is lower than the California median value.
The median response time in San Carlos, CA compared to nearest cities:
(Note: Based on data for all years, including only cities with at least 500 fire incidents)
| San Carlos: | 5 minutes |
| Redwood City: | 5 minutes |
| Belmont: | 5 minutes |
| Foster City: | 4 minutes |
| San Mateo: | 4 minutes |
| Menlo Park: | 4 minutes |
| East Palo Alto: | 4 minutes |
| Burlingame: | 4 minutes |
| Palo Alto: | 6 minutes |
 32.6% incidents where reported in the morning and 67.4% in the evening. The most fires (17.3%) took place on Saturday, and the least (11.2%) on Wednesday.
 According to the 669 fires from years 2005 - 2018 most fires (10.2%) took place during May, and the least (7.0%) in January.
 Out of all 8,317 cases reported during the years 2005 - 2018, the most belonged to the categories: Rescue & EMS (49.6%), Hazardous Condition (12.6%), and Service Call (12.0%).
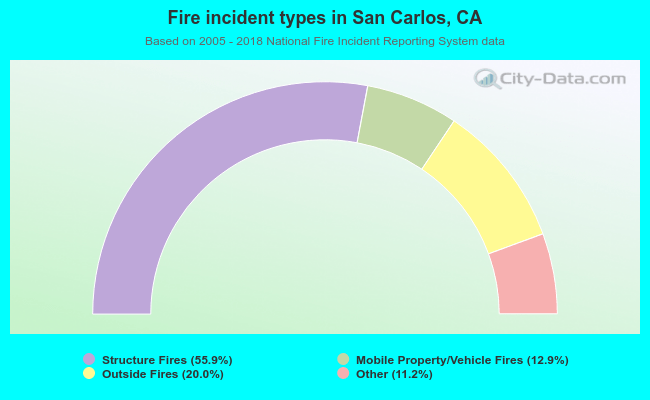 When looking into fire subcategories, the most incidents belonged to: Structure Fires (55.9%), and Outside Fires (20.0%).