San Clemente: Fire Incidents, California (CA)
Where are fire incidents reported in San Clemente, CA
Something went wrong! Please refresh the page.
| Fire incidents reported | |
|---|---|
| Sreet name | Count |
| EL CAMINO REAL | 108 |
| AV VICTORIA | 46 |
| AVENIDA PICO | 46 |
| CALLE AMISTAD | 42 |
| CALLE DEL CERRO | 34 |
| CAMINO DE LOS MARES | 30 |
| AV PICO | 28 |
| PASEO DE CRISTOBAL | 26 |
| AV DEL MAR | 18 |
| AV GRANADA | 18 |
| AVENIDA VICTORIA | 18 |
| BUENA VISTA | 18 |
| CAMINO DE ESTRELLA | 18 |
| AV CALAFIA | 16 |
| AV LA PATA | 16 |
| CALLE AMANECER | 14 |
| EL PORTAL | 14 |
| MARIPOSA | 14 |
| AV SALVADOR | 12 |
| CALLE DEL COMERCIO | 12 |
| CANADA | 12 |
| LOMA | 12 |
| MARQUITA | 12 |
| PACIFIC COAST HIGHWAY | 12 |
| SB 5AVENIDA VISTA HERMOSA | 12 |
| AV PALIZADA | 10 |
| AV PRESIDIO | 10 |
| AV VISTA MONTANA | 10 |
| AVENIDA NAVARRO | 10 |
| AVENIDA VISTA HERMOSA | 10 |
| Other | 343 |
2005 - 2018 National Fire Incident Reporting System (NFIRS) incidents
- Incident types reported to NFIRS in San Clemente, CA
- 14,28068.1%Rescue & EMS
- 2,30611.0%Good Intent Call
- 1,5577.4%Service Call
- 1,0274.9%False Alarm
- 1,0014.8%Fire
- 7793.7%Hazardous Condition
- Fire incident types reported to NFIRS in San Clemente, CA
- 42342.3%Outside Fires
- 27827.8%Structure Fires
- 23823.8%Mobile Property/Vehicle Fires
- 626.2%Other
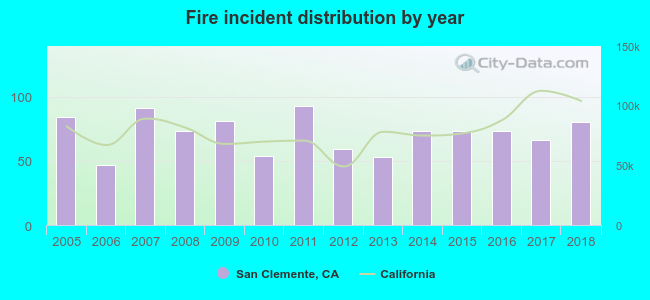 Based on the data from the years 2005 - 2018 the average number of fire incidents per year is 71. The highest number of fires - 93 took place in 2011, and the least - 47 in 2006. The data has a decreasing trend.
The average number of yearly fire incidents per 10k residents in San Clemente, CA compared to nearest cities:
(Note: Based on data for the last 3 years, including only cities with population 5,000 and above)
| San Clemente: | 11.2 |
| Dana Point: | 10.7 |
| San Juan Capistrano: | 12.5 |
| South Coast: | 0.4 |
| Laguna Niguel: | 7.1 |
| Ladera Ranch: | 1.1 |
| Las Flores: | 1.7 |
| Laguna Beach: | 4.1 |
| Coto de Caza: | 4.5 |
 The median response time based on all reported fire incidents is 6 minutes. This is close to the California median value.
The median response time in San Clemente, CA compared to nearest cities:
(Note: Based on data for all years, including only cities with at least 500 fire incidents)
| San Clemente: | 6 minutes |
| Dana Point: | 6 minutes |
| San Juan Capistrano: | 6 minutes |
| Laguna Niguel: | 6 minutes |
| Laguna Hills: | 6 minutes |
| Mission Viejo: | 6 minutes |
| Irvine: | 6 minutes |
| Newport Beach: | 6 minutes |
| Fallbrook: | 10 minutes |
 According to the data from the years 2005 - 2018 the average number of fire-related casualties per year is 2. The highest number of injuries - 6 took place in 2008, and the lowest - 0 in 2005. The data has a constant trend.
The average number of casualties per 1,000 fires is 22. This indicator was the highest - 82 in 2008, and the lowest 0 in 2005. The trend for injuries per 1,000 incidents is constant. Compared to the state value the number of casualties per 1,000 fires is much higher.
According to the data from the years 2005 - 2018 the average number of fire-related casualties per year is 2. The highest number of injuries - 6 took place in 2008, and the lowest - 0 in 2005. The data has a constant trend.
The average number of casualties per 1,000 fires is 22. This indicator was the highest - 82 in 2008, and the lowest 0 in 2005. The trend for injuries per 1,000 incidents is constant. Compared to the state value the number of casualties per 1,000 fires is much higher.Casualties per 1,000 incidents in San Clemente, CA compared to nearest cities:
(Note: Based on data for all years, including only cities with at least 500 fire incidents)
| San Clemente: | 22.0 |
| Dana Point: | 25.3 |
| San Juan Capistrano: | 12.7 |
| Laguna Niguel: | 13.5 |
| Laguna Hills: | 8.0 |
| Mission Viejo: | 16.8 |
| Irvine: | 15.1 |
| Newport Beach: | 3.6 |
| Fallbrook: | 7.3 |
 36.3% incidents where reported in the morning and 63.7% in the evening. The most fires (16.0%) took place on Monday, and the least (12.6%) on Wednesday.
 Based on the 1,001 fire incidents from years 2005 - 2018 most fires (10.3%) took place during July, and the least (6.6%) in June.
 Out of all 20,982 cases reported during the years 2005 - 2018, the most belonged to the categories: Rescue & EMS (68.1%), Good Intent Call (11.0%), and Service Call (7.4%).
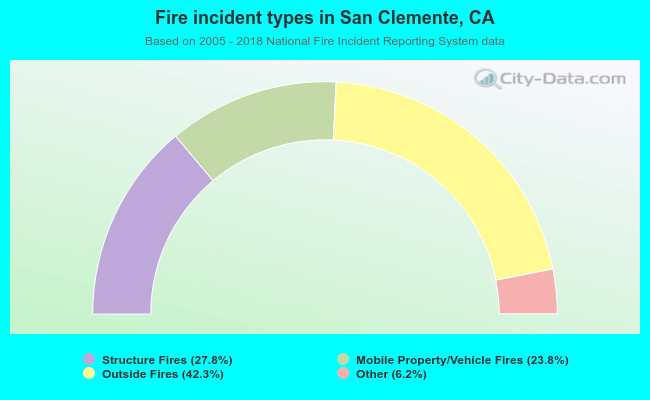 When looking into fire subcategories, the most reports belonged to: Outside Fires (42.3%), and Structure Fires (27.8%).