Santa Barbara: Fire Incidents, California (CA)
Where are fire incidents reported in Santa Barbara, CA
Something went wrong! Please refresh the page.
| Fire incidents reported | |
|---|---|
| Sreet name | Count |
| STATE ST | 242 |
| HWY 101 | 144 |
| HWY 154 | 142 |
| SR 154 | 108 |
| CALLE REAL | 104 |
| CATHEDRAL OAKS RD | 74 |
| CLIFF DR | 72 |
| MILPAS ST | 70 |
| STEARNS WHARF | 62 |
| DE LA VINA ST | 60 |
| CHAPALA ST | 56 |
| ANAPAMU ST | 54 |
| CASTILLO ST | 54 |
| ANACAPA ST | 52 |
| CARRILLO ST | 52 |
| HWY 101 SB | 52 |
| GARDEN ST | 46 |
| HALEY ST | 46 |
| CABRILLO BLVD | 44 |
| HOLLISTER AVE | 44 |
| CANON PERDIDO ST | 42 |
| BATH ST | 40 |
| HWY 101 NB | 38 |
| FOOTHILL RD | 36 |
| STATE | 34 |
| GUTIERREZ ST | 32 |
| SAN MARCOS RD | 30 |
| COTA ST | 28 |
| EAST CAMINO CIELO | 28 |
| MONTECITO ST | 28 |
| Other | 596 |
2005 - 2018 National Fire Incident Reporting System (NFIRS) incidents
- Incident types reported to NFIRS in Santa Barbara, CA
- 23,69055.5%Rescue & EMS
- 8,41819.7%Good Intent Call
- 3,5748.4%Hazardous Condition
- 2,5105.9%Fire
- 2,4535.7%Service Call
- 1,8434.3%False Alarm
- 700.2%Special Incident
- 660.2%Severe Weather
- 490.1%Overpressure Rupture
- Fire incident types reported to NFIRS in Santa Barbara, CA
- 1,17046.6%Outside Fires
- 65726.2%Structure Fires
- 48419.3%Mobile Property/Vehicle Fires
- 1997.9%Other
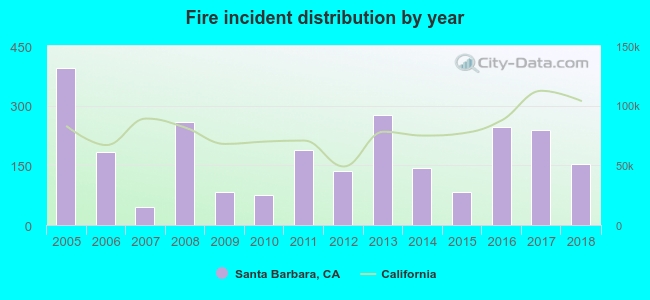 According to the data from the years 2005 - 2018 the average number of fire incidents per year is 179. The highest number of reported fires - 395 took place in 2005, and the least - 46 in 2007. The data has a dropping trend.
The average number of yearly fire incidents per 10k residents in Santa Barbara, CA compared to nearest cities:
(Note: Based on data for the last 3 years, including only cities with population 5,000 and above)
| Santa Barbara: | 23.4 |
| Montecito: | 4.1 |
| Goleta: | 26.2 |
| Isla Vista: | 7.5 |
| Carpinteria: | 21.2 |
| Mira Monte: | 4.4 |
| Ojai: | 47.6 |
| Solvang: | 27.8 |
| Ventura: | 37.4 |
 The median response time based on all reported fire incidents is 5 minutes. This is lower than the California median value.
The median response time in Santa Barbara, CA compared to nearest cities:
(Note: Based on data for all years, including only cities with at least 500 fire incidents)
| Santa Barbara: | 5 minutes |
| Goleta: | 7 minutes |
| Isla Vista: | 6 minutes |
| Ventura: | 7 minutes |
| Oxnard: | 5 minutes |
| Port Hueneme: | 6 minutes |
| Santa Paula: | 6 minutes |
| Camarillo: | 6 minutes |
| Mission Hills: | 5 minutes |
 According to the reports from the years 2005 - 2018 the average number of fire-related yearly deaths is 0. The highest number of reported deaths - 1 took place in 2010, and the lowest - 0 in 2005. The data has a constant trend.
The average number of fatalities per 1,000 fire incidents is 2. This indicator was the highest - 13 in 2010, and the lowest 0 in 2005. The trend for deaths per 1,000 fire incidents is rising. Compared to the California value the number of deaths per 1,000 fire incidents is about the same.
According to the reports from the years 2005 - 2018 the average number of fire-related yearly deaths is 0. The highest number of reported deaths - 1 took place in 2010, and the lowest - 0 in 2005. The data has a constant trend.
The average number of fatalities per 1,000 fire incidents is 2. This indicator was the highest - 13 in 2010, and the lowest 0 in 2005. The trend for deaths per 1,000 fire incidents is rising. Compared to the California value the number of deaths per 1,000 fire incidents is about the same.Deaths per 1,000 incidents in Santa Barbara, CA compared to nearest cities:
(Note: Based on data for all years, including only cities with at least 2,500 fire incidents)
| Santa Barbara: | 1.2 |
| Oxnard: | 1.0 |
| Santa Maria: | 0.5 |
 Based on the data from the years 2005 - 2018 the average number of fire-related yearly casualties is 1. The highest number of injuries - 3 took place in 2016, and the lowest - 0 in 2006. The data has a dropping trend.
The average number of injuries per 1,000 fires is 3. This indicator was the highest - 12 in 2016, and the lowest 0 in 2006. The trend for casualties per 1,000 incidents is declining. Compared to the state value the number of casualties per 1,000 incidents is similar.
Based on the data from the years 2005 - 2018 the average number of fire-related yearly casualties is 1. The highest number of injuries - 3 took place in 2016, and the lowest - 0 in 2006. The data has a dropping trend.
The average number of injuries per 1,000 fires is 3. This indicator was the highest - 12 in 2016, and the lowest 0 in 2006. The trend for casualties per 1,000 incidents is declining. Compared to the state value the number of casualties per 1,000 incidents is similar.Casualties per 1,000 incidents in Santa Barbara, CA compared to nearest cities:
(Note: Based on data for all years, including only cities with at least 500 fire incidents)
| Santa Barbara: | 4.8 |
| Goleta: | 5.2 |
| Isla Vista: | 1.8 |
| Ventura: | 6.0 |
| Oxnard: | 5.6 |
| Port Hueneme: | 6.6 |
| Santa Paula: | 6.3 |
| Camarillo: | 4.1 |
| Mission Hills: | 10.3 |
 34.3% incidents where reported in the morning and 65.7% in the evening. The most fires (16.2%) took place on Friday, and the least (12.7%) on Wednesday.
 According to the 2,510 fire incident reports from years 2005 - 2018 most fires (12.2%) took place during July, and the least (5.9%) in December.
 Out of all 42,673 cases reported during the years 2005 - 2018, the most belonged to the categories: Rescue & EMS (55.5%), Good Intent Call (19.7%), and Hazardous Condition (8.4%).
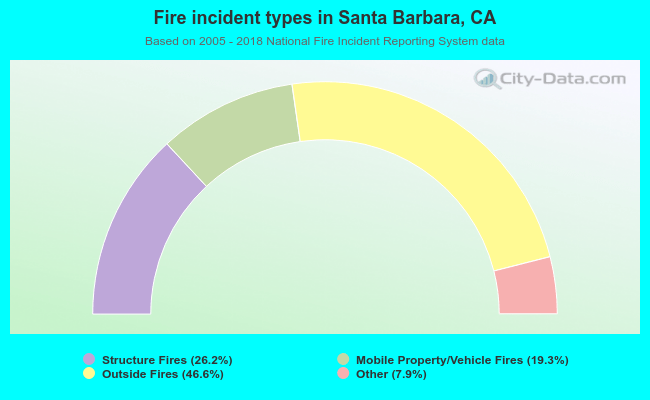 When looking into fire subcategories, the most reports belonged to: Outside Fires (46.6%), and Structure Fires (26.2%).