South San Gabriel: Fire Incidents, California (CA)
Where are fire incidents reported in South San Gabriel, CA
Something went wrong! Please refresh the page.
|
| |||||||||||||||||||||||||||||||||||||||||||||||||||||||||||||||||||||||||||||||||||||||||||||||||||||||||
2005 - 2018 National Fire Incident Reporting System (NFIRS) incidents
- Incident types reported to NFIRS in South San Gabriel, CA
- 1,23265.4%Rescue & EMS
- 30416.1%Good Intent Call
- 1196.3%False Alarm
- 1005.3%Fire
- 814.3%Hazardous Condition
- 432.3%Service Call
- 30.2%Special Incident
- Fire incident types reported to NFIRS in South San Gabriel, CA
- 4949.0%Outside Fires
- 2828.0%Structure Fires
- 1515.0%Mobile Property/Vehicle Fires
- 88.0%Other
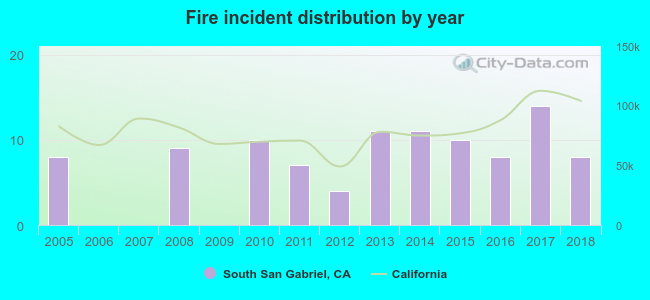 Based on the data from the years 2005 - 2018 the average number of fire incidents per year is 7. The highest number of fire incidents - 14 took place in 2017, and the least - 0 in 2006. The data has a constant trend.
The average number of yearly fire incidents per 10k residents in South San Gabriel, CA compared to nearest cities:
(Note: Based on data for the last 3 years, including only cities with population 5,000 and above)
| South San Gabriel: | 12.4 |
| Rosemead: | 13.7 |
| Monterey Park: | 3.6 |
| Montebello: | 3.6 |
| South El Monte: | 26.1 |
| San Gabriel: | 15.8 |
| Alhambra: | 13.2 |
| Pico Rivera: | 15.8 |
| El Monte: | 14.1 |

 28.0% incidents where reported in the morning and 72.0% in the evening. The most fires (17.0%) took place on Saturday, and the least (12.0%) on Monday.
 Based on the 100 reports from years 2005 - 2018 most fires (13.0%) took place during June, and the least (2.0%) in December.
 Out of all 1,883 cases reported during the years 2005 - 2018, the most belonged to the categories: Overpressure Rupture (65.4%), Service Call (16.1%), and Good Intent Call (6.3%).
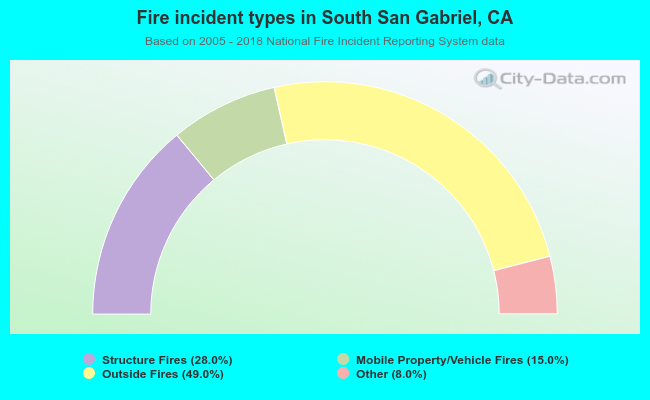 When looking into fire subcategories, the most incidents belonged to: Outside Fires (49.0%), and Structure Fires (28.0%).