Tehachapi: Fire Incidents, California (CA)
Where are fire incidents reported in Tehachapi, CA
Something went wrong! Please refresh the page.
|
| |||||||||||||||||||||||||||||||||||||||||||||||||||||||||||||||||||||||||||||||||||||||||||||||||||||||||||||
| Other | 145 | |||||||||||||||||||||||||||||||||||||||||||||||||||||||||||||||||||||||||||||||||||||||||||||||||||||||||||||
2005 - 2018 National Fire Incident Reporting System (NFIRS) incidents
- Incident types reported to NFIRS in Tehachapi, CA
- 2,80644.4%Rescue & EMS
- 98915.7%Hazardous Condition
- 97215.4%Good Intent Call
- 81913.0%Fire
- 4487.1%Service Call
- 2594.1%False Alarm
- 190.3%Special Incident
- Fire incident types reported to NFIRS in Tehachapi, CA
- 39948.7%Outside Fires
- 29536.0%Structure Fires
- 10312.6%Mobile Property/Vehicle Fires
- 222.7%Other
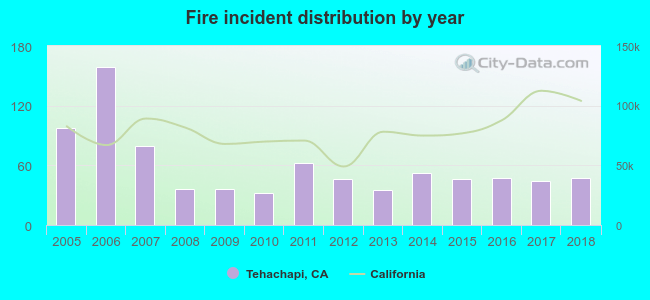 Based on the data from the years 2005 - 2018 the average number of fires per year is 59. The highest number of fire incidents - 159 took place in 2006, and the least - 32 in 2010. The data has a dropping trend.
The average number of yearly fire incidents per 10k residents in Tehachapi, CA compared to nearest cities:
(Note: Based on data for the last 3 years, including only cities with population 5,000 and above)
| Tehachapi: | 34.8 |
| Golden Hills: | 27.1 |
| Bear Valley Springs: | 1.9 |
| Arvin: | 37.7 |
| Rosamond: | 40.2 |
| Lamont: | 28.2 |
| California City: | 5.8 |
| Lancaster: | 21.1 |
| Quartz Hill: | 14.4 |
 The median response time based on all reported fire incidents is 7 minutes. This is about the same as the state median value.
The median response time in Tehachapi, CA compared to nearest cities:
(Note: Based on data for all years, including only cities with at least 500 fire incidents)
| Tehachapi: | 7 minutes |
| Arvin: | 7 minutes |
| Rosamond: | 10 minutes |
| Lamont: | 7 minutes |
| Lebec: | 10 minutes |
| Lancaster: | 5 minutes |
| Bakersfield: | 7 minutes |
| Oildale: | 6 minutes |
| Palmdale: | 5 minutes |
 32.4% incidents where reported in the morning and 67.6% in the evening. The most fires (16.4%) took place on Saturday, and the least (11.4%) on Tuesday.
 According to the 819 fire incident reports from years 2005 - 2018 most fires (15.0%) took place during July, and the least (4.6%) in April.
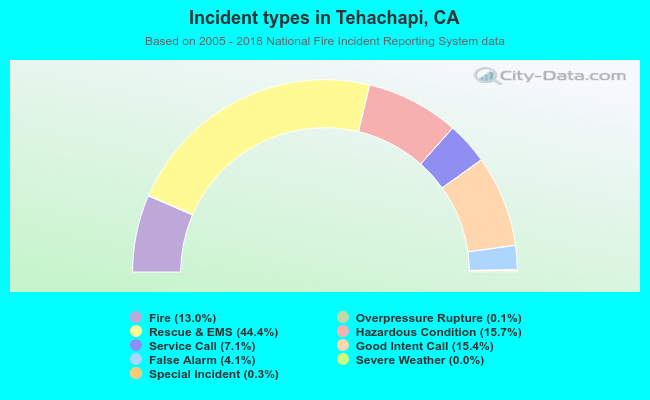 Out of all 6,319 cases reported during the years 2005 - 2018, the most belonged to the categories: Rescue & EMS (44.4%), Hazardous Condition (15.7%), and Good Intent Call (15.4%).
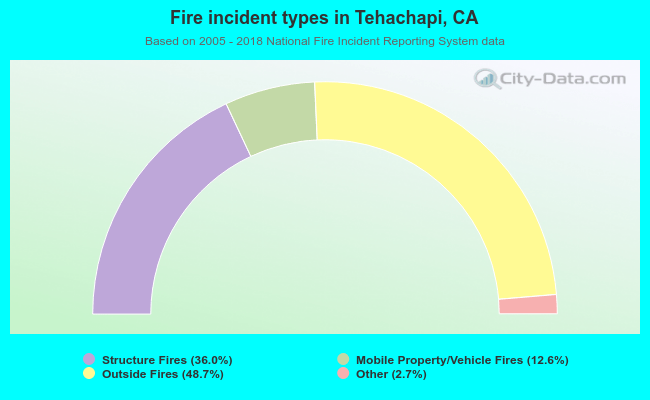 When looking into fire subcategories, the most reports belonged to: Outside Fires (48.7%), and Structure Fires (36.0%).