West Chester: Fire Incidents, Pennsylvania (PA)
Where are fire incidents reported in West Chester, PA
Something went wrong! Please refresh the page.
| Fire incidents reported | |
|---|---|
| Sreet name | Count |
| GAY ST | 198 |
| WEST CHESTER PK | 162 |
| HIGH ST | 134 |
| CHURCH ST | 120 |
| MARSHALL ST | 102 |
| BOOT RD | 94 |
| MARKET ST | 94 |
| MATLACK ST | 86 |
| WALNUT ST | 80 |
| FRANKLIN ST | 76 |
| WESTTOWN RD | 70 |
| PAOLI PK | 64 |
| DOWNINGTOWN PK | 58 |
| STRASBURG RD | 58 |
| CHESTNUT ST | 56 |
| ROSEDALE AV | 56 |
| STREET RD | 52 |
| UNION ST | 52 |
| MINER ST | 46 |
| BARNARD ST | 44 |
| WILMINGTON PIKE | 44 |
| NEW ST | 40 |
| POTTSTOWN PK | 40 |
| CHESTER RD | 38 |
| LENAPE RD | 38 |
| SKILES BL | 38 |
| PHOENIXVILLE PK | 36 |
| CREEK RD | 34 |
| CONCORD RD | 32 |
| EVERHART ST | 32 |
| Other | 958 |
2003 - 2018 National Fire Incident Reporting System (NFIRS) incidents
- Incident types reported to NFIRS in West Chester, PA
- 3,03227.5%Fire
- 3,00827.3%Hazardous Condition
- 2,56123.3%False Alarm
- 9528.6%Good Intent Call
- 8157.4%Rescue & EMS
- 5765.2%Service Call
- 340.3%Severe Weather
- 300.3%Overpressure Rupture
- Fire incident types reported to NFIRS in West Chester, PA
- 1,77058.4%Structure Fires
- 90629.9%Outside Fires
- 2779.1%Mobile Property/Vehicle Fires
- 792.6%Other
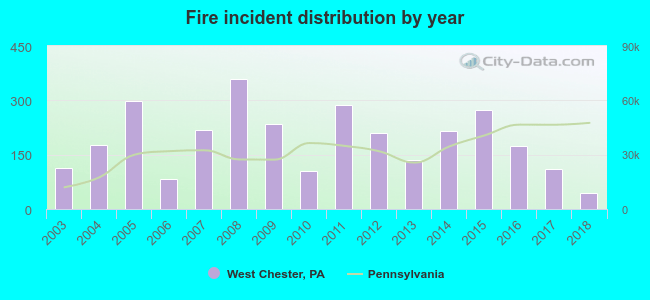 According to the data from the years 2003 - 2018 the average number of fires per year is 190. The highest number of fire incidents - 359 took place in 2008, and the least - 43 in 2018. The data has a declining trend.
The average number of yearly fire incidents per 10k residents in West Chester, PA compared to nearest cities:
(Note: Based on data for the last 3 years, including only cities with population 5,000 and above)
| West Chester: | 56.6 |
| Downingtown: | 110.0 |
| Paoli: | 18.5 |
| Kennett Square: | 71.0 |
| Coatesville: | 118.0 |
| Media: | 151.6 |
| Phoenixville: | 65.7 |
| Brookhaven: | 79.3 |
| Broomall: | 53.4 |
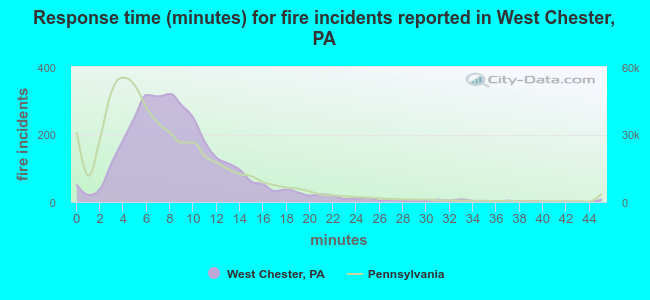 The median response time based on all reported fire incidents is 8 minutes. This is higher compared to the state median value.
The median response time in West Chester, PA compared to nearest cities:
(Note: Based on data for all years, including only cities with at least 500 fire incidents)
| West Chester: | 8 minutes |
| Exton: | 6 minutes |
| Downingtown: | 8 minutes |
| Malvern: | 9 minutes |
| Kennett Square: | 8 minutes |
| Berwyn: | 8 minutes |
| Coatesville: | 5 minutes |
| Media: | 6 minutes |
| Phoenixville: | 6 minutes |
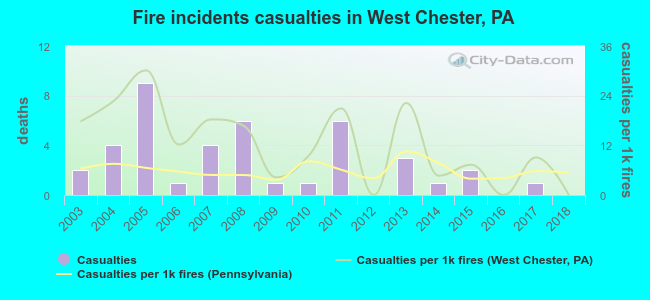 Based on the data from the years 2003 - 2018 the average number of fire-related yearly casualties is 3. The highest number of casualties - 9 took place in 2005, and the lowest - 0 in 2012. The data has a declining trend.
The average number of injuries per 1,000 fires is 12. This indicator was the highest - 30 in 2005, and the lowest 0 in 2012. The trend for casualties per 1,000 incidents is decreasing. Compared to the Pennsylvania value the number of casualties per 1,000 fires is much higher.
Based on the data from the years 2003 - 2018 the average number of fire-related yearly casualties is 3. The highest number of casualties - 9 took place in 2005, and the lowest - 0 in 2012. The data has a declining trend.
The average number of injuries per 1,000 fires is 12. This indicator was the highest - 30 in 2005, and the lowest 0 in 2012. The trend for casualties per 1,000 incidents is decreasing. Compared to the Pennsylvania value the number of casualties per 1,000 fires is much higher.Casualties per 1,000 incidents in West Chester, PA compared to nearest cities:
(Note: Based on data for all years, including only cities with at least 500 fire incidents)
| West Chester: | 13.5 |
| Exton: | 7.9 |
| Downingtown: | 3.5 |
| Malvern: | 7.7 |
| Kennett Square: | 3.4 |
| Berwyn: | 1.7 |
| Coatesville: | 7.0 |
| Media: | 0.0 |
| Phoenixville: | 14.0 |
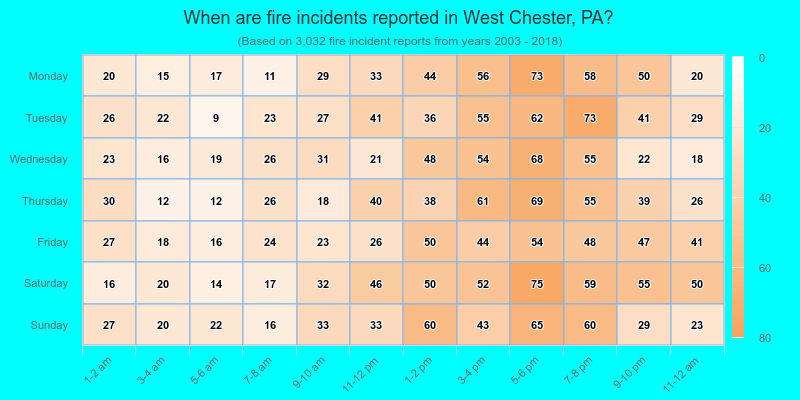
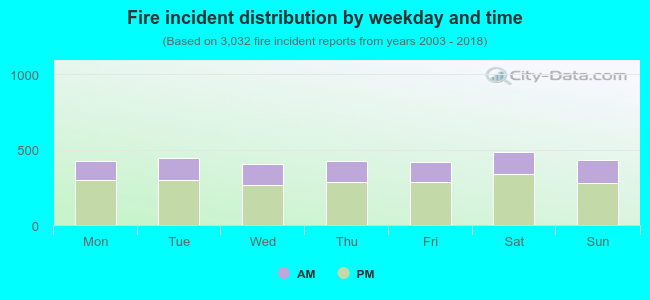 32.2% incidents where reported in the morning and 67.8% in the evening. The most fires (16.0%) took place on Saturday, and the least (13.2%) on Wednesday.
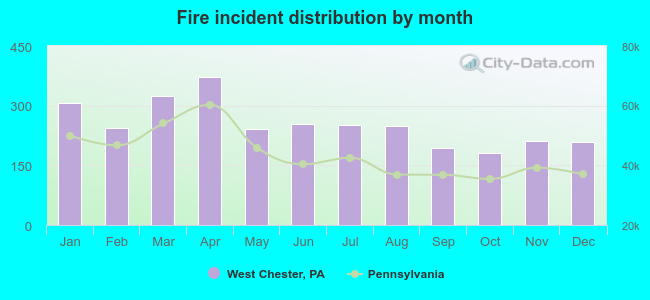 Based on the 3,032 fires from years 2003 - 2018 most fires (12.2%) took place during April, and the least (6.0%) in October.
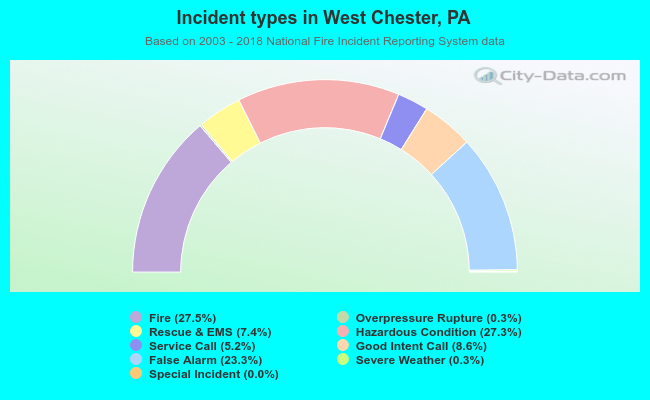 Out of all 11,011 cases reported during the years 2003 - 2018, the most belonged to the categories: Fire (27.5%), Hazardous Condition (27.3%), and False Alarm (23.3%).
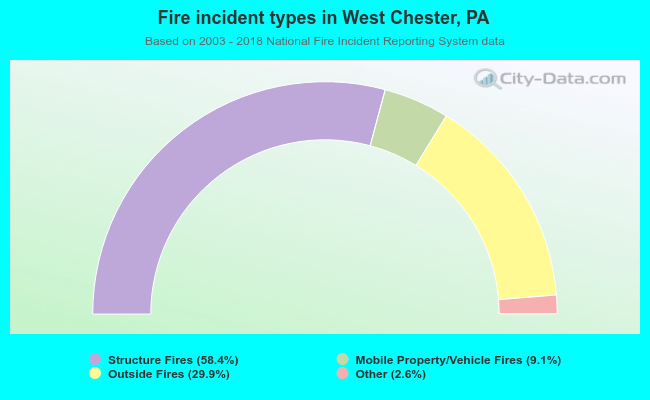 When looking into fire subcategories, the most reports belonged to: Structure Fires (58.4%), and Outside Fires (29.9%).