Williston Park: Fire Incidents, New York (NY)
Where are fire incidents reported in Williston Park, NY
Something went wrong! Please refresh the page.
|
| |||||||||||||||||||||||||||||||||||||||||||||||||||||||||||||||||||||||||||||||||||||||||||||||||||||||||||||
2003 - 2018 National Fire Incident Reporting System (NFIRS) incidents
- Incident types reported to NFIRS in Williston Park, NY
- 92953.5%Rescue & EMS
- 19711.4%Good Intent Call
- 18410.6%Fire
- 18110.4%False Alarm
- 1719.9%Hazardous Condition
- 533.1%Service Call
- 181.0%Special Incident
- Fire incident types reported to NFIRS in Williston Park, NY
- 9652.2%Other
- 4021.7%Structure Fires
- 3519.0%Outside Fires
- 137.1%Mobile Property/Vehicle Fires
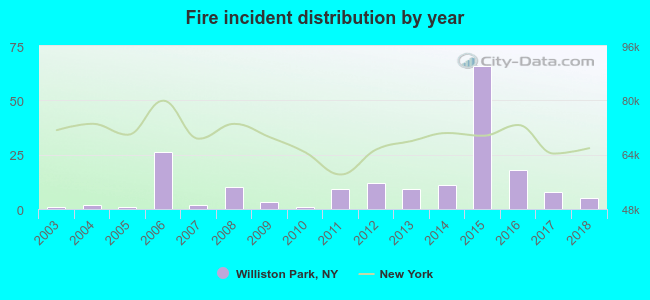 Based on the data from the years 2003 - 2018 the average number of fires per year is 12. The highest number of fire incidents - 66 took place in 2015, and the least - 1 in 2003. The data has a rising trend.
The average number of yearly fire incidents per 10k residents in Williston Park, NY compared to nearest cities:
(Note: Based on data for the last 3 years, including only cities with population 5,000 and above)
| Williston Park: | 14.1 |
| Mineola: | 15.4 |
| Albertson: | 3.9 |
| Garden City Park: | 7.3 |
| Roslyn Heights: | 6.6 |
| North Hills: | 1.9 |
| Garden City: | 21.7 |
| North New Hyde Park: | 6.4 |
| East Hills: | 9.9 |

 27.2% incidents where reported in the morning and 72.8% in the evening. The most fires (19.6%) took place on Thursday, and the least (10.9%) on Saturday.
 According to the 184 incident reports from years 2003 - 2018 most fires (13.6%) took place during January, and the least (3.3%) in July.
 Out of all 1,735 cases reported during the years 2003 - 2018, the most belonged to the categories: Rescue & EMS (53.5%), Good Intent Call (11.4%), and Fire (10.6%).
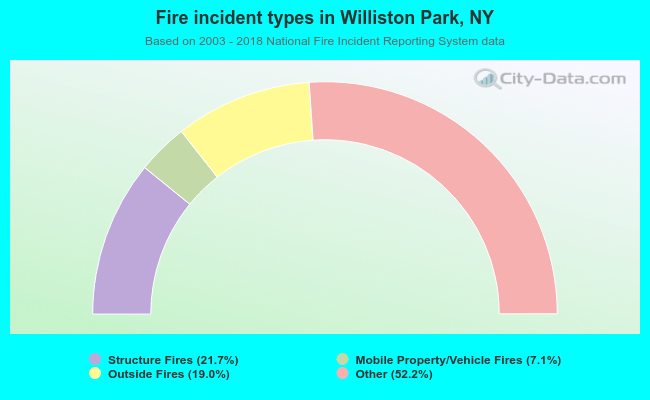 When looking into fire subcategories, the most reports belonged to: Other (52.2%), and Structure Fires (21.7%).