Yorktown: Fire Incidents, New York (NY)
Where are fire incidents reported in Yorktown, NY
Something went wrong! Please refresh the page.
| Fire incidents reported | |
|---|---|
| Sreet name | Count |
| TACONIC STATE PKY | 80 |
| CROMPOND RD | 52 |
| CROMPOND RD | 52 |
| GOMER ST | 24 |
| ILLINGTON RD | 22 |
| LEE BLVD | 22 |
| TSP | 22 |
| CATHERINE ST | 18 |
| HUNTERBROOK RD | 18 |
| SAW MILL RIVER RD | 18 |
| UNDERHILL AVE | 18 |
| BAPTIST CHURCH RD | 16 |
| COMMERCE ST | 16 |
| CURRY ST | 16 |
| BALDWIN RD | 14 |
| COMMERCE ST | 14 |
| QUINLAN ST | 14 |
| STRANG BLVD | 14 |
| UNDERHILL AVE | 14 |
| WILDWOOD ST | 14 |
| BRENDER LN | 12 |
| DOWNING DR | 12 |
| GREENWOOD ST | 12 |
| KITCHAWAN RD | 12 |
| LELAND DR | 12 |
| OLD YORKTOWN RD | 12 |
| OLD YORKTOWN RD | 12 |
| SAW MILL RIVER RD | 12 |
| STRANG BLVD | 12 |
| ALLAN AVE | 10 |
| Other | 253 |
2003 - 2018 National Fire Incident Reporting System (NFIRS) incidents
- Incident types reported to NFIRS in Yorktown, NY
- 3,69043.8%Rescue & EMS
- 1,83421.8%Hazardous Condition
- 1,32915.8%False Alarm
- 84910.1%Fire
- 3944.7%Good Intent Call
- 3133.7%Service Call
- Fire incident types reported to NFIRS in Yorktown, NY
- 43951.7%Structure Fires
- 21525.3%Outside Fires
- 17420.5%Mobile Property/Vehicle Fires
- 212.5%Other
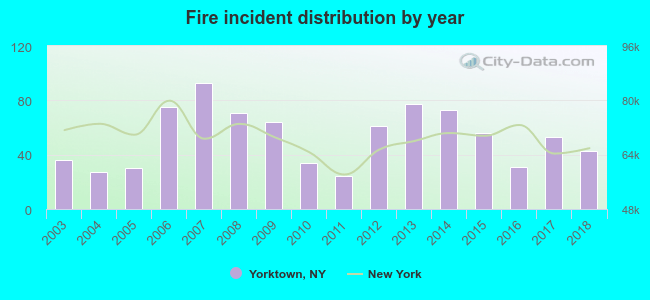 According to the data from the years 2003 - 2018 the average number of fire incidents per year is 53. The highest number of reported fires - 93 took place in 2007, and the least - 24 in 2011. The data has a growing trend.
The average number of yearly fire incidents per 10k residents in Yorktown, NY compared to nearest cities:
(Note: Based on data for the last 3 years, including only cities with population 5,000 and above)
| Yorktown: | 11.7 |
| Cortlandt: | 11.1 |
| Somers: | 9.8 |
| Peekskill: | 33.7 |
| Mount Kisco: | 40.5 |
| New Castle: | 1.1 |
| Mahopac: | 131.4 |
| Putnam Valley: | 23.4 |
| Carmel: | 19.4 |
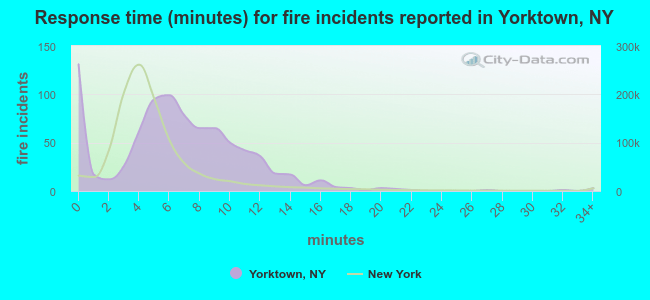 The median response time based on all reported fire incidents is 6 minutes. This is higher compared to the state median value.
The median response time in Yorktown, NY compared to nearest cities:
(Note: Based on data for all years, including only cities with at least 500 fire incidents)
| Yorktown: | 6 minutes |
| Cortlandt: | 7 minutes |
| Peekskill: | 3 minutes |
| Bedford Hills: | 4 minutes |
| Mahopac: | 7 minutes |
| Putnam Valley: | 8 minutes |
| Carmel: | 8 minutes |
| Chappaqua: | 5 minutes |
| Stony Point: | 4 minutes |
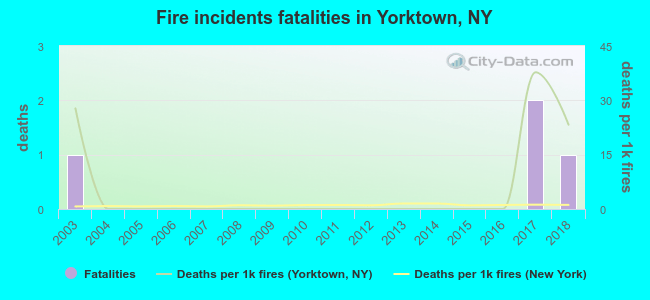 According to the reports from the years 2003 - 2018 the average number of fire-related fatalities per year is 0. The highest number of reported deaths - 2 took place in 2017, and the lowest - 0 in 2004. The data has a constant trend.
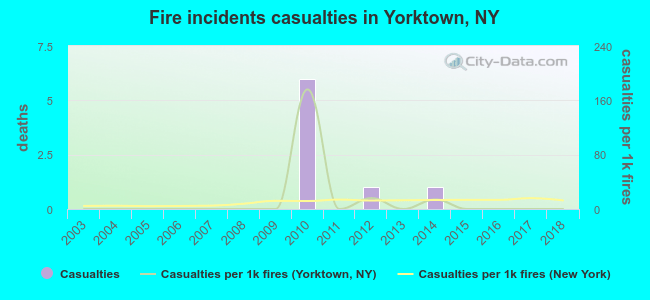 Based on the reports from the years 2003 - 2018 the average number of fire-related yearly casualties is 1. The highest number of reported injuries - 6 took place in 2010, and the lowest - 0 in 2003. The data has a constant trend.
The average number of casualties per 1,000 fire incidents is 13. This indicator was the highest - 176 in 2010, and the lowest 0 in 2003. The trend for injuries per 1,000 fire incidents is constant. Compared to the state value the number of casualties per 1,000 fire incidents is similar.
Based on the reports from the years 2003 - 2018 the average number of fire-related yearly casualties is 1. The highest number of reported injuries - 6 took place in 2010, and the lowest - 0 in 2003. The data has a constant trend.
The average number of casualties per 1,000 fire incidents is 13. This indicator was the highest - 176 in 2010, and the lowest 0 in 2003. The trend for injuries per 1,000 fire incidents is constant. Compared to the state value the number of casualties per 1,000 fire incidents is similar.Casualties per 1,000 incidents in Yorktown, NY compared to nearest cities:
(Note: Based on data for all years, including only cities with at least 500 fire incidents)
| Yorktown: | 9.4 |
| Cortlandt: | 19.2 |
| Peekskill: | 0.7 |
| Bedford Hills: | 4.0 |
| Mahopac: | 11.5 |
| Putnam Valley: | 1.6 |
| Carmel: | 7.8 |
| Chappaqua: | 0.0 |
| Stony Point: | 3.1 |
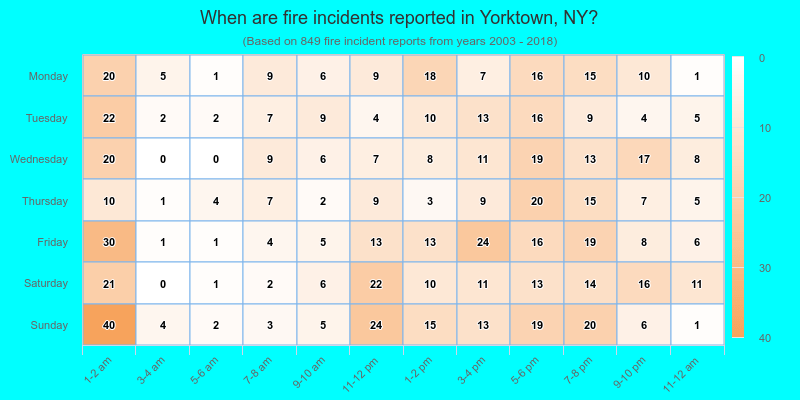
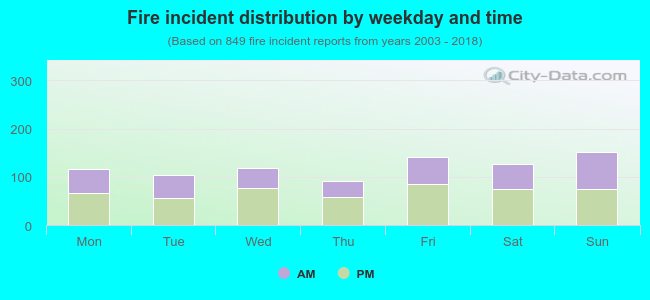 41.8% incidents where reported in the morning and 58.2% in the evening. The most fires (17.9%) took place on Sunday, and the least (10.8%) on Thursday.
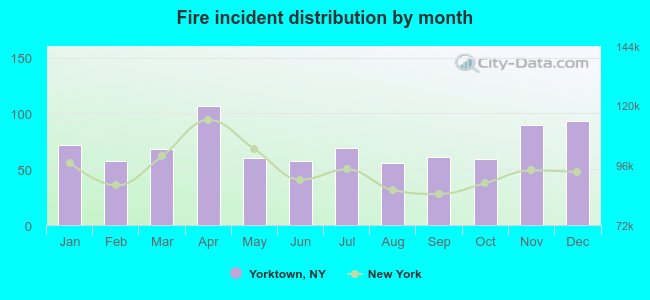 According to the 849 reports from years 2003 - 2018 most fires (12.6%) took place during April, and the least (6.6%) in August.
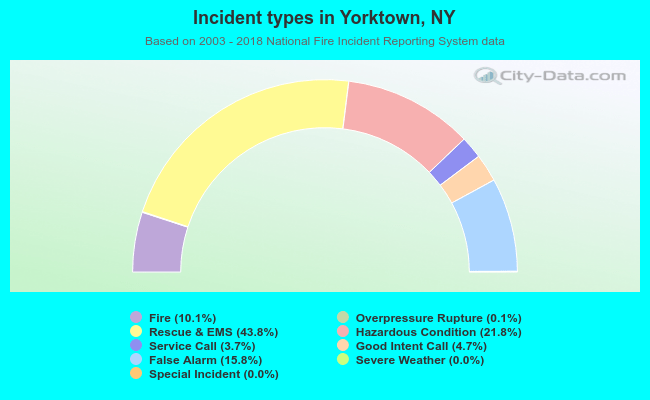 Out of all 8,423 cases reported during the years 2003 - 2018, the most belonged to the categories: Rescue & EMS (43.8%), Hazardous Condition (21.8%), and False Alarm (15.8%).
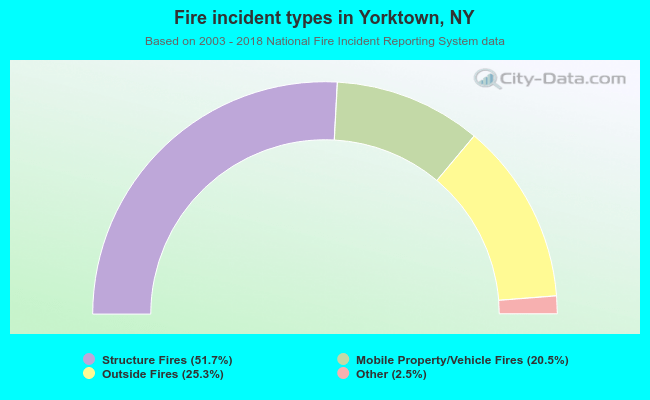 When looking into fire subcategories, the most incidents belonged to: Structure Fires (51.7%), and Outside Fires (25.3%).