Barrington, NJ (New Jersey) Houses and Residents
| Barrington: | $257,471 |
| New Jersey: | $428,900 |
Mean price in 2022:
Detached houses: $256,229
Here: $256,229 State: $537,591
Total population: 6,826 (All urban)
Houses: 3,470 (3,398 occupied: 1,865 owner occupied, 1,592 renter occupied)
| % of renters here: | 46% |
| State: | 35% |
Housing density: 2,161 houses/condos per square mile
Median price asked for vacant for-sale houses and condos in 2022 in this county: $280,676.
Median contract rent in 2022: $1,140 (lower quartile is $705, upper quartile is $1,332)
Median rent asked for vacant for-rent units in 2022: $5,020
Median gross rent in Barrington, NJ in 2022: $1,250
Housing units in Barrington with a mortgage: 992 (131 second mortgage, 0 home equity loan, 139 both second mortgage and home equity loan)
Houses without a mortgage: 28
Median household income for houses/condos with a mortgage: $135,108
Median household income for apartments without a mortgage: $87,274
Median monthly housing costs: $1,320
Compare current foreclosures near Barrington, NJ:
| Photo | Address | Area | Beds / Baths | Price | Details |
|---|---|---|---|---|---|

|
#1
Edwards Ave
Barrington, NJ 08007
|
1,112 sq. feet
|
1 baths 3 beds |
$325,500
|
show details |

|
#2
Clements Bridge Rd
Barrington, NJ 08007
|
1,390 sq. feet
|
- baths - beds |
show details | |

|
#3
E Williams Ave
Barrington, NJ 08007
|
900 sq. feet
|
- baths - beds |
show details | |

|
#4
Thomas Ave
Barrington, NJ 08007
|
872 sq. feet
|
- baths - beds |
show details | |

|
#5
Reading Ave
Barrington, NJ 08007
|
1,422 sq. feet
|
- baths - beds |
show details | |

|
#6
Austin Ave
Barrington, NJ 08007
|
872 sq. feet
|
- baths - beds |
show details | |

|
#7
White Horse Pike Ste 14
Barrington, NJ 08007
|
- sq. feet
|
- baths - beds |
show details | |

|
#8
Hancock Dr Apt 206
Barrington, NJ 08007
|
- sq. feet
|
- baths - beds |
show details | |

|
#9
Clements Bridge Rd Apt 3
Barrington, NJ 08007
|
- sq. feet
|
- baths - beds |
show details | |

|
#10
Yeadon Ave
Lansdowne, PA 19050
|
1,388 sq. feet
|
1 baths 3 beds |
$273,000
|
show details |
| Photo | Address | Area | Beds / Baths | Price | Details |
|---|---|---|---|---|---|

|
#11
Watson Blvd
Clementon, NJ 08021
|
1,268 sq. feet
|
1 baths 3 beds |
$289,900
|
show details |

|
#12
Mark Pl
Philadelphia, PA 19115
|
2,185 sq. feet
|
2 baths 4 beds |
$609,000
|
show details |

|
#13
N Front St Apt B
Philadelphia, PA 19123
|
2,491 sq. feet
|
2 baths 3 beds |
$659,500
|
show details |

|
#14
N 5th St
Philadelphia, PA 19126
|
1,420 sq. feet
|
2 baths 3 beds |
$313,900
|
show details |

|
#15
Broadway
Westville, NJ 08093
|
1,548 sq. feet
|
1 baths 3 beds |
$259,900
|
show details |

|
#16
Manchester Rd
Elkins Park, PA 19027
|
3,444 sq. feet
|
2 baths 3 beds |
$548,900
|
show details |

|
#17
Harvey Ave
Pennsauken, NJ 08110
|
1,555 sq. feet
|
2 baths 4 beds |
$415,000
|
show details |

|
#18
Ashbourne Rd
Elkins Park, PA 19027
|
3,104 sq. feet
|
3 baths 6 beds |
$154,500
|
show details |

|
#19
Jessamine Ave
Oaklyn, NJ 08107
|
864 sq. feet
|
2 baths 5 beds |
$389,900
|
show details |

|
#20
W Oakdale Street
Philadelphia, PA 19132
|
1,152 sq. feet
|
2 baths 3 beds |
$108,900
|
show details |
| Photo | Address | Area | Beds / Baths | Price | Details |
|---|---|---|---|---|---|

|
#21
Covered Bridge Rd
Cherry Hill, NJ 08034
|
1,343 sq. feet
|
1 baths 3 beds |
$450,000
|
show details |

|
#22
Christian St
Philadelphia, PA 19146
|
1,612 sq. feet
|
2 baths 5 beds |
$449,900
|
show details |

|
#23
Cooper St
Woodbury, NJ 08096
|
936 sq. feet
|
1 baths 3 beds |
$255,000
|
show details |

|
#24
Kershaw St
Philadelphia, PA 19131
|
1,284 sq. feet
|
1 baths 3 beds |
$134,500
|
show details |

|
#25
S 8th St
Philadelphia, PA 19148
|
1,170 sq. feet
|
1 baths 3 beds |
$168,500
|
show details |

|
#26
Foxglove Dr
Riverside, NJ 08075
|
840 sq. feet
|
1 baths 2 beds |
$113,683
|
show details |

|
#27
Fries Mill Rd
Franklinville, NJ 08322
|
2,266 sq. feet
|
2 baths 3 beds |
$389,900
|
show details |

|
#28
N 59th St
Philadelphia, PA 19151
|
1,244 sq. feet
|
1 baths 3 beds |
$241,500
|
show details |

|
#29
Pershing Ave
Darby, PA 19023
|
1,179 sq. feet
|
1 baths 3 beds |
$309,900
|
show details |

|
#30
Edgewood Ave
Audubon, NJ 08106
|
1,250 sq. feet
|
1 baths 4 beds |
$375,000
|
show details |
| Photo | Address | Area | Beds / Baths | Price | Details |
|---|---|---|---|---|---|

|
#31
Browning Rd
Merchantville, NJ 08109
|
2,376 sq. feet
|
3 baths 5 beds |
$469,900
|
show details |

|
#32
Clements Bridge Rd
Barrington, NJ 08007
|
- sq. feet
|
- baths - beds |
show details | |

|
#33
Austin Ave
Barrington, NJ 08007
|
- sq. feet
|
- baths - beds |
show details | |

|
#34
Chestnut Ave
Ardmore, PA 19003
|
1,576 sq. feet
|
1 baths 3 beds |
$240,653
|
show details |

|
#35
E Wishart St
Philadelphia, PA 19134
|
1,064 sq. feet
|
1 baths 3 beds |
$1,290,613
|
show details |

|
#36
Pickering St
Philadelphia, PA 19150
|
1,170 sq. feet
|
1 baths 3 beds |
$169,900
|
show details |

|
#37
Keenan St
Elkins Park, PA 19027
|
1,234 sq. feet
|
2 baths 2 beds |
$217,220
|
show details |

|
#38
Presidential Blvd Unit 915b
Bala Cynwyd, PA 19004
|
579 sq. feet
|
1 baths 1 beds |
$104,531
|
show details |

|
#39
Johns Rd
Cheltenham, PA 19012
|
1,666 sq. feet
|
1 baths 3 beds |
$276,140
|
show details |

|
#40
Brookhurst Ave
Narberth, PA 19072
|
1,764 sq. feet
|
1 baths 3 beds |
$352,798
|
show details |
| Photo | Address | Area | Beds / Baths | Price | Details |
|---|---|---|---|---|---|

|
#41
44th St
Pennsauken, NJ 08110
|
- sq. feet
|
1 baths 3 beds |
$94,900
|
show details |

|
#42
N Bambrey St
Philadelphia, PA 19121
|
964 sq. feet
|
1 baths 3 beds |
$107,333
|
show details |

|
#43
Cornelius St
Philadelphia, PA 19138
|
1,166 sq. feet
|
1 baths 3 beds |
$118,648
|
show details |

|
#44
N Newkirk St
Philadelphia, PA 19132
|
960 sq. feet
|
1 baths 3 beds |
$1,128,765
|
show details |

|
#45
Windermere Ave
Drexel Hill, PA 19026
|
- sq. feet
|
2 baths 3 beds |
$218,400
|
show details |

|
#46
W Oakdale St
Philadelphia, PA 19132
|
1,134 sq. feet
|
1 baths 3 beds |
$1,322,645
|
show details |

|
#47
Sharpless Rd
Elkins Park, PA 19027
|
3,857 sq. feet
|
2 baths 6 beds |
$373,597
|
show details |

|
#48
Leonard St
Philadelphia, PA 19149
|
1,024 sq. feet
|
1 baths 3 beds |
$54,557
|
show details |

|
#49
67th Ave
Philadelphia, PA 19138
|
1,146 sq. feet
|
1 baths 3 beds |
$8,900
|
show details |

|
Check over 1 million property listings on Foreclosure.com!
|
browse all offers | |||

Latest news about housing in Barrington, NJ collected exclusively by city-data.com from local newspapers, TV, and radio stations


Median year apartment built: 1964
Household type by relationship:
Households: 7,053- Male householders: 1,742 (721 living alone), Female householders: 1,649 (588 living alone)
1,389 spouses (1,386 opposite-sex spouses), 147 unmarried partners, (147 opposite-sex unmarried partners), 1,749 children (1,640 natural, 83 adopted, 26 stepchildren), 110 grandchildren, 28 brothers or sisters, 89 parents, 0 foster children, 22 other relatives, 120 non-relatives
- In group quarters: 4
Size of family households: 1,076 2-persons, 423 3-persons, 231 4-persons, 140 5-persons, 32 6-persons.
Size of nonfamily households: 1,326 1-person, 202 2-persons, 16 3-persons.
773 married couples with children.
186 single-parent households (4 men, 182 women).
90.6% of residents of Barrington speak English at home.
3.2% of residents speak Spanish at home (60% speak English very well, 23% speak English well, 17% speak English not well).
3.1% of residents speak other Indo-European language at home (45% speak English very well, 52% speak English well, 3% speak English not well).
2.2% of residents speak Asian or Pacific Island language at home (24% speak English very well, 71% speak English well, 4% speak English not well).
Foreign born population: 349 (4.9%)
(41.5% of them are naturalized citizens)
| Here: | 6.9 |
| State: | 6.8 |
| Here: | 3.3 |
| State: | 3.9 |

- Bedrooms in owner-occupied houses and condos in Barrington, New Jersey
- 0no bedroom
- 151 bedroom
- 982 bedrooms
- 1,1013 bedrooms
- 4444 bedrooms
- 2075+ bedrooms

- Bedrooms in renter-occupied apartments in Barrington, New Jersey
- 170no bedroom
- 7061 bedroom
- 6252 bedrooms
- 843 bedrooms
- 84 bedrooms
- 05+ bedrooms

- Cars and other vehicles available in Barrington in owner-occupied houses/condos
- 77no vehicle
- 3741 vehicle
- 9922 vehicles
- 3093 vehicles
- 924 vehicles
- 225+ vehicles

- Cars and other vehicles available in Barrington in renter-occupied apartments
- 328no vehicle
- 6971 vehicle
- 5302 vehicles
- 373 vehicles
- 04 vehicles
- 05+ vehicles

- Rooms in owner-occupied houses in Barrington, New Jersey
- 01 room
- 02 rooms
- 03 rooms
- 404 rooms
- 3725 rooms
- 3656 rooms
- 4067 rooms
- 3158 rooms
- 3699+ rooms

- Rooms in renter-occupied apartments in Barrington, New Jersey
- 1431 room
- 1962 rooms
- 4923 rooms
- 4494 rooms
- 1485 rooms
- 1456 rooms
- 117 rooms
- 08 rooms
- 89+ rooms


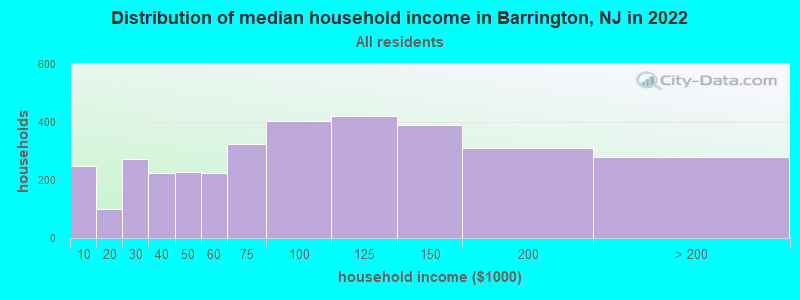
Barrington, NJ household income distribution

- 248Less than $10,000
- 100$10,000 to $19,999
- 272$20,000 to $29,999
- 223$30,000 to $39,999
- 228$40,000 to $49,999
- 225$50,000 to $59,999
- 323$60,000 to $74,999
- 402$75,000 to $99,999
- 421$100,000 to $124,999
- 388$125,000 to $149,999
- 310$150,000 to $199,999
- 280$200,000 or more
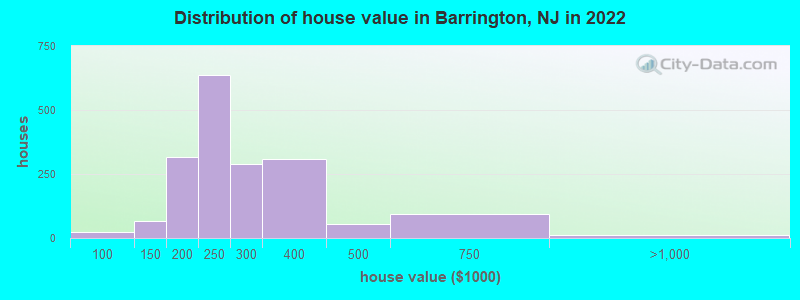
Home value of owner - occupied houses in 2022 in Barrington, NJ
-
- 24$80,000 to $89,999
- 12$100,000 to $124,999
- 55$125,000 to $149,999
- 93$150,000 to $174,999
- 223$175,000 to $199,999
- 635$200,000 to $249,999
- 289$250,000 to $299,999
- 308$300,000 to $399,999
- 54$400,000 to $499,999
- 92$500,000 to $749,999
- 12$750,000 to $999,999
Rent paid by renters in 2022 in Barrington, NJ
-
- 11$400 to $449
- 42$500 to $549
- 13$550 to $599
- 16$600 to $649
- 242$650 to $699
- 140$700 to $749
- 24$750 to $799
- 10$800 to $899
- 56$900 to $999
- 497$1,000 to $1,249
- 486$1,250 to $1,499
- 99$1,500 to $1,999
- 4$2,500 to $2,999
- 12No cash rent


Percentage of workers working in this county: 70.1%
Number of people working at home: 689 (16.6% of all workers)
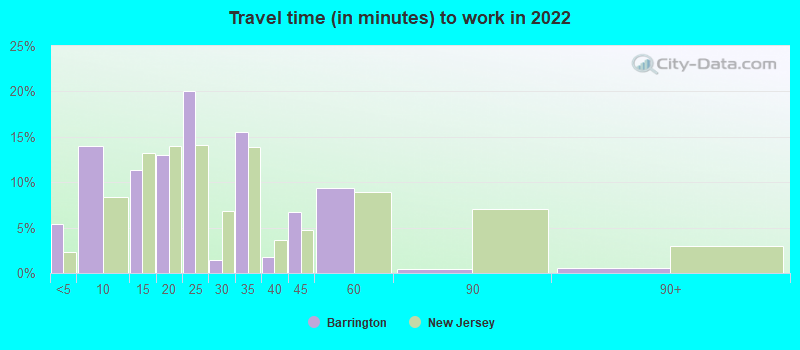
Travel time to work (commute)
- Less than 5 minutes: 139
- 5 to 9 minutes: 303
- 10 to 14 minutes: 252
- 15 to 19 minutes: 742
- 20 to 24 minutes: 554
- 25 to 29 minutes: 234
- 30 to 34 minutes: 326
- 35 to 39 minutes: 84
- 40 to 44 minutes: 75
- 45 to 59 minutes: 552
- 60 to 89 minutes: 118
- 90 or more minutes: 111
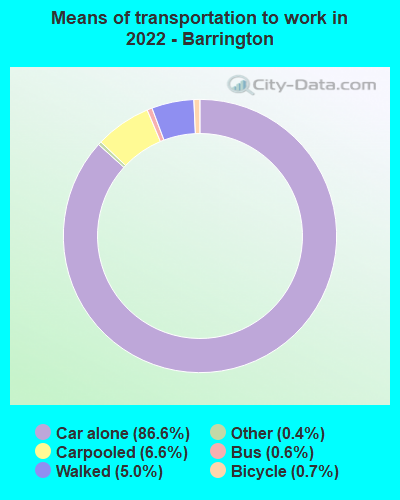
Means of transportation to work:
- Drove a car alone: 2,294 (66.4%)
- Carpooled: 229 (6.6%)
- Bus: 21 (0.6%)
- Taxi: 17 (0.5%)
- Bicycle: 19 (0.6%)
- Walked: 190 (5.5%)
- Worked at home: 689 (20.0%)

- Unemployment by race in 2022
- Unemployment rate for White non-Hispanic residents
- 7.1%Males
- 3.9%Females
- Unemployment rate for Asian residents
- 34.8%Females
- Unemployment rate for Hispanic or Latino residents
- 42.2%Females

- Year of entry for the foreign-born population in Barrington, New Jersey
- 1352010 or later
- 672000 to 2009
- 1051990 to 1999
- 541980 to 1989
- 411970 to 1979
- 84Before 1970
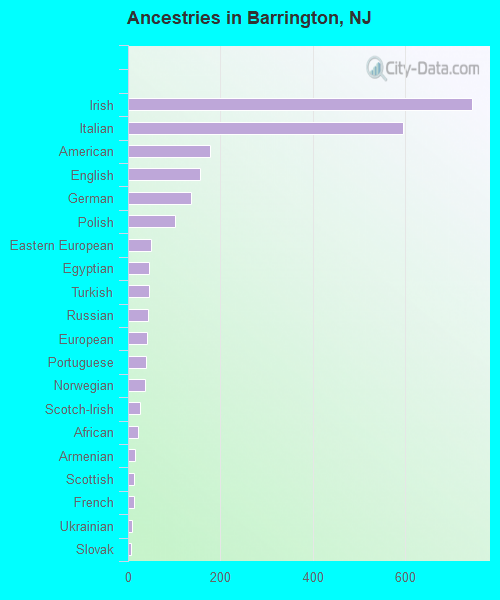
First ancestries reported:
- Irish: 745 (27.2%)
- Italian: 596 (21.7%)
- American: 177 (6.5%)
- English: 155 (5.7%)
- German: 136 (5.0%)
- Polish: 102 (3.7%)
- Eastern European: 49 (1.8%)
- Egyptian: 46 (1.7%)
- Turkish: 46 (1.7%)
- Russian: 44 (1.6%)
- European: 42 (1.5%)
- Portuguese: 39 (1.4%)
- Norwegian: 36 (1.3%)
- Scotch-Irish: 27 (1.0%)
- African: 22 (0.8%)
- Armenian: 16 (0.6%)
- Scottish: 14 (0.5%)
- French: 13 (0.5%)
- Ukrainian: 9 (0.3%)
- Slovak: 7 (0.3%)
Most common places of birth for foreign-born residents (%):
| Barrington: | 20.2% (69) |
| New Jersey: | 1.3% (27,580) |
| Barrington: | 14.3% (49) |
| New Jersey: | 0.8% (16,778) |
| Barrington: | 11.7% (40) |
| New Jersey: | 2.1% (46,020) |
| Barrington: | 10.8% (37) |
| New Jersey: | 0.3% (6,130) |
| Barrington: | 9.9% (34) |
| New Jersey: | 4.2% (90,817) |
| Barrington: | 8.2% (28) |
| New Jersey: | 3.7% (78,969) |
| Barrington: | 7.0% (24) |
| New Jersey: | 1.3% (28,871) |
| Barrington: | 5.3% (18) |
| New Jersey: | 12.8% (274,609) |
| Barrington: | 3.2% (11) |
| New Jersey: | 1.5% (33,198) |
| Barrington: | 2.9% (10) |
| New Jersey: | 3.3% (70,512) |
| Barrington: | 2.9% (10) |
| New Jersey: | 0.9% (18,317) |
Place of birth for U.S.-born residents:
- This state: 4,382
- Other state: 2,235
- Northeast: 1,767
- Midwest: 192
- South: 184
- West: 97
94.4% of Barrington residents lived in the same house 1 years ago.
Out of people who lived in different houses, 33.9% lived in this county.
Out of people who lived in different counties, 39.5% lived in New Jersey.
| Barrington: | 94.4% |
| State average: | 90.4% |
Education attainment for males 25 years and older:
- No schooling: 0
- Nursery to 4th grade: 0
- 5th and 6th grade: 164
- 7th and 8th grade: 0
- 9th grade: 0
- 10th grade: 0
- 11th grade: 14
- 12th grade, no diploma: 26
- High school graduate (or equivalency): 899
- Less than 1 year of college: 193
- Some college more than 1 year, no degree: 259
- Associate degree: 135
- Bachelor's degree: 776
- Master's degree: 326
- Professional school degree: 66
- Doctorate degree: 95

Education attainment for females 25 years and older:
- No schooling: 14
- Nursery to 4th grade: 0
- 5th and 6th grade: 0
- 7th and 8th grade: 0
- 9th grade: 0
- 10th grade: 16
- 11th grade: 19
- 12th grade, no diploma: 8
- High school graduate (or equivalency): 585
- Less than 1 year of college: 108
- Some college more than 1 year, no degree: 364
- Associate degree: 211
- Bachelor's degree: 814
- Master's degree: 385
- Professional school degree: 57
- Doctorate degree: 43


Housing units in structures:
- One, detached: 1,968
- One, attached: 15
- Two: 239
- 3 or 4: 213
- 5 to 9: 155
- 10 to 19: 188
- 20 to 49: 129
- 50 or more: 560
House/condo owner moved in on average 20 years ago
Renter moved in on average 5 years ago

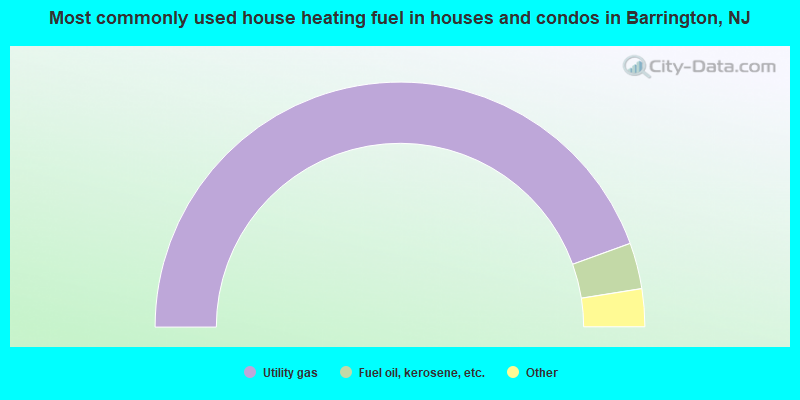
- 89.0%Utility gas
- 6.1%Fuel oil, kerosene, etc.
- 3.2%Electricity
- 1.8%Bottled, tank, or LP gas
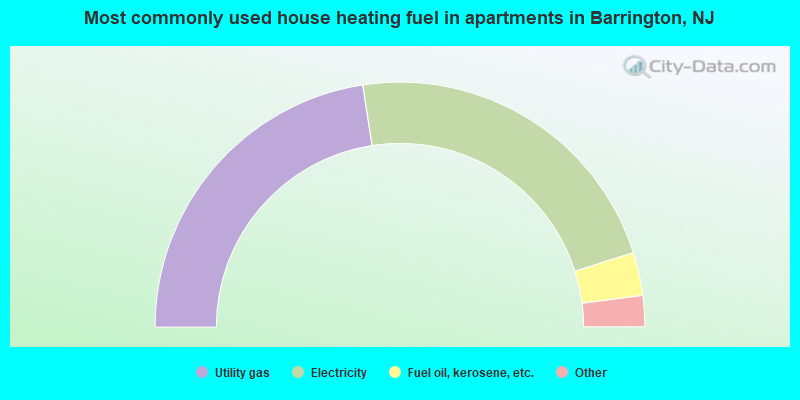
- 45.2%Utility gas
- 45.1%Electricity
- 5.7%Fuel oil, kerosene, etc.
- 2.2%No fuel used
- 1.7%Other fuel
Private vs. public school enrollment:
| Here: | 7.9% |
| New Jersey: | 12.3% |
| Here: | 8.6% |
| New Jersey: | 13.1% |
| Here: | 44.4% |
| New Jersey: | 33.2% |


