Central Contra Costa, CA (California) Houses and Residents
| Central Contra Costa: | $1,174,527 |
| California: | $715,900 |
Total population: 486,883 (Urban population: 451,974, Rural population: 7,278 (40 farm, 7,238 nonfarm))
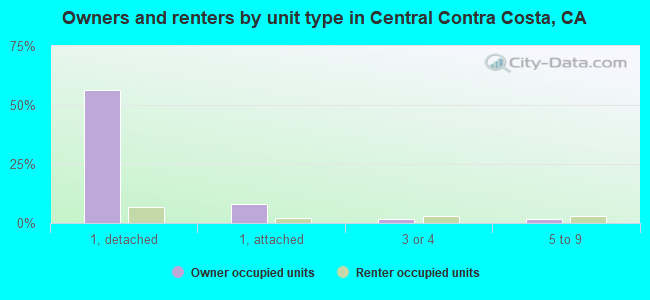
Houses: 183,777 (179,136 occupied: 127,889 owner occupied, 51,247 renter occupied)
| % of renters here: | 29% |
| State: | 44% |
Housing density: 703 houses/condos per square mile
Median price asked for vacant for-sale houses and condos in 2022 in this county: $378,161.
Median contract rent in 2022: over $2,000 (lower quartile is $1,799, upper quartile is over $2,000)
Median rent asked for vacant for-rent units in 2022: $2,610
Median gross rent in Central Contra Costa, CA in 2022: over $2,000
Housing units in Central Contra Costa with a mortgage: 90,899 (13,614 second mortgage, 13,612 home equity loan, 418 both second mortgage and home equity loan)
Houses without a mortgage: 20,208
Compare current foreclosures near Central Contra Costa, CA:
| Photo | Address | Area | Beds / Baths | Price | Details |
|---|---|---|---|---|---|

|
#1
Seminary Ave
Oakland, CA 94605
|
1,552 sq. feet
|
1 baths 3 beds |
$556,400
|
show details |

|
#2
E 12th St
Pittsburg, CA 94565
|
1,345 sq. feet
|
1 baths 2 beds |
$519,000
|
show details |

|
#3
Macarthur Blvd
Oakland, CA 94605
|
1,313 sq. feet
|
3 baths 3 beds |
$590,000
|
show details |

|
#4
Wickman Pl
San Lorenzo, CA 94580
|
900 sq. feet
|
1 baths 2 beds |
show details | |

|
#5
El Portal Dr Apt D
San Pablo, CA 94806
|
1,058 sq. feet
|
2 baths 2 beds |
show details | |

|
#6
Mohr Ln Apt C
Concord, CA 94518
|
870 sq. feet
|
1 baths 2 beds |
show details | |

|
#7
Christie Ave Apt 2423
Emeryville, CA 94608
|
768 sq. feet
|
1 baths 1 beds |
show details | |

|
#8
21st St
San Pablo, CA 94806
|
1,665 sq. feet
|
2 baths 3 beds |
show details | |

|
#9
Del Valle Cir
El Sobrante, CA 94803
|
1,022 sq. feet
|
1 baths 2 beds |
show details | |

|
#10
Putnam St
Antioch, CA 94509
|
1,245 sq. feet
|
2 baths 3 beds |
show details |
| Photo | Address | Area | Beds / Baths | Price | Details |
|---|---|---|---|---|---|

|
#11
Valle Vista Ave
Oakland, CA 94610
|
2,163 sq. feet
|
2 baths 5 beds |
show details | |

|
#12
Crucero Ave
San Pablo, CA 94806
|
1,264 sq. feet
|
2 baths 3 beds |
show details | |

|
#13
Magazine St
Vallejo, CA 94591
|
875 sq. feet
|
1 baths 3 beds |
show details | |

|
#14
106th Ave
Oakland, CA 94603
|
1,961 sq. feet
|
2 baths 3 beds |
show details | |

|
#15
Skyline Dr
Vallejo, CA 94591
|
2,030 sq. feet
|
3 baths 4 beds |
show details | |

|
#16
Grennan Ct
Vallejo, CA 94591
|
1,092 sq. feet
|
3 baths 3 beds |
show details | |

|
#17
Alamo Springs Dr
Alamo, CA 94507
|
5,671 sq. feet
|
4 baths 4 beds |
show details | |

|
#18
Dimaggio Ave
Pittsburg, CA 94565
|
1,629 sq. feet
|
1 baths 3 beds |
show details | |

|
#19
E 31st St
Oakland, CA 94602
|
688 sq. feet
|
1 baths 2 beds |
show details | |

|
#20
Wildbrook Ct Apt B
Concord, CA 94521
|
1,468 sq. feet
|
2 baths 3 beds |
show details |
| Photo | Address | Area | Beds / Baths | Price | Details |
|---|---|---|---|---|---|

|
#21
Grant St
Vallejo, CA 94590
|
1,099 sq. feet
|
1 baths 3 beds |
show details | |

|
#22
Monitor Pass Way
Antioch, CA 94531
|
1,657 sq. feet
|
2 baths 4 beds |
show details | |

|
#23
Phillip St
Vallejo, CA 94590
|
880 sq. feet
|
1 baths 2 beds |
show details | |

|
#24
F St
Oakland, CA 94603
|
842 sq. feet
|
1 baths 2 beds |
show details | |

|
#25
Linda Vista St
Benicia, CA 94510
|
764 sq. feet
|
1 baths 2 beds |
show details | |

|
#26
Athol Ave
Oakland, CA 94610
|
1,096 sq. feet
|
2 baths 2 beds |
show details | |

|
#27
California Ave
San Pablo, CA 94806
|
1,169 sq. feet
|
1 baths 2 beds |
show details | |

|
#28
Lincoln Ave
Richmond, CA 94804
|
795 sq. feet
|
1 baths 2 beds |
show details | |

|
#29
Starlight Ln Apt 165
Antioch, CA 94509
|
944 sq. feet
|
2 baths 2 beds |
show details | |

|
#30
26th Ave Apt A
Oakland, CA 94601
|
1,263 sq. feet
|
3 baths 3 beds |
show details |
| Photo | Address | Area | Beds / Baths | Price | Details |
|---|---|---|---|---|---|

|
#31
83rd Ave
Oakland, CA 94621
|
1,304 sq. feet
|
1 baths 3 beds |
show details | |

|
#32
Fran Way
El Sobrante, CA 94803
|
1,962 sq. feet
|
2 baths 3 beds |
show details | |

|
#33
Clinton Ave
Richmond, CA 94804
|
1,584 sq. feet
|
1 baths 3 beds |
show details | |

|
#34
Solano Way
Concord, CA 94520
|
1,470 sq. feet
|
2 baths 3 beds |
show details | |

|
#35
Webster St
Oakland, CA 94609
|
1,705 sq. feet
|
2 baths 3 beds |
show details | |

|
#36
Mcallister Dr
Benicia, CA 94510
|
3,824 sq. feet
|
3 baths 4 beds |
show details | |

|
#37
Vistamont Ave
Berkeley, CA 94708
|
1,381 sq. feet
|
1 baths 3 beds |
show details | |

|
#38
Dryden Dr
Vallejo, CA 94591
|
1,247 sq. feet
|
2 baths 4 beds |
show details | |

|
#39
16th St
Richmond, CA 94801
|
963 sq. feet
|
1 baths 2 beds |
show details | |

|
#40
Deer Trail Dr
Danville, CA 94506
|
3,856 sq. feet
|
3 baths 3 beds |
show details |
| Photo | Address | Area | Beds / Baths | Price | Details |
|---|---|---|---|---|---|

|
#41
Sandy Neck Way
Vallejo, CA 94591
|
1,504 sq. feet
|
2 baths 3 beds |
show details | |

|
#42
Coolidge Ave
Oakland, CA 94601
|
2,016 sq. feet
|
2 baths 3 beds |
show details | |

|
#43
Endicott St
San Leandro, CA 94579
|
1,164 sq. feet
|
1 baths 2 beds |
show details | |

|
#44
83rd Ave
Oakland, CA 94605
|
1,325 sq. feet
|
1 baths 3 beds |
show details | |

|
#45
Rancho Rd
El Sobrante, CA 94803
|
1,644 sq. feet
|
2 baths 4 beds |
show details | |

|
#46
Carberry Ave
Oakland, CA 94609
|
2,832 sq. feet
|
3 baths 4 beds |
show details | |

|
#47
W 4th St
Pittsburg, CA 94565
|
2,017 sq. feet
|
2 baths 4 beds |
show details | |

|
#48
Beverly Pl
Berkeley, CA 94707
|
1,308 sq. feet
|
1 baths 2 beds |
show details | |

|
#49
Wellington Pl
Vallejo, CA 94591
|
1,695 sq. feet
|
2 baths 4 beds |
show details | |

|
Check over 1 million property listings on Foreclosure.com!
|
browse all offers | |||

Household type by relationship:
Households: 1,038,711- In family households: 895,275 (185,206 male householders, 80,074 female householders)
199,021 spouses, 320,947 children (302,778 natural, 6,543 adopted, 11,626 stepchildren), 20,722 grandchildren, 14,424 brothers or sisters, 13,961 parents, foster children, 21,146 other relatives, 29,185 non-relatives
- In nonfamily households: 143,436 (48,395 male householders (34,478 living alone)), 61,689 female householders (50,577 living alone)), 33,352 nonrelatives
- In group quarters: 10,314 (5,346 institutionalized population)
175,577 married couples with children.
49,858 single-parent households (12,019 men, 37,839 women).
79.9% of residents of Central Contra Costa speak English at home.
7.7% of residents speak Spanish at home (53% speak English very well, 22% speak English well, 18% speak English not well, 8% don't speak English at all).
5.9% of residents speak other Indo-European language at home (71% speak English very well, 19% speak English well, 8% speak English not well, 2% don't speak English at all).
5.9% of residents speak Asian or Pacific Island language at home (60% speak English very well, 26% speak English well, 11% speak English not well, 2% don't speak English at all).
0.7% of residents speak other language at home (79% speak English very well, 17% speak English well, 4% speak English not well, 1% don't speak English at all).
Foreign born population: 129,378 (23.1%)
(63.5% of them are naturalized citizens)
| Here: | 6.4 |
| State: | 6.0 |
| Here: | 4.2 |
| State: | 3.9 |

- Bedrooms in owner-occupied houses and condos in Central Contra Costa, California
- 432no bedroom
- 3,9151 bedroom
- 21,6062 bedrooms
- 49,5543 bedrooms
- 42,9974 bedrooms
- 9,3855+ bedrooms

- Bedrooms in renter-occupied apartments in Central Contra Costa, California
- 3,820no bedroom
- 16,7041 bedroom
- 18,8152 bedrooms
- 8,7483 bedrooms
- 2,7554 bedrooms
- 4055+ bedrooms

- Cars and other vehicles available in Central Contra Costa in owner-occupied houses/condos
- 3,402no vehicle
- 30,4211 vehicle
- 59,9242 vehicles
- 24,6583 vehicles
- 7,1504 vehicles
- 2,3345+ vehicles

- Cars and other vehicles available in Central Contra Costa in renter-occupied apartments
- 6,259no vehicle
- 23,4861 vehicle
- 16,4142 vehicles
- 3,7643 vehicles
- 9764 vehicles
- 3485+ vehicles

- Rooms in owner-occupied houses in Central Contra Costa, California
- 2111 room
- 1,1962 rooms
- 4,1383 rooms
- 9,4024 rooms
- 21,1025 rooms
- 27,0696 rooms
- 25,5147 rooms
- 21,6958 rooms
- 17,5629+ rooms

- Rooms in renter-occupied apartments in Central Contra Costa, California
- 3,3541 room
- 7,5122 rooms
- 10,7653 rooms
- 12,9914 rooms
- 8,1805 rooms
- 4,5886 rooms
- 2,2187 rooms
- 1,1308 rooms
- 5099+ rooms


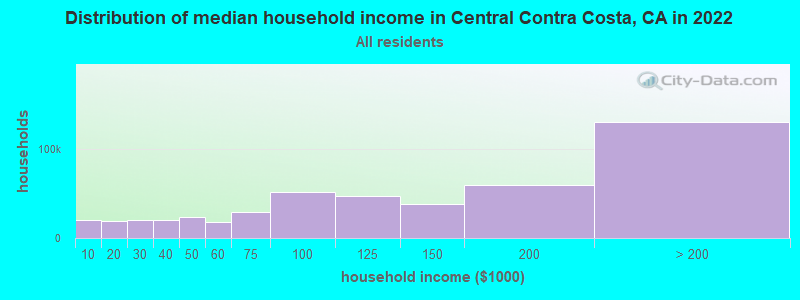
Central Contra Costa, CA household income distribution

- 19,798Less than $10,000
- 18,786$10,000 to $19,999
- 20,464$20,000 to $29,999
- 20,058$30,000 to $39,999
- 23,417$40,000 to $49,999
- 17,695$50,000 to $59,999
- 29,009$60,000 to $74,999
- 51,661$75,000 to $99,999
- 46,968$100,000 to $124,999
- 38,356$125,000 to $149,999
- 59,720$150,000 to $199,999
- 130,454$200,000 or more
Percentage of workers working in this county: 72.3%
Number of people working at home: 59,445 (20.7% of all workers)
Travel time to work (commute)
- Less than 5 minutes: 3,888
- 5 to 9 minutes: 18,326
- 10 to 14 minutes: 28,658
- 15 to 19 minutes: 29,254
- 20 to 24 minutes: 25,901
- 25 to 29 minutes: 10,545
- 30 to 34 minutes: 25,035
- 35 to 39 minutes: 6,667
- 40 to 44 minutes: 9,724
- 45 to 59 minutes: 22,881
- 60 to 89 minutes: 26,330
- 90 or more minutes: 9,100
Means of transportation to work:
- Drove a car alone: 164,972 (72.3%)
- Carpooled: 22,529 (9.9%)
- Bus or trolley bus: 2,294 (1.0%)
- Streetcar or trolley car: 159 (0.1%)
- Subway or elevated: 17,603 (7.7%)
- Railroad: 1,828 (0.8%)
- Ferryboat: 27 (0.0%)
- Taxi: 203 (0.1%)
- Motorcycle: 422 (0.2%)
- Bicycle: 1,155 (0.5%)
- Walked: 3,398 (1.5%)
- Other means: 1,719 (0.8%)
- Worked at home: 11,858 (5.2%)


- Year of entry for the foreign-born population in Central Contra Costa, California
- 15,6381995 to March 2000
- 11,8611990 to 1994
- 11,5551985 to 1989
- 8,2661980 to 1984
- 7,3861975 to 1979
- 4,8131970 to 1974
- 4,5851965 to 1969
- 10,728Before 1965
Most common places of birth for foreign-born residents (%):
| Central Contra Costa: | 17.3% (12,981) |
| California: | 44.3% (3,928,701) |
| Central Contra Costa: | 9.8% (7,357) |
| California: | 7.5% (664,935) |
| Central Contra Costa: | 5.4% (4,052) |
| California: | 3.7% (327,611) |
| Central Contra Costa: | 4.9% (3,632) |
| California: | 1.5% (133,090) |
| Central Contra Costa: | 4.7% (3,550) |
| California: | 2.2% (198,201) |
| Central Contra Costa: | 4.4% (3,271) |
| California: | 1.6% (141,181) |
| Central Contra Costa: | 4.1% (3,036) |
| California: | 1.8% (158,613) |
| Central Contra Costa: | 3.0% (2,253) |
| California: | 4.1% (359,673) |
| Central Contra Costa: | 3.0% (2,235) |
| California: | 3.0% (268,452) |
| Central Contra Costa: | 2.8% (2,105) |
| California: | 1.1% (98,160) |
| Central Contra Costa: | 2.7% (2,007) |
| California: | 1.7% (151,775) |
| Central Contra Costa: | 2.7% (1,997) |
| California: | 0.2% (20,530) |
| Central Contra Costa: | 2.7% (1,993) |
| California: | 1.0% (91,101) |
| Central Contra Costa: | 2.0% (1,495) |
| California: | 0.6% (53,250) |
| Central Contra Costa: | 1.8% (1,326) |
| California: | 4.7% (418,249) |
| Central Contra Costa: | 1.6% (1,179) |
| California: | 0.6% (54,660) |
| Central Contra Costa: | 1.5% (1,124) |
| California: | 1.3% (112,212) |
Place of birth for U.S.-born residents:
- This state: 244,757
- Other state: 134,457
- Northeast: 33,064
- Midwest: 46,962
- South: 26,290
- West: 28,141
56% of Central Contra Costa residents lived in the same house 5 years ago.
Out of people who lived in different houses, 55% lived in this county.
Out of people who lived in different counties, 68% lived in California.
Education attainment for males 25 years and older:
- No schooling: 877
- Nursery to 4th grade: 303
- 5th and 6th grade: 1,475
- 7th and 8th grade: 1,452
- 9th grade: 1,151
- 10th grade: 1,205
- 11th grade: 1,516
- 12th grade, no diploma: 3,228
- High school graduate (or equivalency): 21,029
- Less than 1 year of college: 7,882
- Some college more than 1 year, no degree: 23,787
- Associate degree: 10,472
- Bachelor's degree: 45,604
- Master's degree: 18,689
- Professional school degree: 7,804
- Doctorate degree: 4,586

Education attainment for females 25 years and older:
- No schooling: 1,158
- Nursery to 4th grade: 560
- 5th and 6th grade: 1,554
- 7th and 8th grade: 1,414
- 9th grade: 1,319
- 10th grade: 1,862
- 11th grade: 1,432
- 12th grade, no diploma: 3,774
- High school graduate (or equivalency): 29,779
- Less than 1 year of college: 12,330
- Some college more than 1 year, no degree: 29,225
- Associate degree: 14,431
- Bachelor's degree: 48,847
- Master's degree: 14,966
- Professional school degree: 4,295
- Doctorate degree: 1,725


Housing units in structures:
- One, detached: 114,066
- One, attached: 18,722
- Two: 2,260
- 3 or 4: 8,876
- 5 to 9: 9,576
- 10 to 19: 6,808
- 20 to 49: 7,834
- 50 or more: 13,270
- Mobile homes: 2,260
- Boats, RVs, vans, etc.: 105
Median worth of mobile homes: $150,626
Housing units lacking complete kitchen facilities: 0.5%

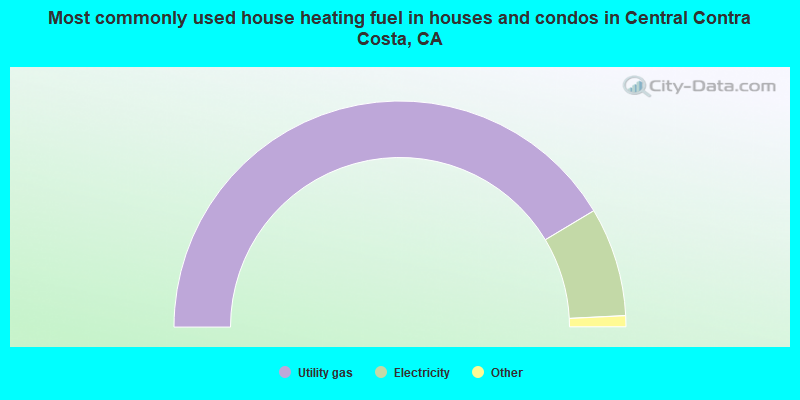
- 82.8%Utility gas
- 15.6%Electricity
- 0.8%Bottled, tank, or LP gas
- 0.6%Wood
- 0.1%Other fuel
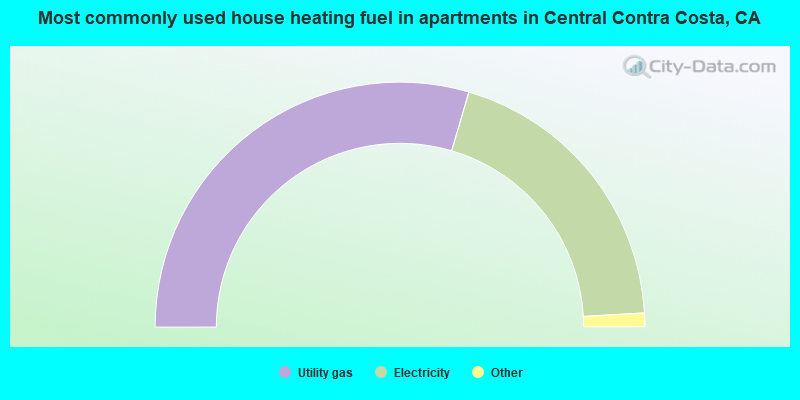
- 59.1%Utility gas
- 39.1%Electricity
- 0.8%Bottled, tank, or LP gas
- 0.5%No fuel used
- 0.3%Wood
- 0.1%Fuel oil, kerosene, etc.
Private vs. public school enrollment:
| Here: | 12.0% |
| California: | 9.9% |
| Here: | 9.2% |
| California: | 7.8% |
| Here: | 20.6% |
| California: | 15.4% |


