Clearfield, UT (Utah) Houses and Residents
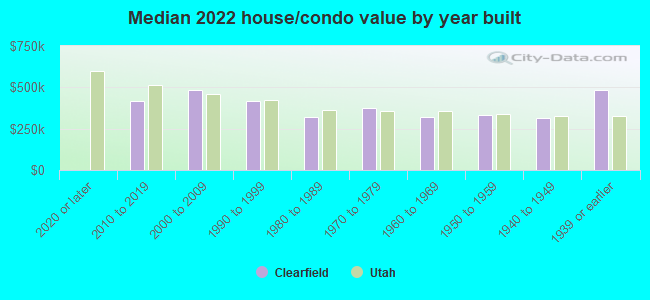
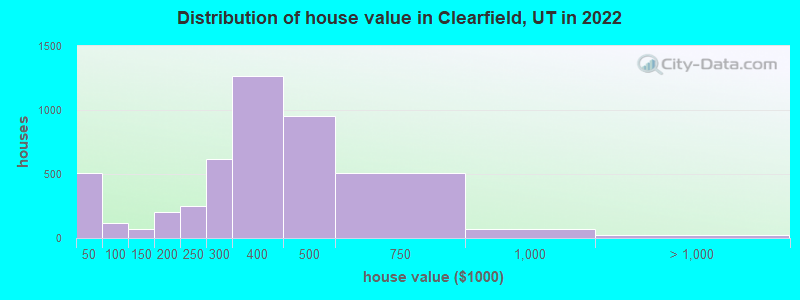
Estimated median house or condo value in 2022: $379,770 (it was $111,000 in 2000 )
Clearfield:
$379,770Utah:
$499,500
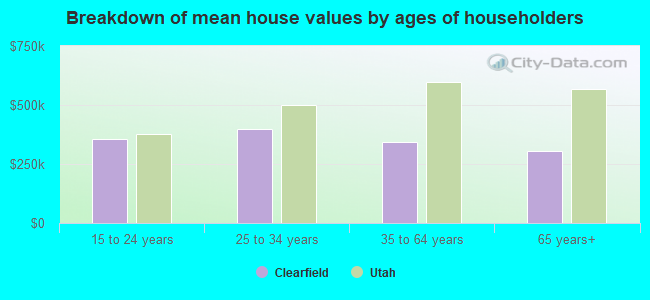
Lower value quartile - upper value quartile: $283,093 - $467,780Mean price in 2022: Detached houses: $392,088 Here:
$392,088State:
$607,750
Townhouses or other attached units: $398,398 Here:
$398,398State:
$444,505
In 3-to-4-unit structures: $113,128 Here:
$113,128State:
$362,850
In 5-or-more-unit structures: $318,167 Here:
$318,167State:
$412,810
Mobile homes: $146,279 Here:
$146,279State:
$113,475
Total population: 30,484 (Urban population: 25,918, Rural population: 0)
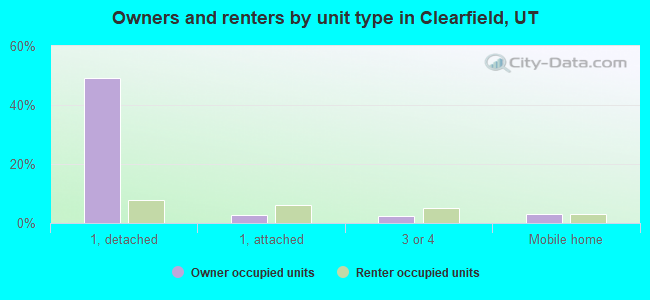
Houses: 11,752 (11,188 occupied: 6,485 owner occupied, 4,620 renter occupied )
% of renters here:
42%State:
29%
Housing density: 1,517 houses/condos per square mile
Median price asked for vacant for-sale houses and condos in 2022: $141,455.
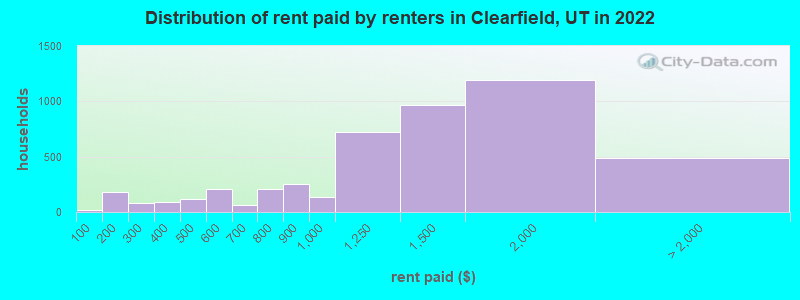
Median contract rent in 2022: $1,372 (lower quartile is $937, upper quartile is $1,683)
Median rent asked for vacant for-rent units in 2022: $2,126
Median gross rent in Clearfield, UT in 2022: $1,536
Housing units in Clearfield with a mortgage: 4,850 (415 second mortgage, 0 home equity loan, 281 both second mortgage and home equity loan )Houses without a mortgage: 43
Median household income for houses/condos with a mortgage: $92,548
Median household income for apartments without a mortgage: $59,443
Median monthly housing costs: $1,336
Data:
Median house or condo value ($)
Median house or condo value ($ change since 2000)
Median house or condo value ($) - White
Median house or condo value ($) - Black or African American
Median house or condo value ($) - Asian
Median house or condo value ($) - Hispanic or Latino
Median house or condo value ($) - American Indian and Alaska Native
Median house or condo value ($) - Multirace
Median house or condo value ($) - Other Race
Median price asked for mobile homes ($)
Household density (households per square mile)
Mean house or condo value by units in structure - 1, detached ($)
Mean house or condo value by units in structure - 1, attached ($)
Mean house or condo value by units in structure - 2 ($)
Mean house or condo value by units in structure by units in structure - 3 or 4 ($)
Mean house or condo value by units in structure - 5 or more ($)
Mean house or condo value by units in structure - Boat, RV, van, etc. ($)
Mean house or condo value by units in structure - Mobile home ($)
Median contract rent ($)
Median contract rent - Lower quartile ($)
Median contract rent - Upper quartile ($)
Median gross rent ($)
Urban houses (%)
Rural houses (%)
Houses occupied (%)
Houses occupied (% change since 2000)
Houses owner occupied (%)
Houses owner occupied (% change since 2000)
Houses renter occupied (%)
Houses renter occupied (% change since 2000)
Vacant housing units - For rent (%)
Vacant housing units - For rent (% change since 2000)
Vacant housing units - For sale only (%)
Vacant housing units - For sale only (% change since 2000)
Vacant housing units - Rented or sold, not occupied (%)
Vacant housing units - Rented or sold, not occupied (% change since 2000)
Vacant housing units - For seasonal, recreational, or occasional use (%)
Vacant housing units - For seasonal, recreational, or occasional use (% change since 2000)
Vacant housing units - For migrant workers (%)
Vacant housing units - For migrant workers (% change since 2000)
Vacant housing units - Other vacant (%)
Vacant housing units - Other vacant (% change since 2000)
Median monthly housing costs ($)
Median household income for houses/condos with a mortgage ($)
Median household income for houses/condos without a mortgage ($)
Median household income ($)
Median household income ($) - White
Median household income ($) - Black or African American
Median household income ($) - Asian
Median household income ($) - Hispanic or Latino
Median household income ($) - American Indian and Alaska Native
Median household income ($) - Multirace
Median household income ($) - Other Race
Mortgage status - with mortgage (%)
Mortgage status - with second mortgage (%)
Mortgage status - with home equity loan (%)
Mortgage status - with both second mortgage and home equity loan (%)
Mortgage status - without a mortgage (%)
Median year house/condo built
Median year apartment built
Household type by relationship - Male householder living alone (%)
Household type by relationship - Male householder not living alone (%)
Household type by relationship - Female householder living alone (%)
Household type by relationship - Female householder not living alone (%)
Household type by relationship - Opposite-Sex spouse (%)
Household type by relationship - Same-Sex spouse (%)
Household type by relationship - Opposite-Sex unmarried partner (%)
Household type by relationship - Same-Sex unmarried partner (%)
Household type by relationship - In group quarters (%)
Size of family households - 2-person household (%)
Size of family households - 3-person household (%)
Size of family households - 4-person household (%)
Size of family households - 5-person household (%)
Size of family households - 6-person household (%)
Size of family households - 7-or-more-person household (%)
Size of nonfamily households - 1-person household (%)
Size of nonfamily households - 2-person household (%)
Size of nonfamily households - 3-person household (%)
Size of nonfamily households - 4-person household (%)
Size of nonfamily households - 5-person household (%)
Size of nonfamily households - 6-person household (%)
Size of nonfamily households - 7-or-moreperson household (%)
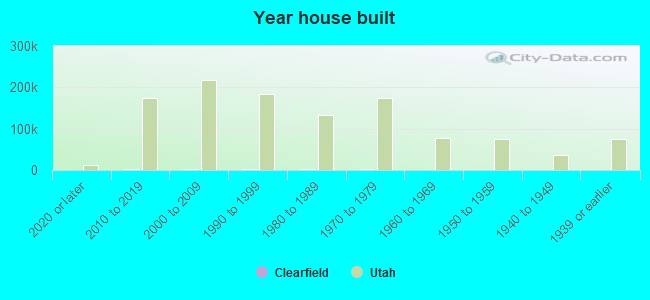
Year house built - Built 2010 or later (%)
Year house built - Built 2000 to 2009 (%)
Year house built - Built 1990 to 1999 (%)
Year house built - Built 1980 to 1989 (%)
Year house built - Built 1970 to 1979 (%)
Year house built - Built 1960 to 1969 (%)
Year house built - Built 1950 to 1959 (%)
Year house built - Built 1940 to 1949 (%)
Year house built - Built 1939 or earlier (%)
Median number of rooms in houses and condos
Median number of rooms in apartments
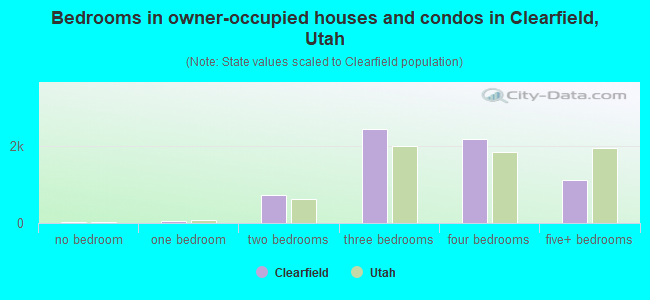
Median number of bedrooms in owner occupied houses
Mean number of bedrooms in owner occupied houses
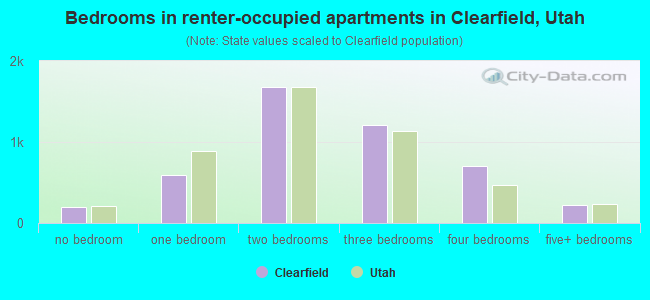
Median number of bedrooms in renter occupied houses
Mean number of bedrooms in renter occupied houses
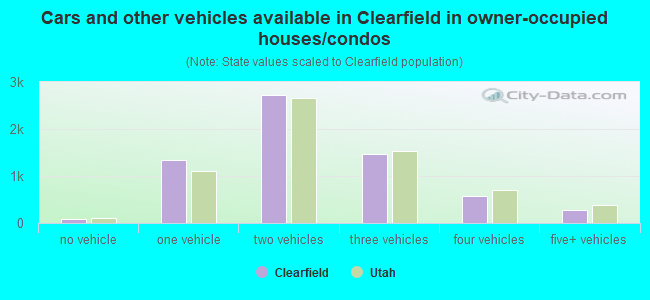
Median number of vehichles in owner occupied houses
Mean number of vehichles in owner occupied houses
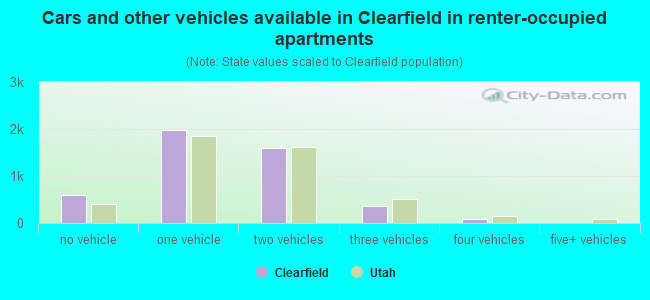
Median number of vehichles in renter occupied houses
Mean number of vehichles in renter occupied houses
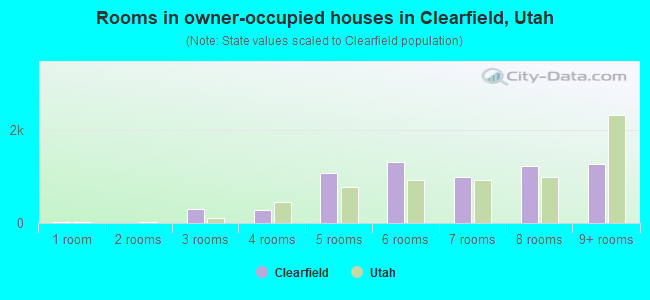
Rooms in owner-occupied houses - 1 room (%)
Rooms in owner-occupied houses - 2 rooms (%)
Rooms in owner-occupied houses - 3 rooms (%)
Rooms in owner-occupied houses - 4 rooms (%)
Rooms in owner-occupied houses - 5 rooms (%)
Rooms in owner-occupied houses - 6 rooms (%)
Rooms in owner-occupied houses - 7 rooms (%)
Rooms in owner-occupied houses - 8 rooms (%)
Rooms in owner-occupied houses - 9+ rooms (%)
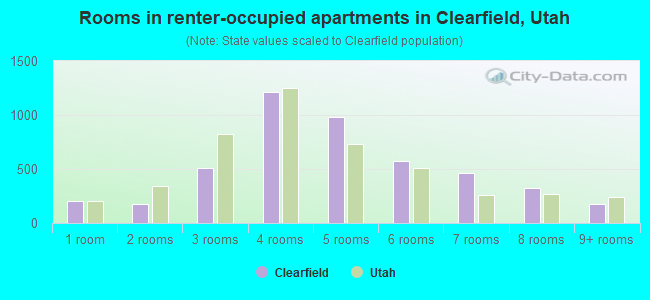
Rooms in renter-occupied houses - 1 room (%)
Rooms in renter-occupied houses - 2 rooms (%)
Rooms in renter-occupied houses - 3 rooms (%)
Rooms in renter-occupied houses - 4 rooms (%)
Rooms in renter-occupied houses - 5 rooms (%)
Rooms in renter-occupied houses - 6 rooms (%)
Rooms in renter-occupied houses - 7 rooms (%)
Rooms in renter-occupied houses - 8 rooms (%)
Rooms in renter-occupied houses - 9+ rooms (%)
Bedrooms in owner-occupied houses - no bedrooms (%)
Bedrooms in owner-occupied houses - 1 bedroom (%)
Bedrooms in owner-occupied houses - 2 bedrooms (%)
Bedrooms in owner-occupied houses - 3 bedrooms (%)
Bedrooms in owner-occupied houses - 4 bedrooms (%)
Bedrooms in owner-occupied houses - 5+ bedrooms (%)
Bedrooms in renter-occupied houses - no bedrooms (%)
Bedrooms in renter-occupied houses - 1 bedroom (%)
Bedrooms in renter-occupied houses - 2 bedrooms (%)
Bedrooms in renter-occupied houses - 3 bedrooms (%)
Bedrooms in renter-occupied houses - 4 bedrooms (%)
Bedrooms in renter-occupied houses - 5+ bedrooms (%)
Vehicles available in owner-occupied houses - no vehicle available (%)
Vehicles available in owner-occupied houses - 1 vehicle available(%)
Vehicles available in owner-occupied houses - 2 Vehicles available (%)
Vehicles available in owner-occupied houses - 3 Vehicles available (%)
Vehicles available in owner-occupied houses - 4 Vehicles available (%)
Vehicles available in owner-occupied houses - 5+ Vehicles available (%)
Vehicles available in renter-occupied houses - no vehicle available (%)
Vehicles available in renter-occupied houses - 1 vehicle available (%)
Vehicles available in renter-occupied houses - 2 Vehicles available (%)
Vehicles available in renter-occupied houses - 3 Vehicles available (%)
Vehicles available in renter-occupied houses - 4 Vehicles available (%)
Vehicles available in renter-occupied houses - 5+ Vehicles available (%)
Housing units in structures - 1, detached (%)
Housing units in structures - 1, attached (%)
Housing units in structures - 2 (%)
Housing units in structures - 3 or 4 (%)
Housing units in structures - 5 to 9 (%)
Housing units in structures - 10 to 19 (%)
Housing units in structures - 20 to 49 (%)
Housing units in structures - 50 or more (%)
Housing units in structures - Mobile home (%)
Housing units in structures - Boat, RV, van, etc. (%)
Housing units in structures - Owners - 1, detached (%)
Housing units in structures - Owners - 1, attached (%)
Housing units in structures - Owners - 2 (%)
Housing units in structures - Owners - 3 or 4 (%)
Housing units in structures - Owners - 5 to 9 (%)
Housing units in structures - Owners - 10 to 19 (%)
Housing units in structures - Owners - 20 to 49 (%)
Housing units in structures - Owners - 50 or more (%)
Housing units in structures - Owners - Mobile home (%)
Housing units in structures - Owners - Boat, RV, van, etc. (%)
Housing units in structures - Renters - 1, detached (%)
Housing units in structures - Renters - 1, attached (%)
Housing units in structures - Renters - 2 (%)
Housing units in structures - Renters - 3 or 4 (%)
Housing units in structures - Renters - 5 to 9 (%)
Housing units in structures - Renters - 10 to 19 (%)
Housing units in structures - Renters - 20 to 49 (%)
Housing units in structures - Renters - 50 or more (%)
Housing units in structures - Renters - Mobile home (%)
Housing units in structures - Renters - Boat, RV, van, etc. (%)
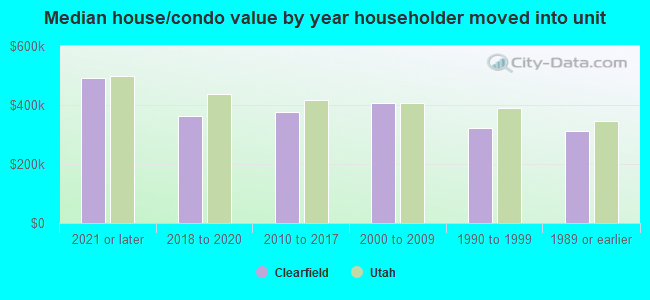
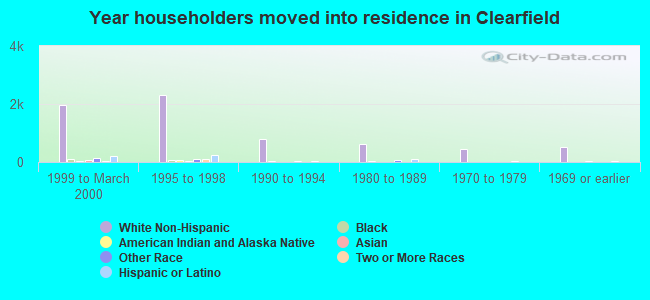
House/condo owner moved in on average (years ago)
Renter moved in on average (years ago)
Year householder moved into unit - Moved in 1999 to March 2000 (%)
Year householder moved into unit - Moved in 1999 to March 2000 (%) - White
Year householder moved into unit - Moved in 1999 to March 2000 (%) - Black or African American
Year householder moved into unit - Moved in 1999 to March 2000 (%) - Asian
Year householder moved into unit - Moved in 1999 to March 2000 (%) - Hispanic or Latino
Year householder moved into unit - Moved in 1999 to March 2000 (%) - American Indian and Alaska Native
Year householder moved into unit - Moved in 1999 to March 2000 (%) - Multirace
Year householder moved into unit - Moved in 1999 to March 2000 (%) - Other Race
Year householder moved into unit - Moved in 1995 to 1998 (%)
Year householder moved into unit - Moved in 1995 to 1998 (%) - White
Year householder moved into unit - Moved in 1995 to 1998 (%) - Black or African American
Year householder moved into unit - Moved in 1995 to 1998 (%) - Asian
Year householder moved into unit - Moved in 1995 to 1998 (%) - Hispanic or Latino
Year householder moved into unit - Moved in 1995 to 1998 (%) - American Indian and Alaska Native
Year householder moved into unit - Moved in 1995 to 1998 (%) - Multirace
Year householder moved into unit - Moved in 1995 to 1998 (%) - Other Race
Year householder moved into unit - Moved in 1990 to 1994 (%)
Year householder moved into unit - Moved in 1990 to 1994 (%) - White
Year householder moved into unit - Moved in 1990 to 1994 (%) - Black or African American
Year householder moved into unit - Moved in 1990 to 1994 (%) - Asian
Year householder moved into unit - Moved in 1990 to 1994 (%) - Hispanic or Latino
Year householder moved into unit - Moved in 1990 to 1994 (%) - American Indian and Alaska Native
Year householder moved into unit - Moved in 1990 to 1994 (%) - Multirace
Year householder moved into unit - Moved in 1990 to 1994 (%) - Other Race
Year householder moved into unit - Moved in 1980 to 1989 (%)
Year householder moved into unit - Moved in 1980 to 1989 (%) - White
Year householder moved into unit - Moved in 1980 to 1989 (%) - Black or African American
Year householder moved into unit - Moved in 1980 to 1989 (%) - Asian
Year householder moved into unit - Moved in 1980 to 1989 (%) - Hispanic or Latino
Year householder moved into unit - Moved in 1980 to 1989 (%) - American Indian and Alaska Native
Year householder moved into unit - Moved in 1980 to 1989 (%) - Multirace
Year householder moved into unit - Moved in 1980 to 1989 (%) - Other Race
Year householder moved into unit - Moved in 1970 to 1979 (%)
Year householder moved into unit - Moved in 1970 to 1979 (%) - White
Year householder moved into unit - Moved in 1970 to 1979 (%) - Black or African American
Year householder moved into unit - Moved in 1970 to 1979 (%) - Asian
Year householder moved into unit - Moved in 1970 to 1979 (%) - Hispanic or Latino
Year householder moved into unit - Moved in 1970 to 1979 (%) - American Indian and Alaska Native
Year householder moved into unit - Moved in 1970 to 1979 (%) - Multirace
Year householder moved into unit - Moved in 1970 to 1979 (%) - Other Race
Year householder moved into unit - Moved in 1969 or earlier (%)
Year householder moved into unit - Moved in 1969 or earlier (%) - White
Year householder moved into unit - Moved in 1969 or earlier (%) - Black or African American
Year householder moved into unit - Moved in 1969 or earlier (%) - Asian
Year householder moved into unit - Moved in 1969 or earlier (%) - Hispanic or Latino
Year householder moved into unit - Moved in 1969 or earlier (%) - American Indian and Alaska Native
Year householder moved into unit - Moved in 1969 or earlier (%) - Multirace
Year householder moved into unit - Moved in 1969 or earlier (%) - Other Race
Housing units lacking complete plumbing facilities (%)
Housing units lacking complete kitchen facilities (%)
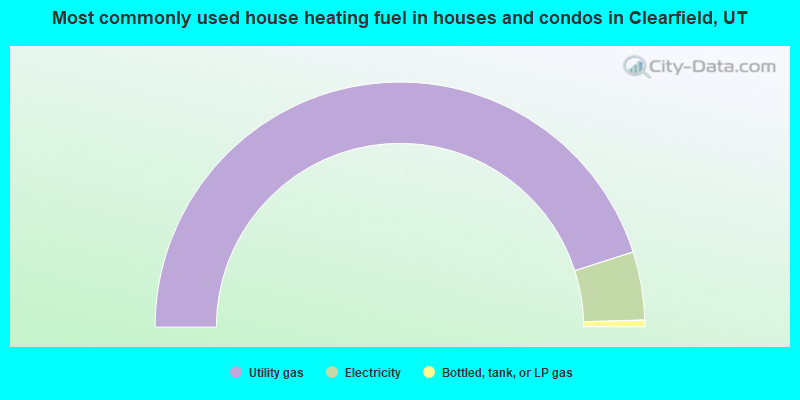
House heating fuel used in houses and condos - Utility gas (%)
House heating fuel used in houses and condos - Bottled, tank, or LP gas (%)
House heating fuel used in houses and condos - Electricity (%)
House heating fuel used in houses and condos - Fuel oil, kerosene, etc. (%)
House heating fuel used in houses and condos - Coal or coke (%)
House heating fuel used in houses and condos - Wood (%)
House heating fuel used in houses and condos - Solar energy (%)
House heating fuel used in houses and condos - Other fuel (%)
House heating fuel used in houses and condos - No fuel used (%)
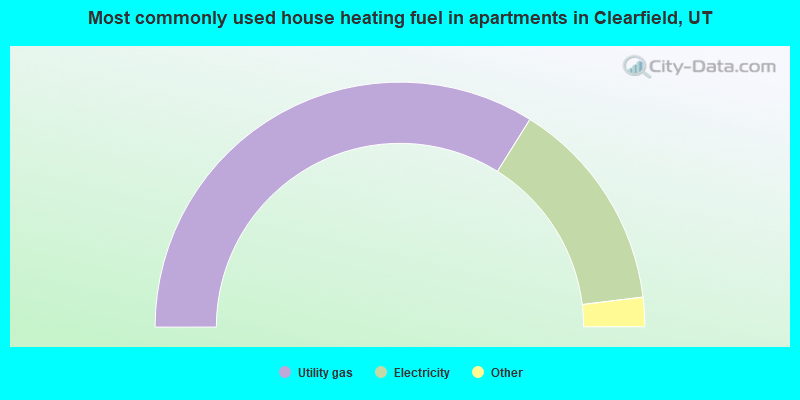
House heating fuel used in apartments - Utility gas (%)
House heating fuel used in apartments - Bottled, tank, or LP gas (%)
House heating fuel used in apartments - Electricity (%)
House heating fuel used in apartments - Fuel oil, kerosene, etc. (%)
House heating fuel used in apartments - Coal or coke (%)
House heating fuel used in apartments - Wood (%)
House heating fuel used in apartments - Solar energy (%)
House heating fuel used in apartments - Other fuel (%)
House heating fuel used in apartments - No fuel used (%)
Latest news about housing in Clearfield, UT collected exclusively by city-data.com from local newspapers, TV, and radio stations
Median year house/condo built: 1984Median year apartment built: 1989Household type by relationship:
Households: 32,985
Male householders: 5,808 (1,476 living alone ), Female householders: 5,066 (985 living alone )5,515 spouses (5,489 opposite-sex spouses ), 715 unmarried partners , (626 opposite-sex unmarried partners ), 11,379 children (10,828 natural , 251 adopted , 299 stepchildren ), 980 grandchildren , 400 brothers or sisters , 331 parents , 70 foster children , 1,087 other relatives , 1,238 non-relatives In group quarters: 392
Size of family households: 2,101 2-persons , 2,355 3-persons , 1,702 4-persons , 942 5-persons , 542 6-persons , 283 7-or-more-persons .
Size of nonfamily households: 2,331 1-person , 444 2-persons , 284 3-persons , 57 4-persons .
5,678 married couples with children. single-parent households (569 men , 1,400 women ).
84.6% of residents of Clearfield speak English at home. of residents speak Spanish at home (65% speak English very well , 14% speak English well , 14% speak English not well , 8% don't speak English at all ).of residents speak other Indo-European language at home (62% speak English very well , 38% speak English well ).of residents speak Asian or Pacific Island language at home (67% speak English very well , 28% speak English well , 5% speak English not well ).of residents speak other language at home (76% speak English very well , 24% speak English well ).
Foreign born population: 2,013 (6.1%)of them are naturalized citizens )
Median number of rooms in houses and condos:
Median number of rooms in apartments
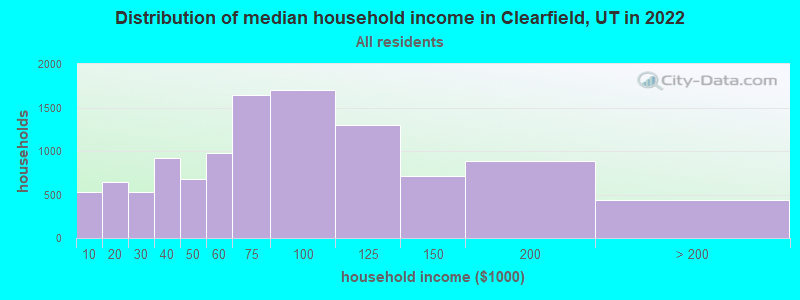
Clearfield, UT household income distribution 531 Less than $10,000647 $10,000 to $19,999533 $20,000 to $29,999923 $30,000 to $39,999678 $40,000 to $49,999979 $50,000 to $59,9991,649 $60,000 to $74,9991,697 $75,000 to $99,9991,303 $100,000 to $124,999718 $125,000 to $149,999880 $150,000 to $199,999433 $200,000 or more
Home value of owner - occupied houses in 2022 in Clearfield, UT 108 Less than $10,00036 $10,000 to $14,99971 $15,000 to $19,99918 $20,000 to $24,99933 $25,000 to $29,99924 $30,000 to $34,999212 $35,000 to $39,99917 $50,000 to $59,99926 $60,000 to $69,99976 $70,000 to $79,99928 $100,000 to $124,99943 $125,000 to $149,99986 $150,000 to $174,999119 $175,000 to $199,999252 $200,000 to $249,999618 $250,000 to $299,9991,264 $300,000 to $399,999957 $400,000 to $499,999506 $500,000 to $749,99970 $750,000 to $999,99921 $1,000,000 to $1,499,9994 $2,000,000 or moreRent paid by renters in 2022 in Clearfield, UT 18 Less than $100181 $150 to $19965 $200 to $24913 $250 to $29961 $300 to $34930 $350 to $399116 $400 to $449178 $500 to $54925 $550 to $59952 $600 to $64914 $650 to $69946 $700 to $749157 $750 to $799249 $800 to $899139 $900 to $999719 $1,000 to $1,249967 $1,250 to $1,4991,190 $1,500 to $1,999162 $2,000 to $2,49992 $2,500 to $2,999233 No cash rent
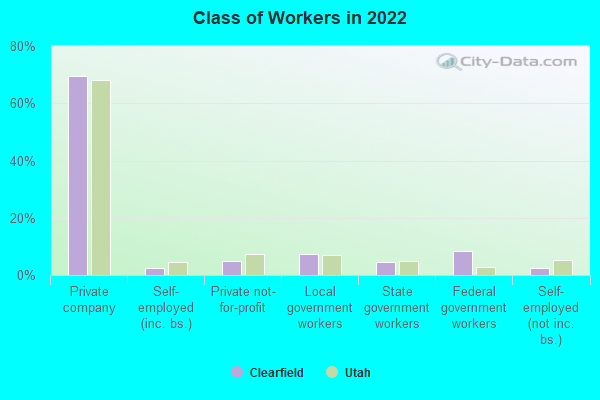
Percentage of workers working in this county: 68.9%Number of people working at home: 1,942 (11.8% of all workers )
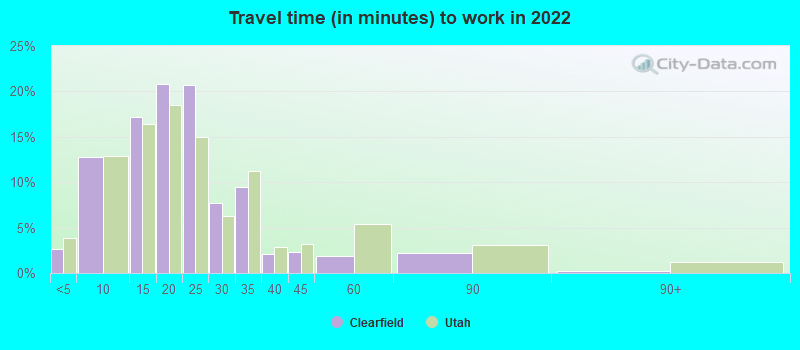
Travel time to work (commute)
Less than 5 minutes: 5375 to 9 minutes: 1,91910 to 14 minutes: 2,71215 to 19 minutes: 2,89520 to 24 minutes: 1,59925 to 29 minutes: 61930 to 34 minutes: 83035 to 39 minutes: 78140 to 44 minutes: 75345 to 59 minutes: 1,01660 to 89 minutes: 36190 or more minutes: 137
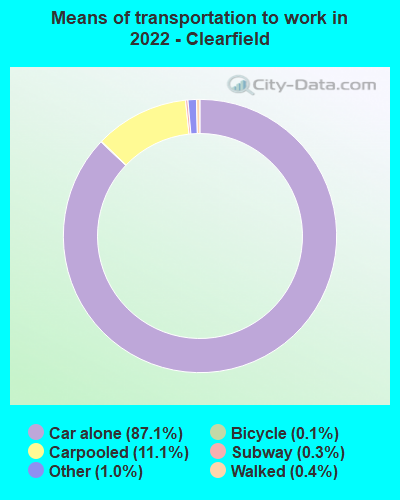
Means of transportation to work:
Drove a car alone: 11,848 (71.2%)Carpooled: 1,906 (11.4%)Bus : 9 (0.1%)Long-distance train or commuter rail : 43 (0.3%)Taxi: 185 (1.1%)Bicycle: 14 (0.1%)Walked: 61 (0.4%)Worked at home: 1,942 (11.7%)
Unemployment by race in 2022
Unemployment rate for White non-Hispanic residents 0.8% Males5.3% FemalesUnemployment rate for Black residents 5.3% MalesUnemployment rate for Asian residents 7.0% MalesUnemployment rate for other race residents 1.3% Males16.9% FemalesUnemployment rate for two or more race residents 1.3% Males2.3% FemalesUnemployment rate for Hispanic or Latino residents 1.3% Males6.4% Females
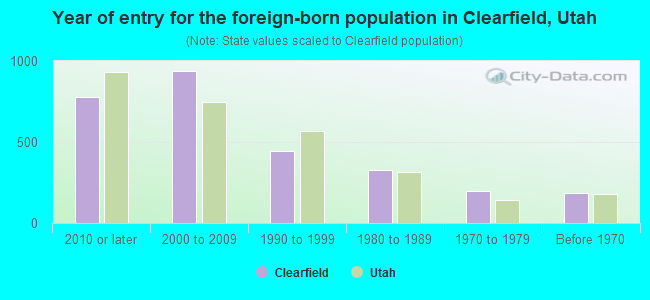
Year of entry for the foreign-born population in Clearfield, Utah
778 2010 or later 937 2000 to 2009 445 1990 to 1999 329 1980 to 1989 199 1970 to 1979 188 Before 1970
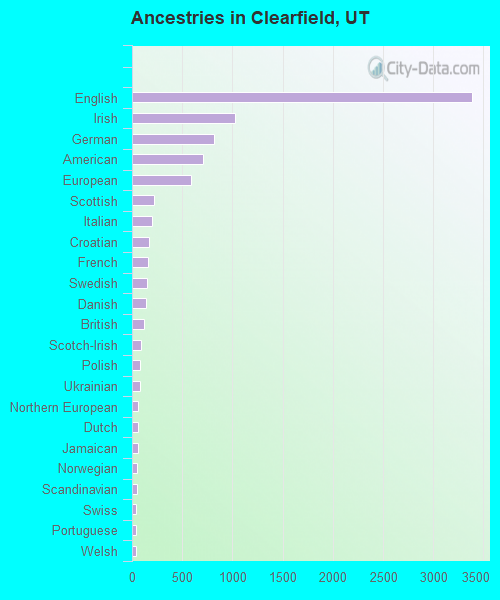
First ancestries reported:
English: 3,386 (23.2%)
Irish: 1,028 (7.0%)
German: 813 (5.6%)
American: 705 (4.8%)
European: 583 (4.0%)
Scottish: 224 (1.5%)
Italian: 199 (1.4%)
Croatian: 171 (1.2%)
French: 160 (1.1%)
Swedish: 154 (1.1%)
Danish: 140 (1.0%)
British: 122 (0.8%)
Scotch-Irish: 86 (0.6%)
Polish: 82 (0.6%)
Ukrainian: 76 (0.5%)
Northern European: 64 (0.4%)
Dutch: 63 (0.4%)
Jamaican: 60 (0.4%)
Norwegian: 47 (0.3%)
Scandinavian: 45 (0.3%)
Swiss: 38 (0.3%)
Portuguese: 36 (0.2%)
Welsh: 35 (0.2%)
African: 14 (0.10%)
Brazilian: 9 (0.06%)
Greek: 8 (0.05%)
Russian: 8 (0.05%)
Czech: 4 (0.03%)
Lithuanian: 3 (0.02%)
Hungarian: 1 (0.01%) Most common places of birth for foreign-born residents (%): Mexico Clearfield:
39.3% (1,020)Utah:
36.1% (99,740)
Vietnam Clearfield:
14.4% (374)Utah:
2.6% (7,211)
Philippines Clearfield:
9.6% (250)Utah:
2.3% (6,468)
Venezuela Clearfield:
6.4% (165)Utah:
3.2% (8,804)
Peru Clearfield:
6.1% (159)Utah:
2.9% (7,901)
Oceania, n.e.c. Clearfield:
5.4% (141)Utah:
2.7% (7,472)
Korea Clearfield:
3.0% (77)Utah:
1.6% (4,524)
Thailand Clearfield:
2.9% (75)Utah:
0.8% (2,087)
Ukraine Clearfield:
2.4% (62)Utah:
0.3% (808)
Germany Clearfield:
1.9% (50)Utah:
1.5% (4,247)
Panama Clearfield:
1.8% (48)Utah:
0.1% (307)
Colombia Clearfield:
1.8% (48)Utah:
2.0% (5,555)
Japan Clearfield:
1.6% (41)Utah:
0.7% (2,014)
Canada Clearfield:
1.6% (41)Utah:
3.0% (8,341)
Brazil Clearfield:
1.5% (40)Utah:
2.8% (7,644)
Place of birth for U.S.-born residents:
This state: 18,400Other state: 12,008Northeast: 675Midwest: 1,976South: 1,882West: 7,407 86.9% of Clearfield residents lived in the same house 1 years ago.
Out of people who lived in different houses, 33.1% lived in this county.
Out of people who lived in different counties, 52.5% lived in Utah.
Clearfield:
86.9%State average:
85.7%
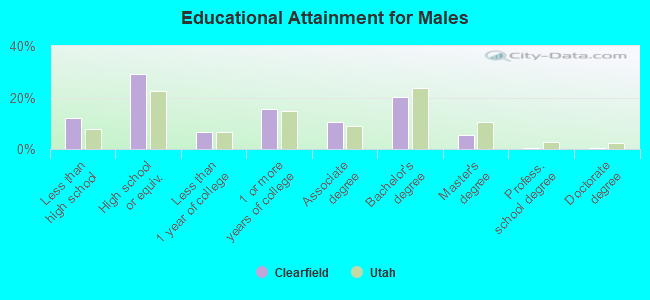
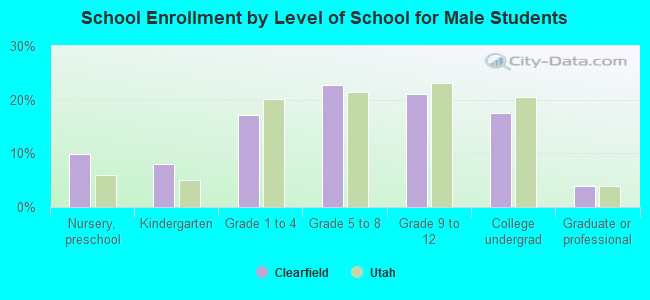
Education attainment for males 25 years and older:
No schooling: 84Nursery to 4th grade: 3665th and 6th grade: 297th and 8th grade: 469th grade: 11910th grade: 6111th grade: 18312th grade, no diploma: 363High school graduate (or equivalency): 2,996Less than 1 year of college: 684Some college more than 1 year, no degree: 1,590Associate degree: 1,094Bachelor's degree: 2,068Master's degree: 553Professional school degree: 59Doctorate degree: 36
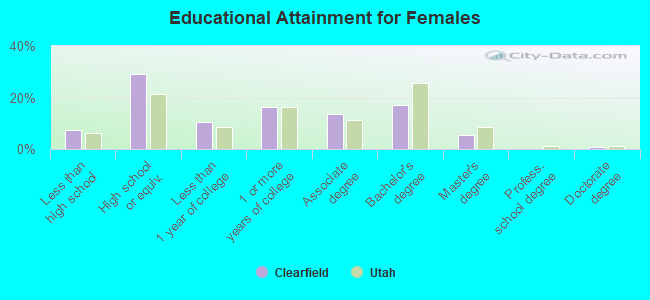
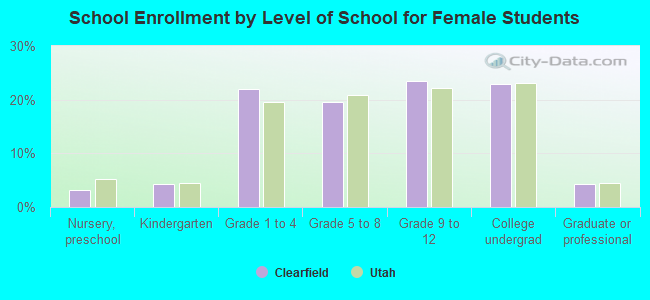
Education attainment for females 25 years and older:
No schooling: 113Nursery to 4th grade: 05th and 6th grade: 537th and 8th grade: 679th grade: 2010th grade: 1411th grade: 7112th grade, no diploma: 312High school graduate (or equivalency): 2,594Less than 1 year of college: 947Some college more than 1 year, no degree: 1,459Associate degree: 1,224Bachelor's degree: 1,511Master's degree: 483Professional school degree: 5Doctorate degree: 53
Housing units in structures:
One, detached: 6,562One, attached: 1,001Two: 5033 or 4: 9215 to 9: 48610 to 19: 49920 to 49: 60750 or more: 529Mobile homes: 638Boats, RVs, vans, etc.: 4Median worth of mobile homes: $45,263
Housing units lacking complete kitchen facilities in 2022: 0.6%House/condo owner moved in on average 8 years ago
Renter moved in on average 3 years ago
Private vs. public school enrollment:
Students in private schools in grades 1 to 8 (elementary and middle school): 163 Students in private schools in grades 9 to 12 (high school): 65 Students in private undergraduate colleges: 284