Greer, SC (South Carolina) Houses and Residents
| Greer: | $277,873 |
| South Carolina: | $254,600 |
Mean price in 2022:
Detached houses: $243,326
Here: $243,326 State: $368,255 Townhouses or other attached units: $184,263
Here: $184,263 State: $292,023 In 2-unit structures: $136,131
Here: $136,131 State: $358,283 Mobile homes: $52,496
Here: $52,496 State: $102,531
Total population: 27,676 (Urban population: 15,988, Rural population: 549 (44 farm, 505 nonfarm))
Houses: 16,146 (14,911 occupied: 10,624 owner occupied, 4,337 renter occupied)
| % of renters here: | 29% |
| State: | 28% |
Housing density: 1,001 houses/condos per square mile
Median price asked for vacant for-sale houses and condos in 2022: $506,034.
Median contract rent in 2022: $877 (lower quartile is $626, upper quartile is $1,267)
Median rent asked for vacant for-rent units in 2022: $1,680
Median gross rent in Greer, SC in 2022: $1,091
Housing units in Greer with a mortgage: 7,761 (302 second mortgage, 20 home equity loan, 210 both second mortgage and home equity loan)
Houses without a mortgage: 75
Median household income for houses/condos with a mortgage: $94,380
Median household income for apartments without a mortgage: $70,101
Median monthly housing costs: $1,133
Compare current foreclosures in Greer, SC:
| Photo | Address | Area | Beds / Baths | Price | Details |
|---|---|---|---|---|---|

|
#1
Woodgrove Way
Greer, SC 29651
|
1,868 sq. feet
|
2 baths 4 beds |
show details | |

|
#2
Hedgewood Ter
Greer, SC 29650
|
2,266 sq. feet
|
3 baths 4 beds |
show details | |

|
#3
Autumn Hill Rd
Greer, SC 29651
|
1,925 sq. feet
|
2 baths 3 beds |
show details | |

|
#4
Jones Creek Cir
Greer, SC 29650
|
2,040 sq. feet
|
3 baths 4 beds |
show details | |

|
#5
Valley Forge Dr
Greer, SC 29650
|
2,160 sq. feet
|
3 baths 4 beds |
show details | |

|
#6
Pelham Square Way
Greer, SC 29650
|
2,634 sq. feet
|
3 baths 5 beds |
show details | |

|
#7
Gibson Woods Trl
Greer, SC 29651
|
2,432 sq. feet
|
2 baths 3 beds |
show details | |

|
#8
Circle Grove Ct
Greer, SC 29650
|
1,612 sq. feet
|
3 baths 4 beds |
show details | |

|
#9
Woodlawn Hills Dr
Greer, SC 29651
|
1,092 sq. feet
|
2 baths 2 beds |
show details | |

|
#10
Thomas Edwards Ln
Greer, SC 29651
|
1,354 sq. feet
|
2 baths 3 beds |
show details |
| Photo | Address | Area | Beds / Baths | Price | Details |
|---|---|---|---|---|---|

|
#11
N Celestial Dr
Greer, SC 29651
|
1,300 sq. feet
|
2 baths 3 beds |
show details | |

|
#12
Rollingreen Rd
Greer, SC 29651
|
2,641 sq. feet
|
2 baths 3 beds |
show details | |

|
#13
Lakeview Cir
Greer, SC 29651
|
1,532 sq. feet
|
2 baths 3 beds |
show details | |

|
#14
Delward Way
Greer, SC 29651
|
1,328 sq. feet
|
2 baths 3 beds |
show details | |

|
#15
Deephallow Pl
Greer, SC 29651
|
2,634 sq. feet
|
3 baths 4 beds |
show details | |

|
#16
E Suber Rd
Greer, SC 29650
|
1,299 sq. feet
|
2 baths 3 beds |
show details | |

|
#17
Lantern Ln
Greer, SC 29651
|
1,173 sq. feet
|
2 baths 3 beds |
show details | |

|
#18
W Celestial Dr
Greer, SC 29651
|
1,416 sq. feet
|
2 baths 3 beds |
show details | |

|
#19
Rosegarth Ln
Greer, SC 29651
|
2,289 sq. feet
|
3 baths 5 beds |
show details | |

|
#20
N Highway 101
Greer, SC 29651
|
1,134 sq. feet
|
1 baths 2 beds |
show details |
| Photo | Address | Area | Beds / Baths | Price | Details |
|---|---|---|---|---|---|

|
#21
Heart Ct
Greer, SC 29651
|
1,880 sq. feet
|
3 baths 3 beds |
show details | |

|
#22
Sugar Creek Rd
Greer, SC 29650
|
1,958 sq. feet
|
2 baths 4 beds |
show details | |

|
#23
Willow Rd
Greer, SC 29651
|
1,008 sq. feet
|
1 baths 3 beds |
show details | |

|
#24
Jordan Rd
Greer, SC 29651
|
1,200 sq. feet
|
1 baths 2 beds |
show details | |

|
#25
Hampton Ridge Dr
Greer, SC 29651
|
2,352 sq. feet
|
3 baths 3 beds |
show details | |

|
#26
Maximus Dr
Greer, SC 29651
|
1,760 sq. feet
|
3 baths 3 beds |
show details | |

|
#27
Valley Glen Ct
Greer, SC 29650
|
1,891 sq. feet
|
2 baths 3 beds |
show details | |

|
#28
Castellan Dr
Greer, SC 29650
|
2,814 sq. feet
|
3 baths 3 beds |
show details | |

|
#29
Jordan Rd
Greer, SC 29651
|
3,000 sq. feet
|
2 baths 3 beds |
show details | |

|
#30
Finley Ave
Greer, SC 29651
|
2,496 sq. feet
|
2 baths 3 beds |
show details |
| Photo | Address | Area | Beds / Baths | Price | Details |
|---|---|---|---|---|---|

|
#31
Wood Dr
Greer, SC 29651
|
1,245 sq. feet
|
1 baths 2 beds |
show details | |

|
#32
Brigham Creek Dr
Greer, SC 29650
|
1,724 sq. feet
|
2 baths 3 beds |
show details | |

|
#33
Woods Rd
Greer, SC 29650
|
2,697 sq. feet
|
2 baths 3 beds |
show details | |

|
#34
Hammett Grove Ln
Greer, SC 29650
|
1,236 sq. feet
|
2 baths 2 beds |
show details | |

|
#35
Reidville Sharon Rd
Greer, SC 29651
|
1,472 sq. feet
|
1 baths 4 beds |
show details | |

|
#36
Medora Dr
Greer, SC 29650
|
1,383 sq. feet
|
2 baths 3 beds |
show details | |

|
#37
Elmer St
Greer, SC 29651
|
720 sq. feet
|
1 baths 3 beds |
show details | |

|
#38
Spring Crossing Cir
Greer, SC 29650
|
1,440 sq. feet
|
2 baths 3 beds |
show details | |

|
#39
Sugar Creek Ln
Greer, SC 29650
|
2,548 sq. feet
|
2 baths 3 beds |
show details | |

|
#40
Snow St
Greer, SC 29651
|
864 sq. feet
|
1 baths 2 beds |
show details |
| Photo | Address | Area | Beds / Baths | Price | Details |
|---|---|---|---|---|---|

|
#41
Londonderry Ct
Greer, SC 29650
|
2,216 sq. feet
|
2 baths 4 beds |
show details | |

|
#42
Wood Dr
Greer, SC 29651
|
1,245 sq. feet
|
1 baths 2 beds |
show details | |

|
#43
Overbrook Dr
Greer, SC 29650
|
1,260 sq. feet
|
2 baths 2 beds |
show details | |

|
#44
Marshland Ln
Greer, SC 29650
|
1,780 sq. feet
|
2 baths 3 beds |
show details | |

|
#45
Landrum Dr
Greer, SC 29651
|
1,660 sq. feet
|
2 baths 3 beds |
show details | |

|
#46
Hartsdale Ln
Greer, SC 29650
|
1,892 sq. feet
|
2 baths 3 beds |
show details | |

|
#47
Cornelson Dr
Greer, SC 29651
|
1,941 sq. feet
|
2 baths 3 beds |
show details | |

|
#48
Cumulus Ct
Greer, SC 29650
|
1,480 sq. feet
|
2 baths 2 beds |
show details | |

|
#49
E Hills Dr
Greer, SC 29650
|
1,768 sq. feet
|
2 baths 3 beds |
show details | |

|
Check over 1 million property listings on Foreclosure.com!
|
browse all offers | |||

Latest news about housing in Greer, SC collected exclusively by city-data.com from local newspapers, TV, and radio stations

 | 1,100 new homes coming to Greer. (24 replies) |
| D R Horton Homes in Lyman/Greer... (3 replies) |
| Question on Downtown Greer apartment Complex (2 replies) |
| Greenville - Greer, Somewhere in between??? - New Home Community Recommendations Needed (12 replies) |
| Apartments that rent month to month or short contracts (9 replies) |
| Greer apartments and neighborhoods? (3 replies) |

Median year apartment built: 1997
Household type by relationship:
Households: 38,390- Male householders: 7,191 (1,556 living alone), Female householders: 7,514 (2,628 living alone)
6,786 spouses (6,736 opposite-sex spouses), 1,066 unmarried partners, (1,038 opposite-sex unmarried partners), 12,626 children (11,661 natural, 261 adopted, 704 stepchildren), 785 grandchildren, 297 brothers or sisters, 702 parents, 0 foster children, 516 other relatives, 613 non-relatives
- In group quarters: 289
Size of family households: 3,832 2-persons, 2,474 3-persons, 1,840 4-persons, 1,377 5-persons, 256 6-persons, 271 7-or-more-persons.
Size of nonfamily households: 4,246 1-person, 562 2-persons, 82 3-persons.
7,543 married couples with children.
2,067 single-parent households (507 men, 1,560 women).
80.4% of residents of Greer speak English at home.
13.1% of residents speak Spanish at home (61% speak English very well, 15% speak English well, 19% speak English not well, 4% don't speak English at all).
2.8% of residents speak other Indo-European language at home (81% speak English very well, 15% speak English well, 2% speak English not well, 2% don't speak English at all).
3.1% of residents speak Asian or Pacific Island language at home (78% speak English very well, 7% speak English well, 12% speak English not well, 3% don't speak English at all).
0.5% of residents speak other language at home (52% speak English very well, 48% speak English well).
Foreign born population: 5,343 (13.9%)
(51.1% of them are naturalized citizens)
| Here: | 6.4 |
| State: | 6.4 |
| Here: | 4.5 |
| State: | 4.5 |

- Bedrooms in owner-occupied houses and condos in Greer, South Carolina
- 0no bedroom
- 51 bedroom
- 1,7512 bedrooms
- 5,6753 bedrooms
- 2,4044 bedrooms
- 7895+ bedrooms

- Bedrooms in renter-occupied apartments in Greer, South Carolina
- 101no bedroom
- 9521 bedroom
- 1,8182 bedrooms
- 1,1623 bedrooms
- 2034 bedrooms
- 1015+ bedrooms

- Cars and other vehicles available in Greer in owner-occupied houses/condos
- 210no vehicle
- 3,1391 vehicle
- 5,0382 vehicles
- 1,6943 vehicles
- 3444 vehicles
- 2015+ vehicles

- Cars and other vehicles available in Greer in renter-occupied apartments
- 456no vehicle
- 2,2041 vehicle
- 1,2042 vehicles
- 3133 vehicles
- 1274 vehicles
- 345+ vehicles

- Rooms in owner-occupied houses in Greer, South Carolina
- 01 room
- 02 rooms
- 1473 rooms
- 1,2034 rooms
- 2,3245 rooms
- 2,1146 rooms
- 1,2597 rooms
- 1,4608 rooms
- 2,1189+ rooms

- Rooms in renter-occupied apartments in Greer, South Carolina
- 1011 room
- 1942 rooms
- 6813 rooms
- 1,1884 rooms
- 1,1745 rooms
- 4476 rooms
- 2897 rooms
- 848 rooms
- 1789+ rooms


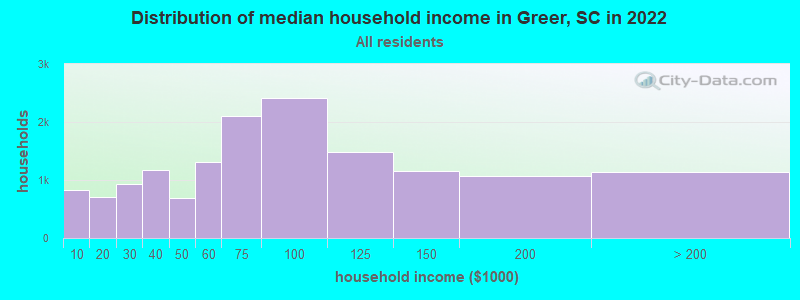
Greer, SC household income distribution

- 822Less than $10,000
- 701$10,000 to $19,999
- 938$20,000 to $29,999
- 1,164$30,000 to $39,999
- 688$40,000 to $49,999
- 1,309$50,000 to $59,999
- 2,098$60,000 to $74,999
- 2,412$75,000 to $99,999
- 1,491$100,000 to $124,999
- 1,160$125,000 to $149,999
- 1,066$150,000 to $199,999
- 1,146$200,000 or more
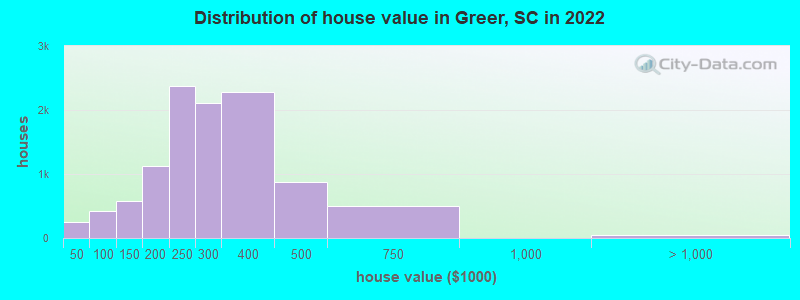
Home value of owner - occupied houses in 2022 in Greer, SC
-
- 60Less than $10,000
- 7$10,000 to $14,999
- 92$15,000 to $19,999
- 26$20,000 to $24,999
- 8$25,000 to $29,999
- 4$30,000 to $34,999
- 45$35,000 to $39,999
- 8$40,000 to $49,999
- 82$50,000 to $59,999
- 56$60,000 to $69,999
- 111$70,000 to $79,999
- 73$80,000 to $89,999
- 87$90,000 to $99,999
- 315$100,000 to $124,999
- 259$125,000 to $149,999
- 621$150,000 to $174,999
- 500$175,000 to $199,999
- 2,381$200,000 to $249,999
- 2,110$250,000 to $299,999
- 2,279$300,000 to $399,999
- 881$400,000 to $499,999
- 500$500,000 to $749,999
- 21$1,000,000 to $1,499,999
- 30$2,000,000 or more
Rent paid by renters in 2022 in Greer, SC
-
- 12Less than $100
- 102$100 to $149
- 27$150 to $199
- 84$200 to $249
- 31$250 to $299
- 130$300 to $349
- 95$350 to $399
- 227$400 to $449
- 63$450 to $499
- 178$500 to $549
- 83$550 to $599
- 189$600 to $649
- 137$650 to $699
- 198$700 to $749
- 314$750 to $799
- 386$800 to $899
- 348$900 to $999
- 600$1,000 to $1,249
- 378$1,250 to $1,499
- 569$1,500 to $1,999
- 80$2,000 to $2,499
- 9$2,500 to $2,999
- 24$3,500 or more
- 41No cash rent


Percentage of workers working in this county: 67.1%
Number of people working at home: 2,803 (14.8% of all workers)
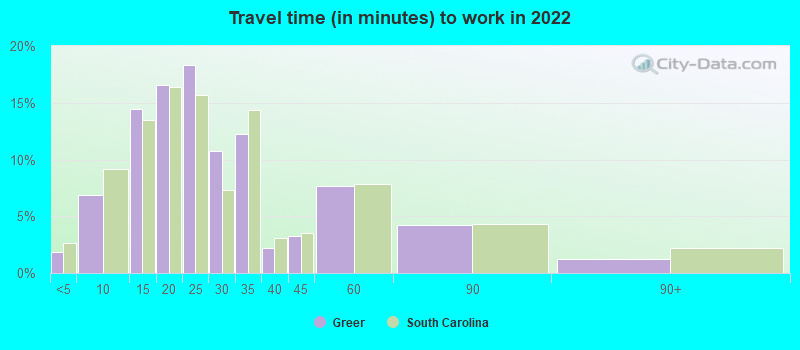
Travel time to work (commute)
- Less than 5 minutes: 285
- 5 to 9 minutes: 1,133
- 10 to 14 minutes: 2,690
- 15 to 19 minutes: 2,015
- 20 to 24 minutes: 2,678
- 25 to 29 minutes: 1,615
- 30 to 34 minutes: 3,052
- 35 to 39 minutes: 784
- 40 to 44 minutes: 458
- 45 to 59 minutes: 1,002
- 60 to 89 minutes: 350
- 90 or more minutes: 263
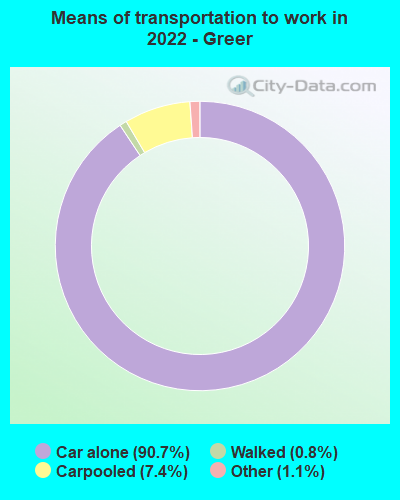
Means of transportation to work:
- Drove a car alone: 18,027 (80.6%)
- Carpooled: 1,369 (6.1%)
- Taxi: 138 (0.6%)
- Walked: 140 (0.6%)
- Worked at home: 2,803 (12.5%)

- Unemployment by race in 2022
- Unemployment rate for White non-Hispanic residents
- 2.9%Males
- 4.5%Females
- Unemployment rate for Black residents
- 9.2%Males
- 4.2%Females
- Unemployment rate for other race residents
- 4.6%Females
- Unemployment rate for two or more race residents
- 1.0%Males
- Unemployment rate for Hispanic or Latino residents
- 2.9%Males
- 2.7%Females

- Year of entry for the foreign-born population in Greer, South Carolina
- 1,9532010 or later
- 1,7902000 to 2009
- 7221990 to 1999
- 1991980 to 1989
- 711970 to 1979
- 95Before 1970
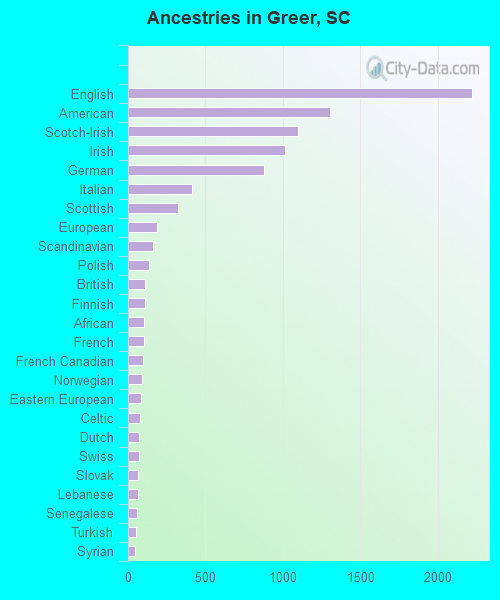
First ancestries reported:
- English: 2,221 (10.9%)
- American: 1,303 (6.4%)
- Scotch-Irish: 1,098 (5.4%)
- Irish: 1,012 (5.0%)
- German: 880 (4.3%)
- Italian: 413 (2.0%)
- Scottish: 322 (1.6%)
- European: 187 (0.9%)
- Scandinavian: 160 (0.8%)
- Polish: 133 (0.7%)
- British: 112 (0.5%)
- Finnish: 111 (0.5%)
- African: 102 (0.5%)
- French: 101 (0.5%)
- French Canadian: 99 (0.5%)
- Norwegian: 90 (0.4%)
- Eastern European: 87 (0.4%)
- Celtic: 76 (0.4%)
- Dutch: 73 (0.4%)
- Swiss: 68 (0.3%)
- Slovak: 63 (0.3%)
- Lebanese: 62 (0.3%)
- Senegalese: 55 (0.3%)
- Turkish: 50 (0.2%)
- Syrian: 47 (0.2%)
- Moroccan: 45 (0.2%)
- Canadian: 40 (0.2%)
- Northern European: 34 (0.2%)
- British West Indian: 34 (0.2%)
- Brazilian: 31 (0.2%)
- Welsh: 30 (0.1%)
- Trinidadian and Tobagonian: 29 (0.1%)
- Haitian: 27 (0.1%)
- Greek: 26 (0.1%)
- Russian: 26 (0.1%)
- Ethiopian: 22 (0.1%)
- Hungarian: 17 (0.08%)
- Belgian: 16 (0.08%)
- Slovene: 16 (0.08%)
- Pennsylvania German: 12 (0.06%)
- Barbadian: 5 (0.02%)
Most common places of birth for foreign-born residents (%):
| Greer: | 20.7% (1,180) |
| South Carolina: | 22.5% (60,774) |
| Greer: | 19.2% (1,092) |
| South Carolina: | 6.8% (18,307) |
| Greer: | 9.3% (530) |
| South Carolina: | 4.8% (12,834) |
| Greer: | 6.7% (384) |
| South Carolina: | 1.4% (3,822) |
| Greer: | 6.0% (342) |
| South Carolina: | 4.3% (11,533) |
| Greer: | 3.6% (208) |
| South Carolina: | 1.1% (2,998) |
| Greer: | 2.6% (147) |
| South Carolina: | 3.0% (8,193) |
| Greer: | 2.4% (138) |
| South Carolina: | 1.7% (4,513) |
| Greer: | 2.4% (136) |
| South Carolina: | 0.5% (1,414) |
| Greer: | 2.3% (133) |
| South Carolina: | 0.4% (1,109) |
| Greer: | 1.9% (109) |
| South Carolina: | 4.1% (11,031) |
| Greer: | 1.8% (100) |
| South Carolina: | 3.7% (9,982) |
| Greer: | 1.7% (99) |
| South Carolina: | 2.3% (6,308) |
Place of birth for U.S.-born residents:
- This state: 17,045
- Other state: 14,971
- Northeast: 4,117
- Midwest: 2,850
- South: 6,971
- West: 1,025
84.2% of Greer residents lived in the same house 1 years ago.
Out of people who lived in different houses, 28.0% lived in this county.
Out of people who lived in different counties, 56.2% lived in South Carolina.
| Greer: | 84.2% |
| State average: | 86.5% |
Education attainment for males 25 years and older:
- No schooling: 190
- Nursery to 4th grade: 5
- 5th and 6th grade: 92
- 7th and 8th grade: 178
- 9th grade: 50
- 10th grade: 185
- 11th grade: 143
- 12th grade, no diploma: 487
- High school graduate (or equivalency): 2,282
- Less than 1 year of college: 939
- Some college more than 1 year, no degree: 1,512
- Associate degree: 1,067
- Bachelor's degree: 2,907
- Master's degree: 1,578
- Professional school degree: 417
- Doctorate degree: 80

Education attainment for females 25 years and older:
- No schooling: 107
- Nursery to 4th grade: 2
- 5th and 6th grade: 15
- 7th and 8th grade: 45
- 9th grade: 161
- 10th grade: 162
- 11th grade: 323
- 12th grade, no diploma: 168
- High school graduate (or equivalency): 3,312
- Less than 1 year of college: 944
- Some college more than 1 year, no degree: 1,726
- Associate degree: 1,143
- Bachelor's degree: 3,442
- Master's degree: 1,600
- Professional school degree: 148
- Doctorate degree: 358


Housing units in structures:
- One, detached: 11,301
- One, attached: 1,555
- Two: 193
- 3 or 4: 668
- 5 to 9: 557
- 10 to 19: 460
- 20 to 49: 552
- 50 or more: 422
- Mobile homes: 433
Housing units lacking complete kitchen facilities in 2022: 2.9%
House/condo owner moved in on average 5 years ago
Renter moved in on average 4 years ago

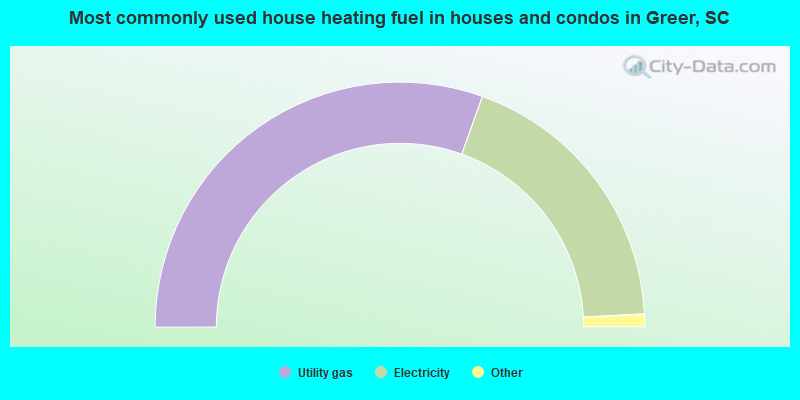
- 61.0%Utility gas
- 37.4%Electricity
- 1.2%Bottled, tank, or LP gas
- 0.2%Fuel oil, kerosene, etc.
- 0.1%No fuel used
- 0.1%Wood
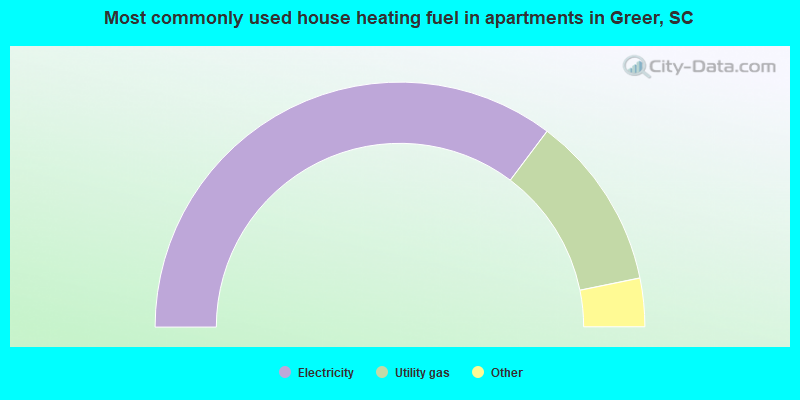
- 70.6%Electricity
- 23.1%Utility gas
- 3.9%Bottled, tank, or LP gas
- 2.0%Fuel oil, kerosene, etc.
- 0.5%No fuel used
Private vs. public school enrollment:
| Here: | 19.2% |
| South Carolina: | 14.4% |
| Here: | 3.2% |
| South Carolina: | 11.1% |
| Here: | 9.6% |
| South Carolina: | 21.9% |


