Hollister, CA (California) Houses and Residents
Estimated median house or condo value in 2022: $727,483 (it was $262,100 in 2000 )
Hollister:
$727,483California:
$715,900
Lower value quartile - upper value quartile: $577,095 - $786,647Mean price in 2022: Detached houses: $690,177 Here:
$690,177State:
$988,808
Townhouses or other attached units: $602,335 Here:
$602,335State:
$838,546
In 2-unit structures: $700,772 Here:
$700,772State:
$1,138,100
In 5-or-more-unit structures: $506,269 Here:
$506,269State:
$730,996
Mobile homes: $139,609 Here:
$139,609State:
$184,506
Total population: 37,086 (Urban population: 34,450 (all inside urban clusters), Rural population: 164 (29 farm, 135 nonfarm ))
Houses: 12,943 (12,787 occupied: 7,925 owner occupied, 4,761 renter occupied )
% of renters here:
38%State:
44%
Housing density: 1,970 houses/condos per square mile
Median price asked for vacant for-sale houses and condos in 2022: $1,563,876.
Median contract rent in 2022: $1,429 (lower quartile is $742, upper quartile is over $2,000)
Median rent asked for vacant for-rent units in 2022: $23,429
Median gross rent in Hollister, CA in 2022: $1,583
Housing units in Hollister with a mortgage: 6,548 (321 second mortgage, 76 home equity loan, 325 both second mortgage and home equity loan )Houses without a mortgage: 27
Median household income for houses/condos with a mortgage: $124,493
Median household income for apartments without a mortgage: $153,376
Median monthly housing costs: $2,039
Data:
Median house or condo value ($)
Median house or condo value ($ change since 2000)
Median house or condo value ($) - White
Median house or condo value ($) - Black or African American
Median house or condo value ($) - Asian
Median house or condo value ($) - Hispanic or Latino
Median house or condo value ($) - American Indian and Alaska Native
Median house or condo value ($) - Multirace
Median house or condo value ($) - Other Race
Median price asked for mobile homes ($)
Household density (households per square mile)
Mean house or condo value by units in structure - 1, detached ($)
Mean house or condo value by units in structure - 1, attached ($)
Mean house or condo value by units in structure - 2 ($)
Mean house or condo value by units in structure by units in structure - 3 or 4 ($)
Mean house or condo value by units in structure - 5 or more ($)
Mean house or condo value by units in structure - Boat, RV, van, etc. ($)
Mean house or condo value by units in structure - Mobile home ($)
Median contract rent ($)
Median contract rent - Lower quartile ($)
Median contract rent - Upper quartile ($)
Median gross rent ($)
Urban houses (%)
Rural houses (%)
Houses occupied (%)
Houses occupied (% change since 2000)
Houses owner occupied (%)
Houses owner occupied (% change since 2000)
Houses renter occupied (%)
Houses renter occupied (% change since 2000)
Vacant housing units - For rent (%)
Vacant housing units - For rent (% change since 2000)
Vacant housing units - For sale only (%)
Vacant housing units - For sale only (% change since 2000)
Vacant housing units - Rented or sold, not occupied (%)
Vacant housing units - Rented or sold, not occupied (% change since 2000)
Vacant housing units - For seasonal, recreational, or occasional use (%)
Vacant housing units - For seasonal, recreational, or occasional use (% change since 2000)
Vacant housing units - For migrant workers (%)
Vacant housing units - For migrant workers (% change since 2000)
Vacant housing units - Other vacant (%)
Vacant housing units - Other vacant (% change since 2000)
Median monthly housing costs ($)
Median household income for houses/condos with a mortgage ($)
Median household income for houses/condos without a mortgage ($)
Median household income ($)
Median household income ($) - White
Median household income ($) - Black or African American
Median household income ($) - Asian
Median household income ($) - Hispanic or Latino
Median household income ($) - American Indian and Alaska Native
Median household income ($) - Multirace
Median household income ($) - Other Race
Mortgage status - with mortgage (%)
Mortgage status - with second mortgage (%)
Mortgage status - with home equity loan (%)
Mortgage status - with both second mortgage and home equity loan (%)
Mortgage status - without a mortgage (%)
Median year house/condo built
Median year apartment built
Household type by relationship - Male householder living alone (%)
Household type by relationship - Male householder not living alone (%)
Household type by relationship - Female householder living alone (%)
Household type by relationship - Female householder not living alone (%)
Household type by relationship - Opposite-Sex spouse (%)
Household type by relationship - Same-Sex spouse (%)
Household type by relationship - Opposite-Sex unmarried partner (%)
Household type by relationship - Same-Sex unmarried partner (%)
Household type by relationship - In group quarters (%)
Size of family households - 2-person household (%)
Size of family households - 3-person household (%)
Size of family households - 4-person household (%)
Size of family households - 5-person household (%)
Size of family households - 6-person household (%)
Size of family households - 7-or-more-person household (%)
Size of nonfamily households - 1-person household (%)
Size of nonfamily households - 2-person household (%)
Size of nonfamily households - 3-person household (%)
Size of nonfamily households - 4-person household (%)
Size of nonfamily households - 5-person household (%)
Size of nonfamily households - 6-person household (%)
Size of nonfamily households - 7-or-moreperson household (%)
Year house built - Built 2010 or later (%)
Year house built - Built 2000 to 2009 (%)
Year house built - Built 1990 to 1999 (%)
Year house built - Built 1980 to 1989 (%)
Year house built - Built 1970 to 1979 (%)
Year house built - Built 1960 to 1969 (%)
Year house built - Built 1950 to 1959 (%)
Year house built - Built 1940 to 1949 (%)
Year house built - Built 1939 or earlier (%)
Median number of rooms in houses and condos
Median number of rooms in apartments
Median number of bedrooms in owner occupied houses
Mean number of bedrooms in owner occupied houses
Median number of bedrooms in renter occupied houses
Mean number of bedrooms in renter occupied houses
Median number of vehichles in owner occupied houses
Mean number of vehichles in owner occupied houses
Median number of vehichles in renter occupied houses
Mean number of vehichles in renter occupied houses
Rooms in owner-occupied houses - 1 room (%)
Rooms in owner-occupied houses - 2 rooms (%)
Rooms in owner-occupied houses - 3 rooms (%)
Rooms in owner-occupied houses - 4 rooms (%)
Rooms in owner-occupied houses - 5 rooms (%)
Rooms in owner-occupied houses - 6 rooms (%)
Rooms in owner-occupied houses - 7 rooms (%)
Rooms in owner-occupied houses - 8 rooms (%)
Rooms in owner-occupied houses - 9+ rooms (%)
Rooms in renter-occupied houses - 1 room (%)
Rooms in renter-occupied houses - 2 rooms (%)
Rooms in renter-occupied houses - 3 rooms (%)
Rooms in renter-occupied houses - 4 rooms (%)
Rooms in renter-occupied houses - 5 rooms (%)
Rooms in renter-occupied houses - 6 rooms (%)
Rooms in renter-occupied houses - 7 rooms (%)
Rooms in renter-occupied houses - 8 rooms (%)
Rooms in renter-occupied houses - 9+ rooms (%)
Bedrooms in owner-occupied houses - no bedrooms (%)
Bedrooms in owner-occupied houses - 1 bedroom (%)
Bedrooms in owner-occupied houses - 2 bedrooms (%)
Bedrooms in owner-occupied houses - 3 bedrooms (%)
Bedrooms in owner-occupied houses - 4 bedrooms (%)
Bedrooms in owner-occupied houses - 5+ bedrooms (%)
Bedrooms in renter-occupied houses - no bedrooms (%)
Bedrooms in renter-occupied houses - 1 bedroom (%)
Bedrooms in renter-occupied houses - 2 bedrooms (%)
Bedrooms in renter-occupied houses - 3 bedrooms (%)
Bedrooms in renter-occupied houses - 4 bedrooms (%)
Bedrooms in renter-occupied houses - 5+ bedrooms (%)
Vehicles available in owner-occupied houses - no vehicle available (%)
Vehicles available in owner-occupied houses - 1 vehicle available(%)
Vehicles available in owner-occupied houses - 2 Vehicles available (%)
Vehicles available in owner-occupied houses - 3 Vehicles available (%)
Vehicles available in owner-occupied houses - 4 Vehicles available (%)
Vehicles available in owner-occupied houses - 5+ Vehicles available (%)
Vehicles available in renter-occupied houses - no vehicle available (%)
Vehicles available in renter-occupied houses - 1 vehicle available (%)
Vehicles available in renter-occupied houses - 2 Vehicles available (%)
Vehicles available in renter-occupied houses - 3 Vehicles available (%)
Vehicles available in renter-occupied houses - 4 Vehicles available (%)
Vehicles available in renter-occupied houses - 5+ Vehicles available (%)
Housing units in structures - 1, detached (%)
Housing units in structures - 1, attached (%)
Housing units in structures - 2 (%)
Housing units in structures - 3 or 4 (%)
Housing units in structures - 5 to 9 (%)
Housing units in structures - 10 to 19 (%)
Housing units in structures - 20 to 49 (%)
Housing units in structures - 50 or more (%)
Housing units in structures - Mobile home (%)
Housing units in structures - Boat, RV, van, etc. (%)
Housing units in structures - Owners - 1, detached (%)
Housing units in structures - Owners - 1, attached (%)
Housing units in structures - Owners - 2 (%)
Housing units in structures - Owners - 3 or 4 (%)
Housing units in structures - Owners - 5 to 9 (%)
Housing units in structures - Owners - 10 to 19 (%)
Housing units in structures - Owners - 20 to 49 (%)
Housing units in structures - Owners - 50 or more (%)
Housing units in structures - Owners - Mobile home (%)
Housing units in structures - Owners - Boat, RV, van, etc. (%)
Housing units in structures - Renters - 1, detached (%)
Housing units in structures - Renters - 1, attached (%)
Housing units in structures - Renters - 2 (%)
Housing units in structures - Renters - 3 or 4 (%)
Housing units in structures - Renters - 5 to 9 (%)
Housing units in structures - Renters - 10 to 19 (%)
Housing units in structures - Renters - 20 to 49 (%)
Housing units in structures - Renters - 50 or more (%)
Housing units in structures - Renters - Mobile home (%)
Housing units in structures - Renters - Boat, RV, van, etc. (%)
House/condo owner moved in on average (years ago)
Renter moved in on average (years ago)
Year householder moved into unit - Moved in 1999 to March 2000 (%)
Year householder moved into unit - Moved in 1999 to March 2000 (%) - White
Year householder moved into unit - Moved in 1999 to March 2000 (%) - Black or African American
Year householder moved into unit - Moved in 1999 to March 2000 (%) - Asian
Year householder moved into unit - Moved in 1999 to March 2000 (%) - Hispanic or Latino
Year householder moved into unit - Moved in 1999 to March 2000 (%) - American Indian and Alaska Native
Year householder moved into unit - Moved in 1999 to March 2000 (%) - Multirace
Year householder moved into unit - Moved in 1999 to March 2000 (%) - Other Race
Year householder moved into unit - Moved in 1995 to 1998 (%)
Year householder moved into unit - Moved in 1995 to 1998 (%) - White
Year householder moved into unit - Moved in 1995 to 1998 (%) - Black or African American
Year householder moved into unit - Moved in 1995 to 1998 (%) - Asian
Year householder moved into unit - Moved in 1995 to 1998 (%) - Hispanic or Latino
Year householder moved into unit - Moved in 1995 to 1998 (%) - American Indian and Alaska Native
Year householder moved into unit - Moved in 1995 to 1998 (%) - Multirace
Year householder moved into unit - Moved in 1995 to 1998 (%) - Other Race
Year householder moved into unit - Moved in 1990 to 1994 (%)
Year householder moved into unit - Moved in 1990 to 1994 (%) - White
Year householder moved into unit - Moved in 1990 to 1994 (%) - Black or African American
Year householder moved into unit - Moved in 1990 to 1994 (%) - Asian
Year householder moved into unit - Moved in 1990 to 1994 (%) - Hispanic or Latino
Year householder moved into unit - Moved in 1990 to 1994 (%) - American Indian and Alaska Native
Year householder moved into unit - Moved in 1990 to 1994 (%) - Multirace
Year householder moved into unit - Moved in 1990 to 1994 (%) - Other Race
Year householder moved into unit - Moved in 1980 to 1989 (%)
Year householder moved into unit - Moved in 1980 to 1989 (%) - White
Year householder moved into unit - Moved in 1980 to 1989 (%) - Black or African American
Year householder moved into unit - Moved in 1980 to 1989 (%) - Asian
Year householder moved into unit - Moved in 1980 to 1989 (%) - Hispanic or Latino
Year householder moved into unit - Moved in 1980 to 1989 (%) - American Indian and Alaska Native
Year householder moved into unit - Moved in 1980 to 1989 (%) - Multirace
Year householder moved into unit - Moved in 1980 to 1989 (%) - Other Race
Year householder moved into unit - Moved in 1970 to 1979 (%)
Year householder moved into unit - Moved in 1970 to 1979 (%) - White
Year householder moved into unit - Moved in 1970 to 1979 (%) - Black or African American
Year householder moved into unit - Moved in 1970 to 1979 (%) - Asian
Year householder moved into unit - Moved in 1970 to 1979 (%) - Hispanic or Latino
Year householder moved into unit - Moved in 1970 to 1979 (%) - American Indian and Alaska Native
Year householder moved into unit - Moved in 1970 to 1979 (%) - Multirace
Year householder moved into unit - Moved in 1970 to 1979 (%) - Other Race
Year householder moved into unit - Moved in 1969 or earlier (%)
Year householder moved into unit - Moved in 1969 or earlier (%) - White
Year householder moved into unit - Moved in 1969 or earlier (%) - Black or African American
Year householder moved into unit - Moved in 1969 or earlier (%) - Asian
Year householder moved into unit - Moved in 1969 or earlier (%) - Hispanic or Latino
Year householder moved into unit - Moved in 1969 or earlier (%) - American Indian and Alaska Native
Year householder moved into unit - Moved in 1969 or earlier (%) - Multirace
Year householder moved into unit - Moved in 1969 or earlier (%) - Other Race
Housing units lacking complete plumbing facilities (%)
Housing units lacking complete kitchen facilities (%)
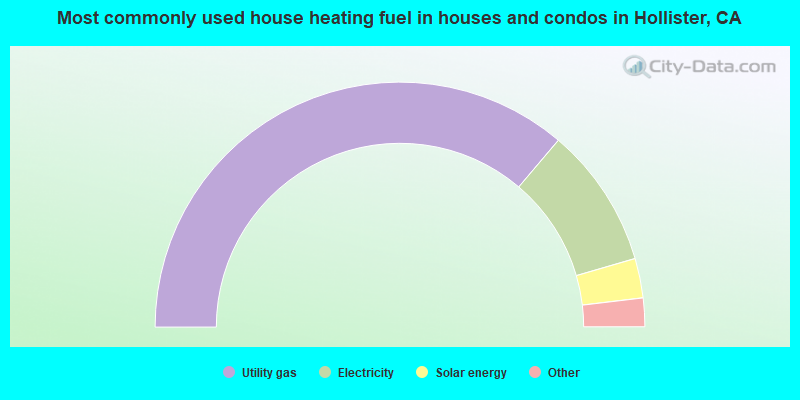
House heating fuel used in houses and condos - Utility gas (%)
House heating fuel used in houses and condos - Bottled, tank, or LP gas (%)
House heating fuel used in houses and condos - Electricity (%)
House heating fuel used in houses and condos - Fuel oil, kerosene, etc. (%)
House heating fuel used in houses and condos - Coal or coke (%)
House heating fuel used in houses and condos - Wood (%)
House heating fuel used in houses and condos - Solar energy (%)
House heating fuel used in houses and condos - Other fuel (%)
House heating fuel used in houses and condos - No fuel used (%)
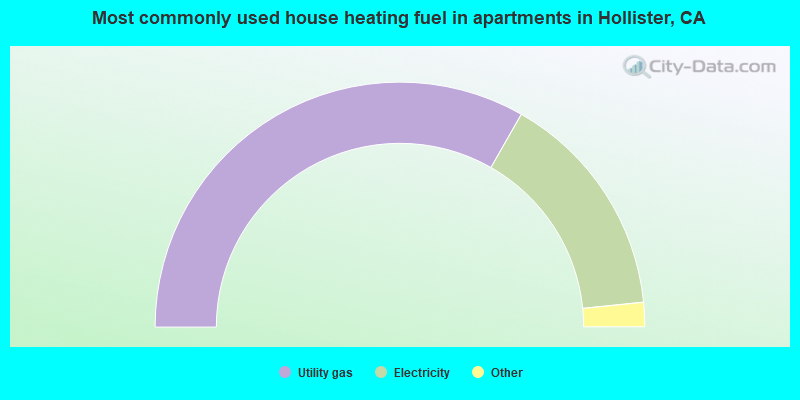
House heating fuel used in apartments - Utility gas (%)
House heating fuel used in apartments - Bottled, tank, or LP gas (%)
House heating fuel used in apartments - Electricity (%)
House heating fuel used in apartments - Fuel oil, kerosene, etc. (%)
House heating fuel used in apartments - Coal or coke (%)
House heating fuel used in apartments - Wood (%)
House heating fuel used in apartments - Solar energy (%)
House heating fuel used in apartments - Other fuel (%)
House heating fuel used in apartments - No fuel used (%)
Latest news about housing in Hollister, CA collected exclusively by city-data.com from local newspapers, TV, and radio stations
Median year house/condo built: 1995Median year apartment built: 1977Household type by relationship:
Households: 43,930
Male householders: 6,055 (846 living alone ), Female householders: 6,698 (1,074 living alone )6,967 spouses (6,913 opposite-sex spouses ), 992 unmarried partners , (992 opposite-sex unmarried partners ), 17,159 children (15,863 natural , 293 adopted , 1,002 stepchildren ), 1,170 grandchildren , 719 brothers or sisters , 604 parents , 103 foster children , 1,525 other relatives , 1,757 non-relatives In group quarters: 176
Size of family households: 1,997 2-persons , 2,531 3-persons , 3,105 4-persons , 1,141 5-persons , 606 6-persons , 278 7-or-more-persons .
Size of nonfamily households: 1,931 1-person , 589 2-persons , 114 4-persons , 10 6-persons , 17 7-or-more-persons .
7,031 married couples with children. single-parent households (1,684 men , 2,185 women ).
51.9% of residents of Hollister speak English at home. of residents speak Spanish at home (60% speak English very well , 17% speak English well , 17% speak English not well , 7% don't speak English at all ).of residents speak other Indo-European language at home (74% speak English very well , 18% speak English well , 5% speak English not well , 3% don't speak English at all ).of residents speak Asian or Pacific Island language at home (66% speak English very well , 31% speak English well , 3% speak English not well ).of residents speak other language at home (11% speak English very well , 76% speak English well , 12% speak English not well ).
Foreign born population: 9,156 (20.8%)of them are naturalized citizens )
Median number of rooms in houses and condos:
Median number of rooms in apartments
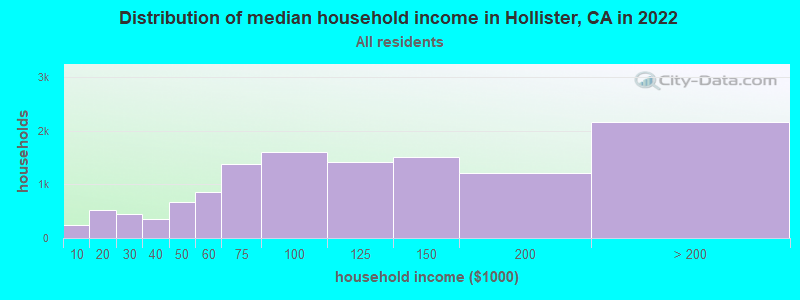
Hollister, CA household income distribution 237 Less than $10,000527 $10,000 to $19,999440 $20,000 to $29,999362 $30,000 to $39,999666 $40,000 to $49,999863 $50,000 to $59,9991,374 $60,000 to $74,9991,604 $75,000 to $99,9991,415 $100,000 to $124,9991,514 $125,000 to $149,9991,217 $150,000 to $199,9992,162 $200,000 or more
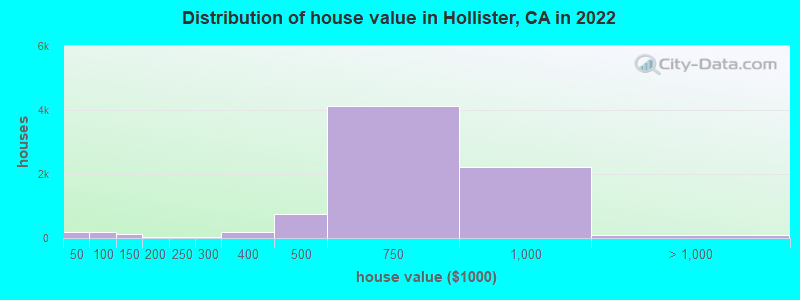
Home value of owner - occupied houses in 2022 in Hollister, CA 130 Less than $10,00017 $25,000 to $29,99936 $40,000 to $49,99949 $50,000 to $59,99916 $60,000 to $69,99943 $70,000 to $79,99927 $80,000 to $89,9996 $90,000 to $99,999110 $100,000 to $124,99917 $125,000 to $149,99926 $175,000 to $199,99919 $200,000 to $249,99916 $250,000 to $299,999171 $300,000 to $399,999755 $400,000 to $499,9994,128 $500,000 to $749,9992,205 $750,000 to $999,99947 $1,000,000 to $1,499,99911 $1,500,000 to $1,999,99929 $2,000,000 or moreRent paid by renters in 2022 in Hollister, CA 9 Less than $10012 $100 to $14978 $200 to $249121 $250 to $29933 $300 to $3497 $350 to $39914 $400 to $44920 $450 to $499142 $500 to $5495 $550 to $59995 $600 to $64972 $650 to $699101 $700 to $74922 $750 to $799203 $800 to $899170 $900 to $999336 $1,000 to $1,249470 $1,250 to $1,4991,498 $1,500 to $1,999709 $2,000 to $2,499424 $2,500 to $2,99946 $3,000 to $3,49957 $3,500 or more43 No cash rent
Percentage of workers working in this county: 54.5%Number of people working at home: 1,726 (8.7% of all workers )
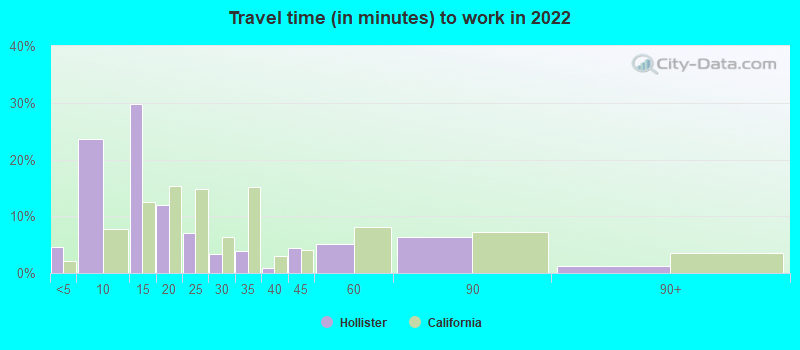
Travel time to work (commute)
Less than 5 minutes: 4345 to 9 minutes: 2,45710 to 14 minutes: 3,16215 to 19 minutes: 1,59220 to 24 minutes: 82725 to 29 minutes: 73130 to 34 minutes: 1,69735 to 39 minutes: 27840 to 44 minutes: 57245 to 59 minutes: 2,24360 to 89 minutes: 3,48790 or more minutes: 1,205
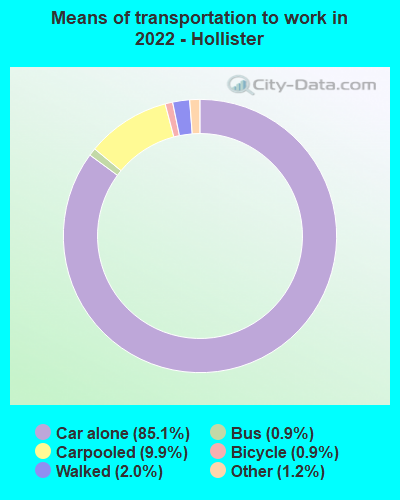
Means of transportation to work:
Drove a car alone: 7,801 (71.2%)Carpooled: 974 (8.9%)Bus : 66 (0.6%)Taxi: 118 (1.1%)Bicycle: 88 (0.8%)Walked: 198 (1.8%)Worked at home: 1,726 (15.8%)
Unemployment by race in 2022
Unemployment rate for White non-Hispanic residents 3.7% Males1.9% FemalesUnemployment rate for American Indian and Alaska Native residents 10.3% Males2.0% FemalesUnemployment rate for Asian residents 1.8% Males3.9% FemalesUnemployment rate for other race residents 9.4% Males2.7% FemalesUnemployment rate for two or more race residents 3.1% Males4.1% FemalesUnemployment rate for Hispanic or Latino residents 4.6% Males3.4% Females
Year of entry for the foreign-born population in Hollister, California
750 2010 or later 2,499 2000 to 2009 2,006 1990 to 1999 1,786 1980 to 1989 1,187 1970 to 1979 1,218 Before 1970
First ancestries reported:
American: 741 (3.1%)
Italian: 500 (2.1%)
Irish: 486 (2.0%)
English: 431 (1.8%)
German: 335 (1.4%)
European: 315 (1.3%)
Portuguese: 155 (0.6%)
Dutch: 83 (0.3%)
Scottish: 82 (0.3%)
Norwegian: 78 (0.3%)
Polish: 77 (0.3%)
Egyptian: 75 (0.3%)
Russian: 33 (0.1%)
French Canadian: 32 (0.1%)
British: 25 (0.1%)
Swedish: 19 (0.08%)
Lebanese: 17 (0.07%)
French: 14 (0.06%)
Scotch-Irish: 14 (0.06%)
Kenyan: 11 (0.05%)
Scandinavian: 9 (0.04%)
Cape Verdean: 9 (0.04%)
Ukrainian: 6 (0.02%)
Danish: 5 (0.02%)
Lithuanian: 5 (0.02%)
Croatian: 4 (0.02%)
Maltese: 4 (0.02%)
Yugoslavian: 4 (0.02%)
African: 3 (0.01%)
Jamaican: 2 (0.01%) Most common places of birth for foreign-born residents (%): Mexico Hollister:
78.4% (6,926)California:
37.2% (3,881,193)
Philippines Hollister:
6.0% (531)California:
7.8% (818,297)
Place of birth for U.S.-born residents:
This state: 30,427Other state: 3,400Northeast: 207Midwest: 625South: 1,281West: 1,431 90.2% of Hollister residents lived in the same house 1 years ago.
Out of people who lived in different houses, 27.7% lived in this county.
Out of people who lived in different counties, 94.7% lived in California.
Hollister:
90.2%State average:
88.9%
Education attainment for males 25 years and older:
No schooling: 487Nursery to 4th grade: 1635th and 6th grade: 8327th and 8th grade: 3019th grade: 16110th grade: 2911th grade: 24012th grade, no diploma: 812High school graduate (or equivalency): 3,931Less than 1 year of college: 902Some college more than 1 year, no degree: 1,446Associate degree: 1,543Bachelor's degree: 1,957Master's degree: 495Professional school degree: 110Doctorate degree: 78
Education attainment for females 25 years and older:
No schooling: 419Nursery to 4th grade: 2355th and 6th grade: 1,0057th and 8th grade: 2189th grade: 14210th grade: 14911th grade: 19812th grade, no diploma: 322High school graduate (or equivalency): 2,724Less than 1 year of college: 731Some college more than 1 year, no degree: 2,589Associate degree: 1,881Bachelor's degree: 2,166Master's degree: 827Professional school degree: 64Doctorate degree: 8
Housing units in structures:
One, detached: 10,387One, attached: 346Two: 2803 or 4: 8655 to 9: 43310 to 19: 16720 to 49: 21250 or more: 50Mobile homes: 200Median worth of mobile homes: $104,327
Housing units lacking complete plumbing facilities in 2022: 0.6%Housing units lacking complete kitchen facilities in 2022: 0.8%House/condo owner moved in on average 10 years ago
Renter moved in on average 4 years ago
Private vs. public school enrollment:
Students in private schools in grades 1 to 8 (elementary and middle school): 67 Here:
1.3%California:
10.5%
Students in private schools in grades 9 to 12 (high school): 48 Students in private undergraduate colleges: 154 Here:
6.8%California:
15.9%