Housing density: 2,494 houses/condos per square mile
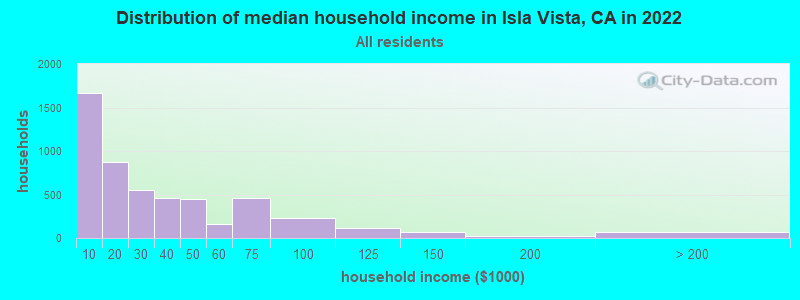
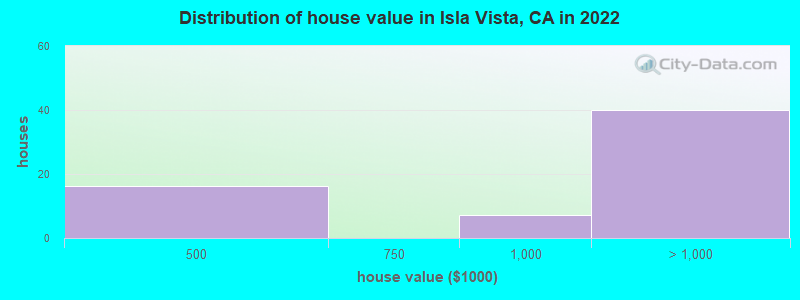
Median price asked for vacant for-sale houses and condos in 2022 in this county: $300,986.
Median contract rent in 2022: $1,830 (lower quartile is $1,472, upper quartile is over $2,000)
Median rent asked for vacant for-rent units in 2022: $2,626
Median gross rent in Isla Vista, CA in 2022: $1,861
Housing units in Isla Vista with a mortgage: 34 (13 second mortgage, 0 home equity loan, 13 both second mortgage and home equity loan) Houses without a mortgage: 0
98 married couples with children.
135 single-parent households (74 men, 61 women).
72.6% of residents of Isla Vista speak English at home.
11.1% of residents speak Spanish at home (88% speak English very well, 5% speak English well, 7% speak English not well).
4.8% of residents speak other Indo-European language at home (94% speak English very well, 1% speak English well, 5% speak English not well).
10.4% of residents speak Asian or Pacific Island language at home (76% speak English very well, 18% speak English well, 6% speak English not well).
1.1% of residents speak other language at home (78% speak English very well, 8% speak English well, 14% speak English not well).
Foreign born population: 1,908 (13.0%)
(18.8% of them are naturalized citizens)
Percentage of workers working in this county: 96.1% Number of people working at home: 587 (8.9% of all workers)
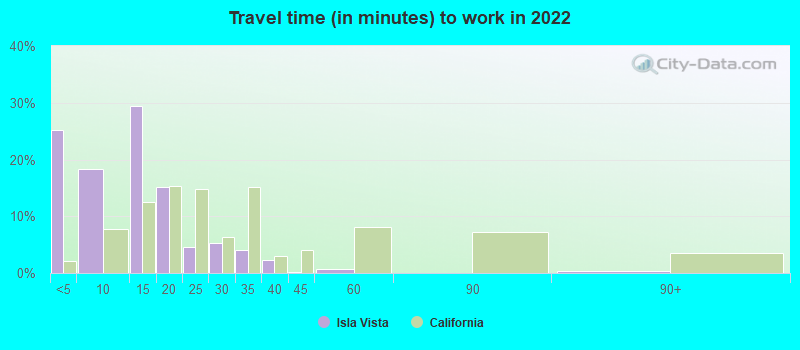
Travel time to work (commute)
Less than 5 minutes: 472
5 to 9 minutes: 812
10 to 14 minutes: 1,959
15 to 19 minutes: 1,410
20 to 24 minutes: 469
25 to 29 minutes: 398
30 to 34 minutes: 285
35 to 39 minutes: 51
40 to 44 minutes: 63
45 to 59 minutes: 22
60 to 89 minutes: 102
90 or more minutes: 44
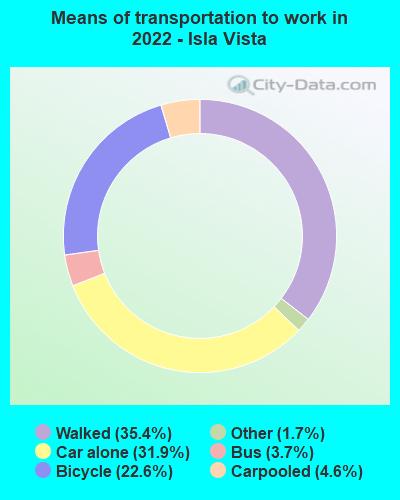
Means of transportation to work:
Drove a car alone: 510 (23.5%)
Carpooled: 68 (3.1%)
Bus: 64 (2.9%)
Taxi: 43 (2.0%)
Bicycle: 423 (19.5%)
Walked: 862 (39.7%)
Worked at home: 587 (27.0%)
Unemployment by race in 2022
Unemployment rate for White non-Hispanic residents
6.8%Males
24.9%Females
Unemployment rate for Black residents
34.9%Females
Unemployment rate for Asian residents
4.9%Males
4.1%Females
Unemployment rate for other race residents
14.6%Males
2.7%Females
Unemployment rate for two or more race residents
6.0%Males
37.5%Females
Unemployment rate for Hispanic or Latino residents
9.2%Males
9.7%Females
Year of entry for the foreign-born population in Isla Vista, California
1,1852010 or later
5652000 to 2009
2101990 to 1999
1,3471980 to 1989
1181970 to 1979
66Before 1970
First ancestries reported:
English: 436 (6.4%)
Italian: 345 (5.0%)
European: 258 (3.8%)
American: 218 (3.2%)
German: 184 (2.7%)
Swedish: 182 (2.7%)
Irish: 162 (2.4%)
Iranian: 141 (2.1%)
Armenian: 113 (1.7%)
Norwegian: 104 (1.5%)
Dutch: 79 (1.2%)
Ethiopian: 78 (1.1%)
Egyptian: 64 (0.9%)
British: 52 (0.8%)
Polish: 49 (0.7%)
Australian: 37 (0.5%)
Serbian: 37 (0.5%)
Canadian: 35 (0.5%)
French: 33 (0.5%)
Swiss: 33 (0.5%)
Yugoslavian: 32 (0.5%)
Russian: 31 (0.5%)
Northern European: 29 (0.4%)
Portuguese: 27 (0.4%)
Danish: 21 (0.3%)
Scottish: 21 (0.3%)
Greek: 16 (0.2%)
Czech: 12 (0.2%)
Lebanese: 11 (0.2%)
Israeli: 10 (0.1%)
Latvian: 7 (0.1%)
Scandinavian: 5 (0.07%)
Syrian: 2 (0.03%)
Brazilian: 2 (0.03%)
Slavic: 2 (0.03%)
Most common places of birth for foreign-born residents (%):
China, excluding Hong Kong and Taiwan
Isla Vista:
28.2% (567)
California:
6.6% (684,672)
Mexico
Isla Vista:
14.1% (283)
California:
37.2% (3,881,193)
Philippines
Isla Vista:
7.2% (145)
California:
7.8% (818,297)
Korea
Isla Vista:
6.4% (129)
California:
3.0% (315,248)
India
Isla Vista:
3.7% (74)
California:
5.2% (539,184)
Japan
Isla Vista:
3.5% (71)
California:
1.0% (103,575)
Italy
Isla Vista:
3.1% (63)
California:
0.3% (31,439)
El Salvador
Isla Vista:
2.5% (50)
California:
4.2% (440,287)
England
Isla Vista:
2.4% (48)
California:
0.6% (57,953)
Taiwan
Isla Vista:
2.2% (45)
California:
1.7% (176,274)
Egypt
Isla Vista:
2.1% (42)
California:
0.4% (42,718)
Argentina
Isla Vista:
2.0% (40)
California:
0.3% (33,960)
Jamaica
Isla Vista:
1.9% (39)
California:
0.2% (15,939)
Armenia
Isla Vista:
1.9% (39)
California:
0.8% (78,847)
Bangladesh
Isla Vista:
1.9% (38)
California:
0.2% (18,366)
Guatemala
Isla Vista:
1.8% (37)
California:
2.8% (290,436)
Norway
Isla Vista:
1.8% (36)
California:
0.0% (3,677)
Israel
Isla Vista:
1.6% (32)
California:
0.3% (33,029)
Place of birth for U.S.-born residents:
This state: 10,401
Other state: 2,232
Northeast: 414
Midwest: 555
South: 542
West: 750
25.3% of Isla Vista residents lived in the same house 1 years ago. Out of people who lived in different houses, 35.4% lived in this county. Out of people who lived in different counties, 92.6% lived in California.
Isla Vista:
25.3%
State average:
88.9%
Education attainment for males 25 years and older:
No schooling: 13
Nursery to 4th grade: 7
5th and 6th grade: 0
7th and 8th grade: 8
9th grade: 23
10th grade: 5
11th grade: 0
12th grade, no diploma: 46
High school graduate (or equivalency): 224
Less than 1 year of college: 81
Some college more than 1 year, no degree: 217
Associate degree: 56
Bachelor's degree: 248
Master's degree: 166
Professional school degree: 31
Doctorate degree: 85
Education attainment for females 25 years and older:
No schooling: 8
Nursery to 4th grade: 0
5th and 6th grade: 12
7th and 8th grade: 0
9th grade: 3
10th grade: 0
11th grade: 0
12th grade, no diploma: 69
High school graduate (or equivalency): 18
Less than 1 year of college: 36
Some college more than 1 year, no degree: 88
Associate degree: 8
Bachelor's degree: 157
Master's degree: 123
Professional school degree: 8
Doctorate degree: 31
Housing units in structures:
One, detached: 286
One, attached: 182
Two: 565
3 or 4: 604
5 to 9: 953
10 to 19: 835
20 to 49: 609
50 or more: 1,259
Housing units lacking complete plumbing facilities in 2022: 0.7%
Housing units lacking complete kitchen facilities in 2022: 6.6%
House/condo owner moved in on average 10 years ago