Monroe, NY (New York) Houses and Residents
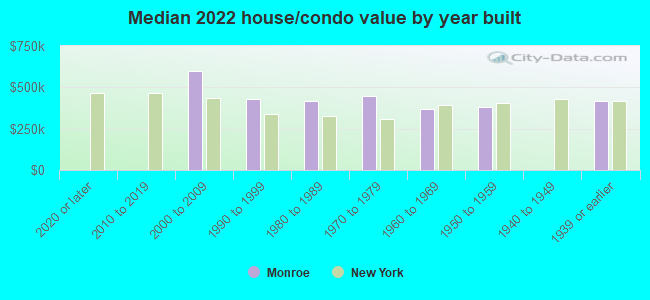
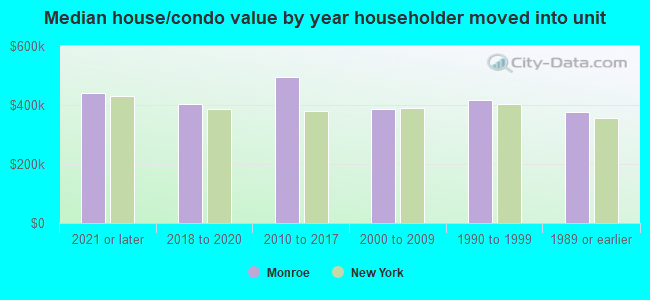
| Monroe: | $415,492 |
| New York: | $400,400 |
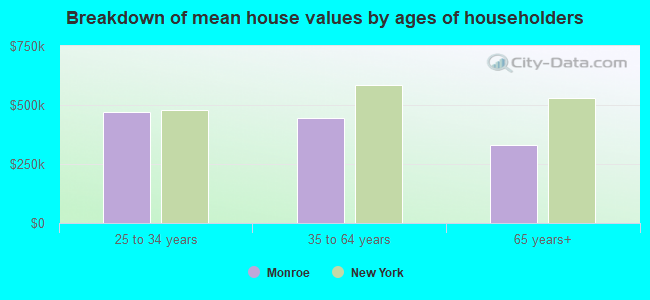
Mean price in 2022:
Detached houses: $435,132
Here: $435,132 State: $476,719 Townhouses or other attached units: $260,073
Here: $260,073 State: $699,270 In 3-to-4-unit structures: $266,556
Here: $266,556 State: $764,568 In 5-or-more-unit structures: $207,455
Here: $207,455 State: $912,009
Total population: 8,562 (Urban population: 7,798, Rural population: 0)
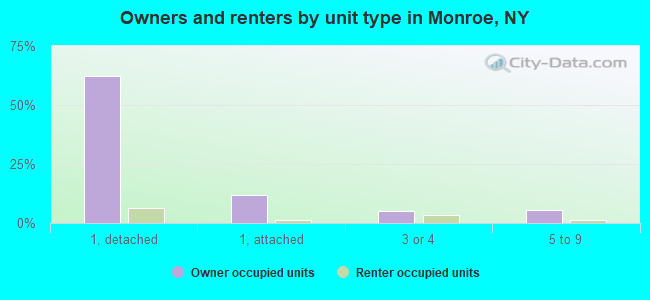
Houses: 3,051 (2,913 occupied: 2,477 owner occupied, 479 renter occupied)
| % of renters here: | 16% |
| State: | 46% |
Housing density: 890 houses/condos per square mile
Median price asked for vacant for-sale houses and condos in 2022 in this county: $283,793.
Median contract rent in 2022: $1,483 (lower quartile is $1,300, upper quartile is $1,703)
Median rent asked for vacant for-rent units in 2022: $9,580
Median gross rent in Monroe, NY in 2022: $1,704
Housing units in Monroe with a mortgage: 1,649 (88 second mortgage, 0 home equity loan, 90 both second mortgage and home equity loan)
Houses without a mortgage: 18
Median household income for houses/condos with a mortgage: $141,620
Median household income for apartments without a mortgage: $112,704
Median monthly housing costs: $2,220
Compare current foreclosures in Monroe, NY:
| Photo | Address | Area | Beds / Baths | Price | Details |
|---|---|---|---|---|---|

|
#1
San Antonio Cir
Monroe, NY 10950
|
960 sq. feet
|
1 baths 3 beds |
show details | |

|
#2
Round Lake Ave
Monroe, NY 10950
|
1,356 sq. feet
|
2 baths 3 beds |
show details | |

|
#3
Woodycrest Trl
Monroe, NY 10950
|
909 sq. feet
|
1 baths 3 beds |
show details | |

|
#4
Bramley Ct
Monroe, NY 10950
|
1,215 sq. feet
|
3 baths 2 beds |
show details | |

|
#5
Block Aly
Monroe, NY 10950
|
802 sq. feet
|
2 baths 2 beds |
show details | |

|
#6
Aldo Ct
Monroe, NY 10950
|
1,160 sq. feet
|
2 baths 2 beds |
show details | |

|
#7
Old Town Rd
Monroe, NY 10950
|
1,974 sq. feet
|
3 baths 4 beds |
show details | |

|
#8
Seven Springs Rd
Monroe, NY 10950
|
1,860 sq. feet
|
3 baths 5 beds |
show details | |

|
#9
Hidden Creek Blvd
Monroe, NY 10950
|
1,777 sq. feet
|
3 baths 2 beds |
show details | |

|
#10
Mountain Laurel Dr
Monroe, NY 10950
|
1,240 sq. feet
|
2 baths 2 beds |
show details |
| Photo | Address | Area | Beds / Baths | Price | Details |
|---|---|---|---|---|---|

|
#11
Paradise Trl
Monroe, NY 10950
|
1,479 sq. feet
|
1 baths 3 beds |
show details | |

|
#12
Sylvan Trl
Monroe, NY 10950
|
820 sq. feet
|
1 baths 2 beds |
show details | |

|
#13
Oakland Ave
Monroe, NY 10950
|
3,392 sq. feet
|
4 baths 5 beds |
show details | |

|
#14
Kennedy Dr
Monroe, NY 10950
|
849 sq. feet
|
2 baths 2 beds |
show details | |

|
#15
Virginia Ave
Monroe, NY 10950
|
3,150 sq. feet
|
3 baths 4 beds |
show details | |

|
#16
San Antonio Cir
Monroe, NY 10950
|
2,100 sq. feet
|
2 baths 4 beds |
show details | |

|
#17
Lakes Rd
Monroe, NY 10950
|
3,208 sq. feet
|
3 baths 3 beds |
show details | |

|
#18
Midway Dr
Monroe, NY 10950
|
2,037 sq. feet
|
2 baths 3 beds |
show details | |

|
#19
Eagle St
Monroe, NY 10950
|
1,740 sq. feet
|
2 baths 3 beds |
show details | |

|
#20
Lake Region Blvd
Monroe, NY 10950
|
1,682 sq. feet
|
2 baths 3 beds |
show details |
| Photo | Address | Area | Beds / Baths | Price | Details |
|---|---|---|---|---|---|

|
#21
Dorothy Dr
Monroe, NY 10950
|
1,360 sq. feet
|
2 baths 3 beds |
show details | |

|
#22
Pickerel Rd
Monroe, NY 10950
|
2,092 sq. feet
|
1 baths 2 beds |
show details | |

|
#23
Ford Ct
Monroe, NY 10950
|
1,976 sq. feet
|
3 baths 3 beds |
show details | |

|
#24
Orange Tpke
Monroe, NY 10950
|
5,172 sq. feet
|
3 baths 4 beds |
show details | |

|
#25
Seven Springs Mountain Rd
Monroe, NY 10950
|
5,135 sq. feet
|
5 baths 6 beds |
show details | |

|
#26
Carriage Hill Ct
Monroe, NY 10950
|
2,684 sq. feet
|
3 baths 4 beds |
show details | |

|
#27
Mine Rd
Monroe, NY 10950
|
2,633 sq. feet
|
4 baths 4 beds |
show details | |

|
#28
Pennsylvania Ave
Monroe, NY 10950
|
2,138 sq. feet
|
3 baths 3 beds |
show details | |

|
#29
Berry Rd
Monroe, NY 10950
|
1,862 sq. feet
|
3 baths 3 beds |
show details | |

|
#30
Hawthorne Dr
Monroe, NY 10950
|
1,848 sq. feet
|
3 baths 3 beds |
show details |
| Photo | Address | Area | Beds / Baths | Price | Details |
|---|---|---|---|---|---|

|
#31
Poplar Trl
Monroe, NY 10950
|
1,521 sq. feet
|
2 baths 4 beds |
show details | |

|
#32
Windsor Rd
Monroe, NY 10950
|
1,170 sq. feet
|
2 baths 3 beds |
show details | |

|
#33
Old Quaker Hill Rd
Monroe, NY 10950
|
2,266 sq. feet
|
3 baths 3 beds |
show details | |

|
#34
Heritage Ln
Monroe, NY 10950
|
1,376 sq. feet
|
2 baths 3 beds |
show details | |

|
#35
Windsor Rd
Monroe, NY 10950
|
1,243 sq. feet
|
1 baths 3 beds |
show details | |

|
#36
Schunnemunk Rd
Monroe, NY 10950
|
2,872 sq. feet
|
3 baths 4 beds |
show details | |

|
#37
Lizensk Blvd
Monroe, NY 10950
|
1,345 sq. feet
|
2 baths 3 beds |
show details | |

|
#38
Mountain Rd
Monroe, NY 10950
|
5,460 sq. feet
|
8 baths 11 beds |
show details | |

|
#39
Raywood Dr
Monroe, NY 10950
|
5,776 sq. feet
|
3 baths 4 beds |
show details | |

|
#40
Stainton Fareway
Monroe, NY 10950
|
2,407 sq. feet
|
3 baths 3 beds |
show details |
| Photo | Address | Area | Beds / Baths | Price | Details |
|---|---|---|---|---|---|

|
#41
Toltchav Way Unit 203
Monroe, NY 10950
|
1,948 sq. feet
|
3 baths 5 beds |
show details | |

|
#42
Crestwood Trl
Monroe, NY 10950
|
1,520 sq. feet
|
2 baths 3 beds |
show details | |

|
#43
Prestwick Dr
Monroe, NY 10950
|
2,932 sq. feet
|
3 baths 4 beds |
show details | |

|
#44
Dara Ct
Monroe, NY 10950
|
5,387 sq. feet
|
4 baths 8 beds |
show details | |

|
#45
Cooper Dr
Monroe, NY 10950
|
1,136 sq. feet
|
1 baths 3 beds |
show details | |

|
#46
Stage Rd # 2
Monroe, NY 10950
|
970 sq. feet
|
1 baths 2 beds |
show details | |

|
#47
Franklin Ave
Monroe, NY 10950
|
1,124 sq. feet
|
2 baths 2 beds |
show details | |

|
#48
Edgewood Trl
Monroe, NY 10950
|
916 sq. feet
|
1 baths 3 beds |
show details | |

|
#49
Hillside Ter
Monroe, NY 10950
|
1,160 sq. feet
|
1 baths 3 beds |
show details | |

|
Check over 1 million property listings on Foreclosure.com!
|
browse all offers | |||

Latest news about housing in Monroe, NY collected exclusively by city-data.com from local newspapers, TV, and radio stations


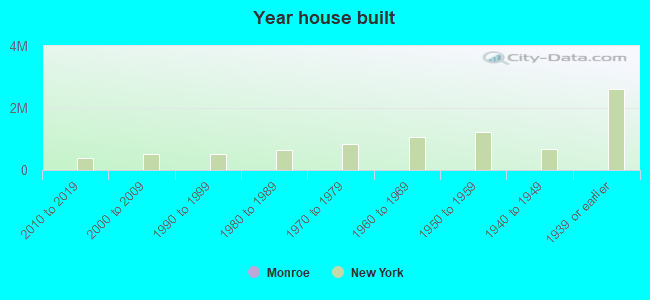
Median year apartment built: 1958
Household type by relationship:
Households: 9,530- Male householders: 1,398 (107 living alone), Female householders: 1,495 (260 living alone)
1,788 spouses (1,751 opposite-sex spouses), 210 unmarried partners, (198 opposite-sex unmarried partners), 3,805 children (3,600 natural, 0 adopted, 204 stepchildren), 234 grandchildren, 88 brothers or sisters, 96 parents, 0 foster children, 106 other relatives, 276 non-relatives
- In group quarters: 31
Size of family households: 679 2-persons, 565 3-persons, 620 4-persons, 289 5-persons, 216 6-persons, 53 7-or-more-persons.
Size of nonfamily households: 370 1-person, 111 2-persons, 18 3-persons.
1,513 married couples with children.
444 single-parent households (262 men, 182 women).
59.3% of residents of Monroe speak English at home.
22.5% of residents speak Spanish at home (60% speak English very well, 19% speak English well, 6% speak English not well, 16% don't speak English at all).
15.0% of residents speak other Indo-European language at home (60% speak English very well, 17% speak English well, 20% speak English not well, 2% don't speak English at all).
0.9% of residents speak Asian or Pacific Island language at home (64% speak English very well, 36% speak English well).
4.8% of residents speak other language at home (68% speak English very well, 13% speak English well, 19% speak English not well).
Foreign born population: 2,052 (21.5%)
(51.0% of them are naturalized citizens)
| Here: | 6.5 |
| State: | 6.3 |
| Here: | 4.7 |
| State: | 3.8 |
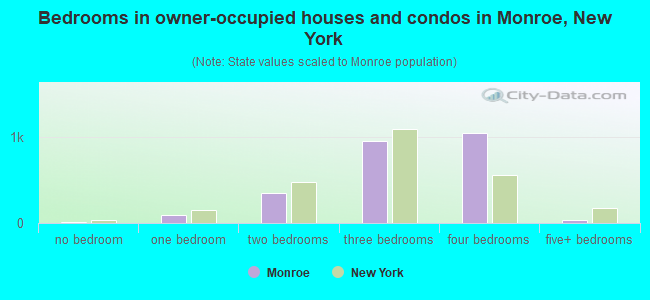
- Bedrooms in owner-occupied houses and condos in Monroe, New York
- 17no bedroom
- 891 bedroom
- 3512 bedrooms
- 9463 bedrooms
- 1,0454 bedrooms
- 315+ bedrooms
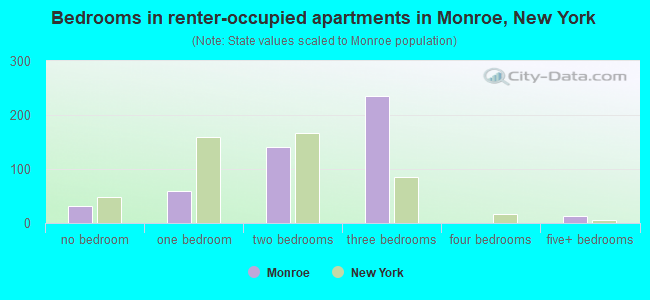
- Bedrooms in renter-occupied apartments in Monroe, New York
- 32no bedroom
- 591 bedroom
- 1412 bedrooms
- 2353 bedrooms
- 04 bedrooms
- 135+ bedrooms
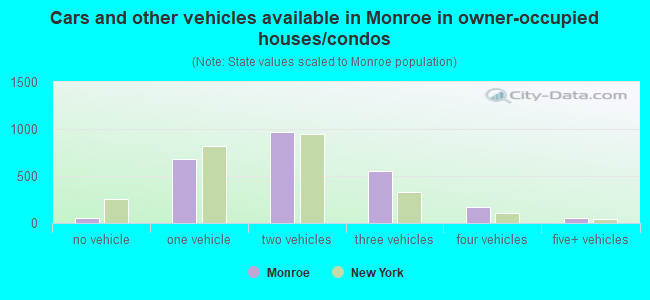
- Cars and other vehicles available in Monroe in owner-occupied houses/condos
- 51no vehicle
- 6831 vehicle
- 9702 vehicles
- 5493 vehicles
- 1684 vehicles
- 585+ vehicles
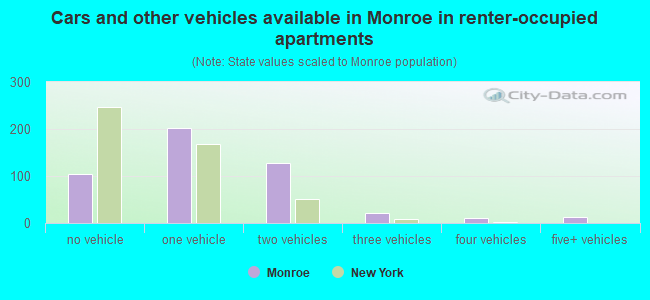
- Cars and other vehicles available in Monroe in renter-occupied apartments
- 105no vehicle
- 2031 vehicle
- 1272 vehicles
- 213 vehicles
- 104 vehicles
- 135+ vehicles
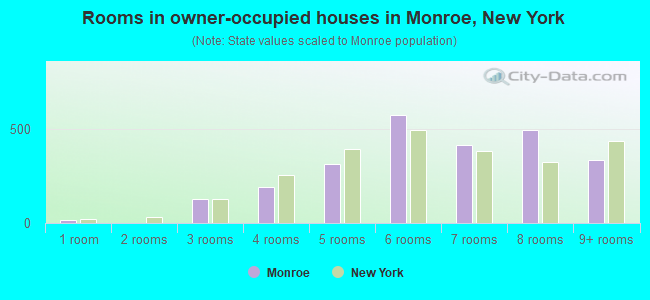
- Rooms in owner-occupied houses in Monroe, New York
- 171 room
- 02 rooms
- 1303 rooms
- 1924 rooms
- 3155 rooms
- 5766 rooms
- 4147 rooms
- 4978 rooms
- 3369+ rooms
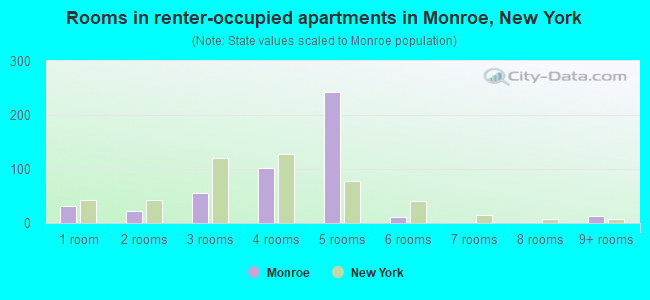
- Rooms in renter-occupied apartments in Monroe, New York
- 321 room
- 222 rooms
- 563 rooms
- 1024 rooms
- 2435 rooms
- 116 rooms
- 07 rooms
- 08 rooms
- 139+ rooms
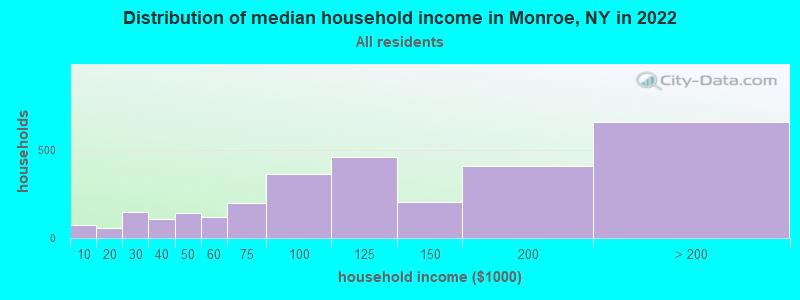
Monroe, NY household income distribution

- 75Less than $10,000
- 56$10,000 to $19,999
- 150$20,000 to $29,999
- 106$30,000 to $39,999
- 144$40,000 to $49,999
- 118$50,000 to $59,999
- 196$60,000 to $74,999
- 363$75,000 to $99,999
- 458$100,000 to $124,999
- 205$125,000 to $149,999
- 408$150,000 to $199,999
- 657$200,000 or more
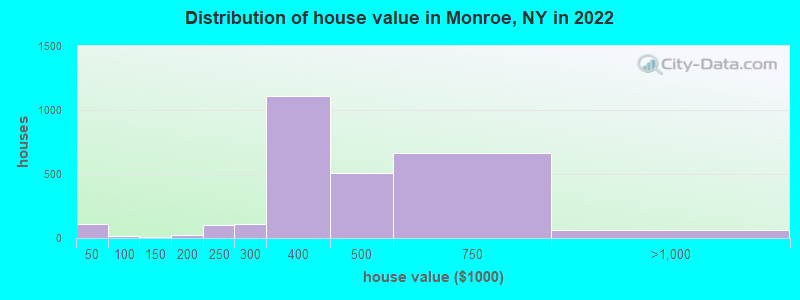
Home value of owner - occupied houses in 2022 in Monroe, NY
-
- 42Less than $10,000
- 8$20,000 to $24,999
- 43$25,000 to $29,999
- 15$30,000 to $34,999
- 14$50,000 to $59,999
- 11$100,000 to $124,999
- 21$150,000 to $174,999
- 4$175,000 to $199,999
- 105$200,000 to $249,999
- 112$250,000 to $299,999
- 1,112$300,000 to $399,999
- 509$400,000 to $499,999
- 665$500,000 to $749,999
- 62$750,000 to $999,999
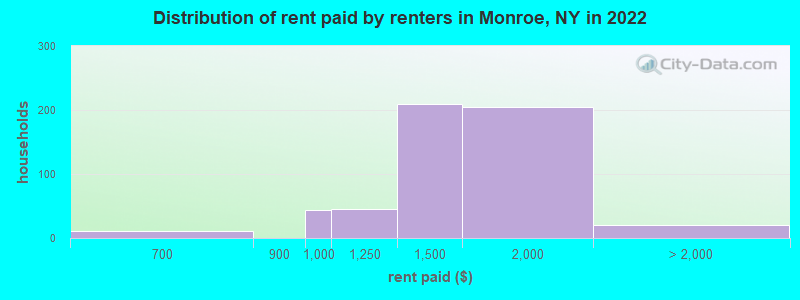
Rent paid by renters in 2022 in Monroe, NY
-
- 11$650 to $699
- 44$900 to $999
- 45$1,000 to $1,249
- 208$1,250 to $1,499
- 205$1,500 to $1,999
- 8$2,000 to $2,499
- 12No cash rent
Percentage of workers working in this county: 65.3%
Number of people working at home: 480 (9.5% of all workers)
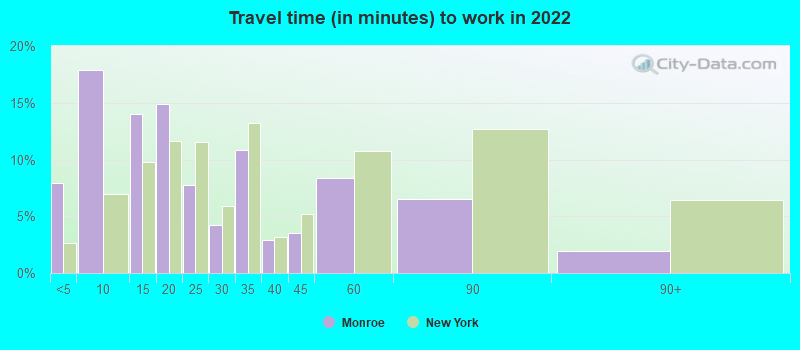
Travel time to work (commute)
- Less than 5 minutes: 45
- 5 to 9 minutes: 510
- 10 to 14 minutes: 635
- 15 to 19 minutes: 708
- 20 to 24 minutes: 238
- 25 to 29 minutes: 164
- 30 to 34 minutes: 457
- 35 to 39 minutes: 233
- 40 to 44 minutes: 152
- 45 to 59 minutes: 350
- 60 to 89 minutes: 642
- 90 or more minutes: 415
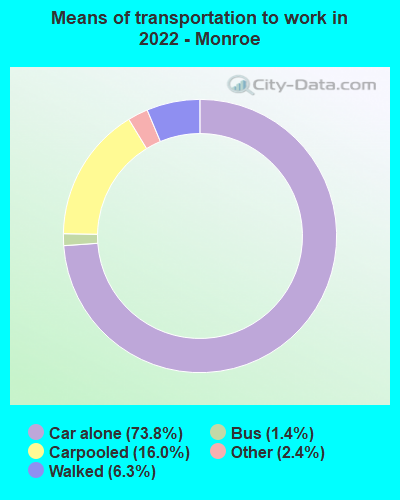
Means of transportation to work:
- Drove a car alone: 3,559 (64.3%)
- Carpooled: 964 (17.4%)
- Bus: 87 (1.6%)
- Taxi: 143 (2.6%)
- Walked: 340 (6.1%)
- Worked at home: 480 (8.7%)
- Unemployment by race in 2022
- Unemployment rate for White non-Hispanic residents
- 2.1%Males
- 6.3%Females
- Unemployment rate for other race residents
- 10.0%Males
- 8.4%Females
- Unemployment rate for Hispanic or Latino residents
- 1.7%Males
- 8.2%Females
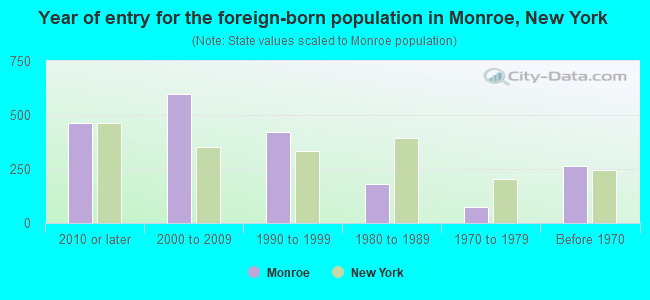
- Year of entry for the foreign-born population in Monroe, New York
- 4612010 or later
- 5962000 to 2009
- 4191990 to 1999
- 1821980 to 1989
- 741970 to 1979
- 262Before 1970
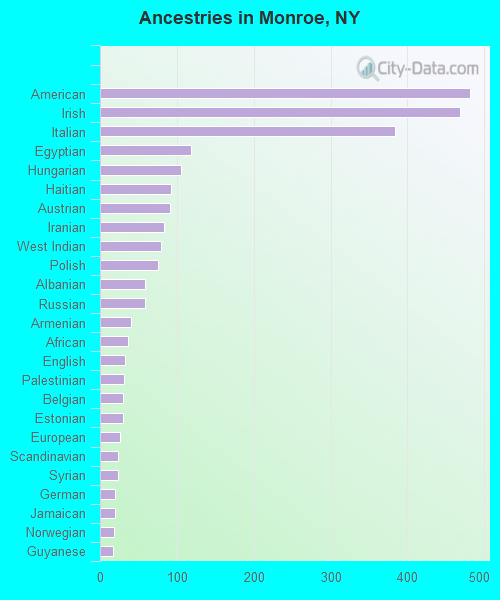
First ancestries reported:
- American: 482 (10.4%)
- Irish: 469 (10.2%)
- Italian: 384 (8.3%)
- Egyptian: 119 (2.6%)
- Hungarian: 106 (2.3%)
- Haitian: 93 (2.0%)
- Austrian: 91 (2.0%)
- Iranian: 83 (1.8%)
- West Indian: 80 (1.7%)
- Polish: 75 (1.6%)
- Albanian: 59 (1.3%)
- Russian: 59 (1.3%)
- Armenian: 40 (0.9%)
- African: 37 (0.8%)
- English: 32 (0.7%)
- Palestinian: 31 (0.7%)
- Belgian: 30 (0.6%)
- Estonian: 30 (0.6%)
- European: 26 (0.6%)
- Scandinavian: 24 (0.5%)
- Syrian: 23 (0.5%)
- German: 20 (0.4%)
- Jamaican: 19 (0.4%)
- Norwegian: 18 (0.4%)
- Guyanese: 17 (0.4%)
- British: 11 (0.2%)
- Scotch-Irish: 10 (0.2%)
- Scottish: 9 (0.2%)
- Canadian: 6 (0.1%)
- French: 5 (0.1%)
Most common places of birth for foreign-born residents (%):
| Monroe: | 16.0% (297) |
| New York: | 4.8% (214,559) |
| Monroe: | 7.9% (147) |
| New York: | 1.8% (81,374) |
| Monroe: | 6.9% (129) |
| New York: | 1.2% (55,571) |
| Monroe: | 6.6% (122) |
| New York: | 2.8% (126,936) |
| Monroe: | 6.5% (121) |
| New York: | 3.5% (158,432) |
| Monroe: | 5.9% (110) |
| New York: | 11.1% (501,040) |
| Monroe: | 4.1% (76) |
| New York: | 0.7% (30,173) |
| Monroe: | 4.0% (75) |
| New York: | 0.2% (11,219) |
| Monroe: | 3.9% (72) |
| New York: | 0.1% (3,487) |
| Monroe: | 3.8% (70) |
| New York: | 2.4% (108,067) |
| Monroe: | 3.5% (65) |
| New York: | 5.0% (227,557) |
| Monroe: | 3.1% (57) |
| New York: | 0.1% (4,960) |
| Monroe: | 3.1% (57) |
| New York: | 3.9% (177,448) |
| Monroe: | 2.5% (47) |
| New York: | 1.3% (59,107) |
| Monroe: | 2.3% (43) |
| New York: | 9.1% (410,910) |
| Monroe: | 2.3% (42) |
| New York: | 0.8% (33,869) |
| Monroe: | 2.0% (37) |
| New York: | 0.6% (27,385) |
| Monroe: | 1.9% (35) |
| New York: | 0.4% (18,283) |
| Monroe: | 1.9% (35) |
| New York: | 0.2% (10,519) |
| Monroe: | 1.8% (33) |
| New York: | 3.8% (172,129) |
Place of birth for U.S.-born residents:
- This state: 6,289
- Other state: 1,072
- Northeast: 441
- Midwest: 311
- South: 274
- West: 77
91.5% of Monroe residents lived in the same house 1 years ago.
Out of people who lived in different houses, 23.2% lived in this county.
Out of people who lived in different counties, 88.8% lived in New York.
| Monroe: | 91.5% |
| State average: | 89.6% |
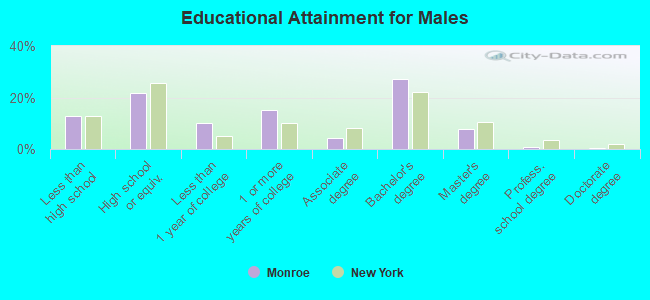
Education attainment for males 25 years and older:
- No schooling: 67
- Nursery to 4th grade: 110
- 5th and 6th grade: 0
- 7th and 8th grade: 8
- 9th grade: 0
- 10th grade: 126
- 11th grade: 43
- 12th grade, no diploma: 15
- High school graduate (or equivalency): 631
- Less than 1 year of college: 294
- Some college more than 1 year, no degree: 440
- Associate degree: 123
- Bachelor's degree: 785
- Master's degree: 223
- Professional school degree: 20
- Doctorate degree: 6
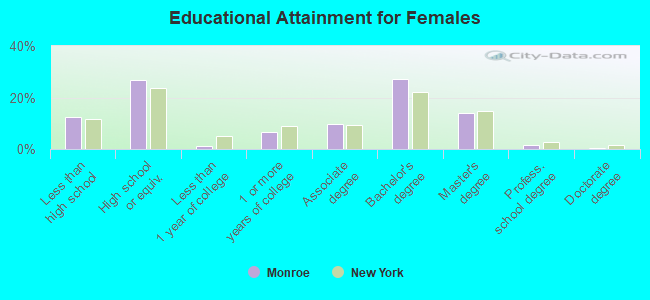
Education attainment for females 25 years and older:
- No schooling: 170
- Nursery to 4th grade: 13
- 5th and 6th grade: 7
- 7th and 8th grade: 11
- 9th grade: 11
- 10th grade: 77
- 11th grade: 32
- 12th grade, no diploma: 70
- High school graduate (or equivalency): 838
- Less than 1 year of college: 36
- Some college more than 1 year, no degree: 211
- Associate degree: 298
- Bachelor's degree: 843
- Master's degree: 436
- Professional school degree: 47
- Doctorate degree: 17


Housing units in structures:
- One, detached: 2,168
- One, attached: 365
- Two: 32
- 3 or 4: 231
- 5 to 9: 184
- 10 to 19: 9
- 20 to 49: 8
- 50 or more: 8
- Mobile homes: 30
- Boats, RVs, vans, etc.: 13
Housing units lacking complete kitchen facilities in 2022: 1.4%
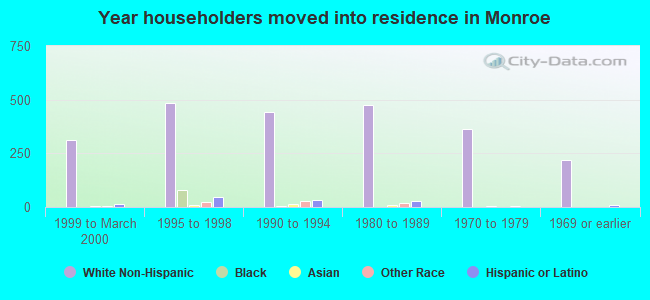
House/condo owner moved in on average 12 years ago
Renter moved in on average 5 years ago
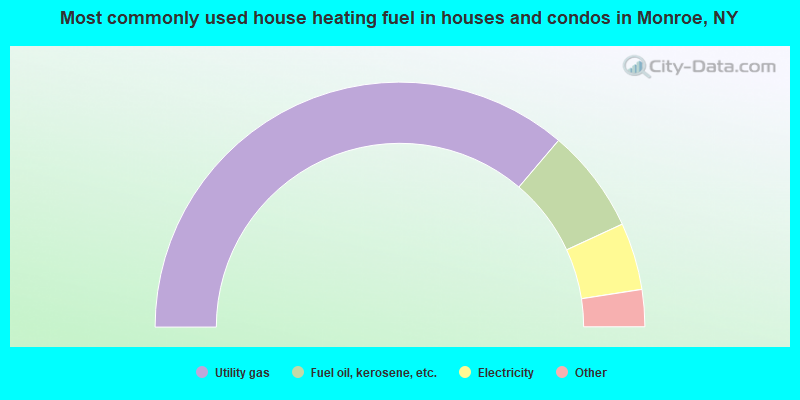
- 72.5%Utility gas
- 13.8%Fuel oil, kerosene, etc.
- 8.9%Electricity
- 2.4%Bottled, tank, or LP gas
- 1.7%Wood
- 0.8%Solar energy
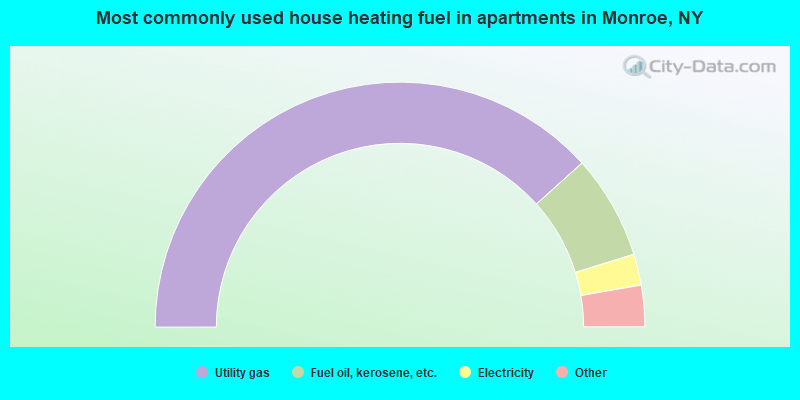
- 76.9%Utility gas
- 13.8%Fuel oil, kerosene, etc.
- 4.1%Electricity
- 2.8%No fuel used
- 2.4%Bottled, tank, or LP gas
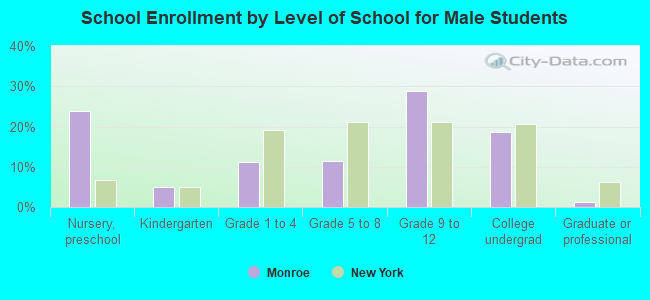
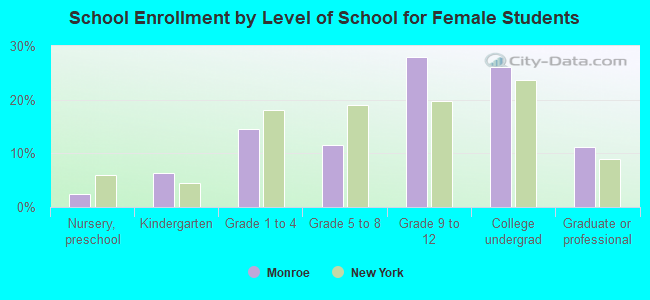
Private vs. public school enrollment:
| Here: | 14.3% |
| New York: | 15.6% |
| Here: | 0.0% |
| New York: | 15.0% |
| Here: | 26.0% |
| New York: | 39.2% |