Housing density: 2,329 houses/condos per square mile
Median price asked for vacant for-sale houses and condos in 2022 in this county: $195,117.
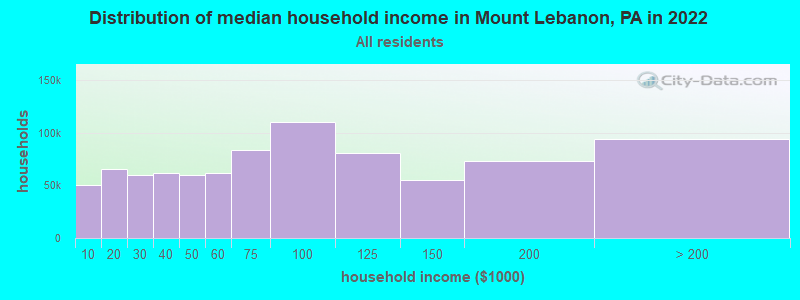
Median contract rent in 2022: $1,095 (lower quartile is $873, upper quartile is $1,456)
Median rent asked for vacant for-rent units in 2022: $944
Median gross rent in Mount Lebanon, PA in 2022: $1,172
Housing units in Mount Lebanon with a mortgage: 6,337 (624 second mortgage, 1,350 home equity loan, 71 both second mortgage and home equity loan) Houses without a mortgage: 2,976
Compare current foreclosures near Mount Lebanon, PA:
In family households: 913,516 (208,635 male householders, 99,374 female householders)
222,332 spouses, 315,393 children (298,168 natural, 7,619 adopted, 9,606 stepchildren), 18,457 grandchildren, 9,985 brothers or sisters, 8,652 parents, foster children, 7,846 other relatives, 18,452 non-relatives
In nonfamily households: 274,778 (100,758 male householders (79,382 living alone)), 125,193 female householders (107,576 living alone)), 48,827 nonrelatives
In group quarters: 35,054 (13,287 institutionalized population)
186,963 married couples with children.
71,829 single-parent households (11,403 men, 60,426 women).
92.2% of residents of Mount Lebanon speak English at home.
1.5% of residents speak Spanish at home (73% speak English very well, 18% speak English well, 9% speak English not well).
4.5% of residents speak other Indo-European language at home (67% speak English very well, 22% speak English well, 10% speak English not well, 1% don't speak English at all).
1.2% of residents speak Asian or Pacific Island language at home (52% speak English very well, 19% speak English well, 24% speak English not well, 5% don't speak English at all).
0.5% of residents speak other language at home (91% speak English very well, 9% speak English well).
Foreign born population: 2,150 (6.8%)
(55.8% of them are naturalized citizens)
Year of entry for the foreign-born population in Mount Lebanon, Pennsylvania
3531995 to March 2000
2051990 to 1994
761985 to 1989
1161980 to 1984
1701975 to 1979
1011970 to 1974
991965 to 1969
335Before 1965
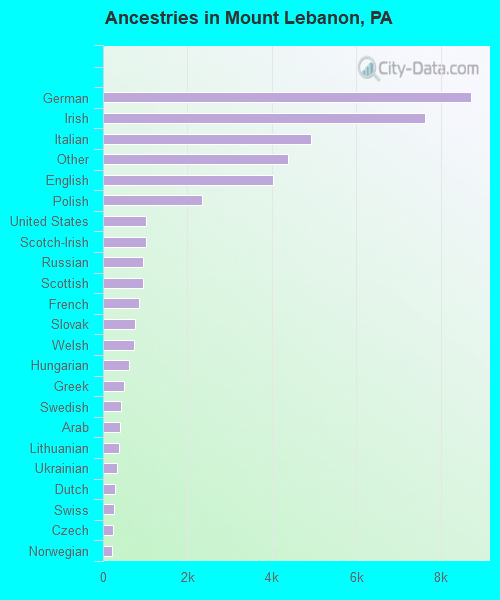
First ancestries reported:
German: 8,706 (20.7%)
Irish: 7,630 (18.1%)
Italian: 4,915 (11.7%)
Other: 4,391 (10.4%)
English: 4,030 (9.6%)
Polish: 2,350 (5.6%)
United States: 1,018 (2.4%)
Scotch-Irish: 1,017 (2.4%)
Russian: 942 (2.2%)
Scottish: 940 (2.2%)
French: 842 (2.0%)
Slovak: 750 (1.8%)
Welsh: 739 (1.8%)
Hungarian: 604 (1.4%)
Greek: 506 (1.2%)
Swedish: 419 (1.0%)
Arab: 410 (1.0%)
Lithuanian: 383 (0.9%)
Ukrainian: 320 (0.8%)
Dutch: 290 (0.7%)
Swiss: 254 (0.6%)
Czech: 242 (0.6%)
Norwegian: 214 (0.5%)
Danish: 74 (0.2%)
French Canadian: 54 (0.1%)
Portuguese: 16 (0.04%)
Subsaharan African: 11 (0.03%)
Most common places of birth for foreign-born residents (%):
United Kingdom
Mount Lebanon:
9.8% (143)
Pennsylvania:
4.6% (23,171)
China, excluding Hong Kong and Taiwan
Mount Lebanon:
8.9% (130)
Pennsylvania:
4.6% (23,478)
Other Eastern Europe
Mount Lebanon:
8.0% (117)
Pennsylvania:
1.7% (8,574)
Italy
Mount Lebanon:
6.8% (99)
Pennsylvania:
6.0% (30,559)
Germany
Mount Lebanon:
6.4% (93)
Pennsylvania:
5.1% (25,685)
India
Mount Lebanon:
5.8% (84)
Pennsylvania:
7.4% (37,541)
Russia
Mount Lebanon:
4.9% (72)
Pennsylvania:
2.7% (13,885)
Canada
Mount Lebanon:
4.7% (68)
Pennsylvania:
3.0% (15,200)
Vietnam
Mount Lebanon:
4.4% (64)
Pennsylvania:
5.2% (26,656)
Ukraine
Mount Lebanon:
3.3% (48)
Pennsylvania:
3.3% (16,897)
Greece
Mount Lebanon:
3.2% (47)
Pennsylvania:
1.4% (7,362)
Korea
Mount Lebanon:
2.7% (39)
Pennsylvania:
5.3% (26,703)
Thailand
Mount Lebanon:
2.3% (33)
Pennsylvania:
0.6% (2,828)
Hungary
Mount Lebanon:
1.9% (28)
Pennsylvania:
0.7% (3,762)
Hong Kong
Mount Lebanon:
1.9% (28)
Pennsylvania:
0.6% (2,815)
Taiwan
Mount Lebanon:
1.6% (23)
Pennsylvania:
1.1% (5,442)
Iran
Mount Lebanon:
1.6% (23)
Pennsylvania:
0.6% (3,034)
Lebanon
Mount Lebanon:
1.5% (22)
Pennsylvania:
0.5% (2,303)
Place of birth for U.S.-born residents:
This state: 23,885
Other state: 7,418
Northeast: 2,072
Midwest: 2,696
South: 1,970
West: 680
67% of Mount Lebanon residents lived in the same house 5 years ago. Out of people who lived in different houses, 67% lived in this county. Out of people who lived in different counties, 35% lived in Pennsylvania.
Education attainment for males 25 years and older:
No schooling: 14
Nursery to 4th grade: 8
5th and 6th grade: 33
7th and 8th grade: 36
9th grade: 79
10th grade: 47
11th grade: 49
12th grade, no diploma: 79
High school graduate (or equivalency): 1,258
Less than 1 year of college: 367
Some college more than 1 year, no degree: 926
Associate degree: 378
Bachelor's degree: 3,744
Master's degree: 1,712
Professional school degree: 1,273
Doctorate degree: 453
Education attainment for females 25 years and older:
No schooling: 32
Nursery to 4th grade: 5
5th and 6th grade: 28
7th and 8th grade: 156
9th grade: 41
10th grade: 147
11th grade: 86
12th grade, no diploma: 239
High school graduate (or equivalency): 2,374
Less than 1 year of college: 681
Some college more than 1 year, no degree: 1,329
Associate degree: 806
Bachelor's degree: 4,514
Master's degree: 2,044
Professional school degree: 417
Doctorate degree: 205
Housing units in structures:
One, detached: 9,739
One, attached: 740
Two: 411
3 or 4: 131
5 to 9: 512
10 to 19: 646
20 to 49: 707
50 or more: 1,187
Mobile homes: 16
Median worth of mobile homes: $724,026
Housing units lacking complete plumbing facilities: 0.3%
Housing units lacking complete kitchen facilities: 0.2%