Housing density: 841 houses/condos per square mile
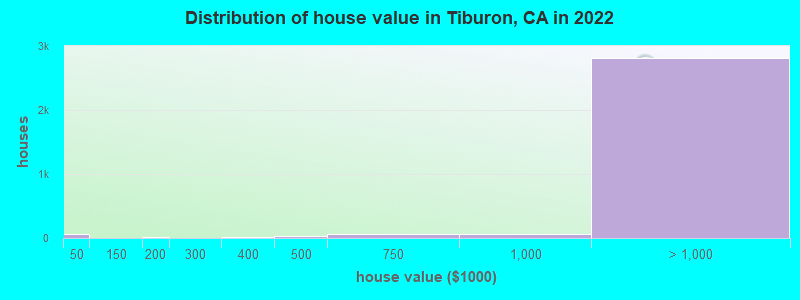
Median price asked for vacant for-sale houses and condos in 2022 in this county: $3,364,178.
Median contract rent in 2022: over $2,000
Median rent asked for vacant for-rent units in 2022: $75,744
Median gross rent in Tiburon, CA in 2022: over $2,000
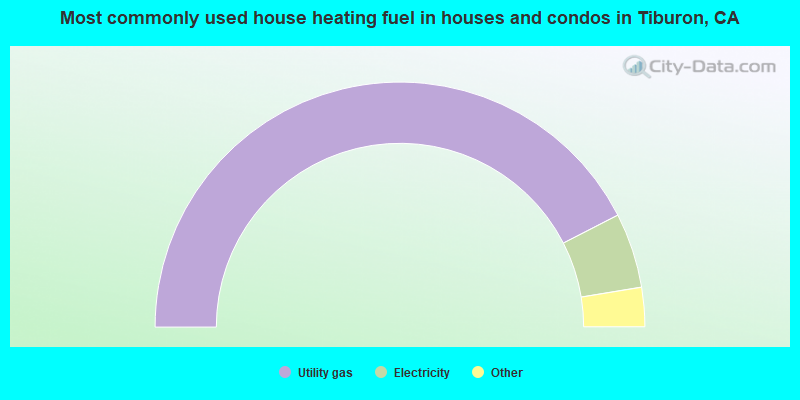
Housing units in Tiburon with a mortgage: 1,451 (292 second mortgage, 0 home equity loan, 237 both second mortgage and home equity loan) Houses without a mortgage: 0
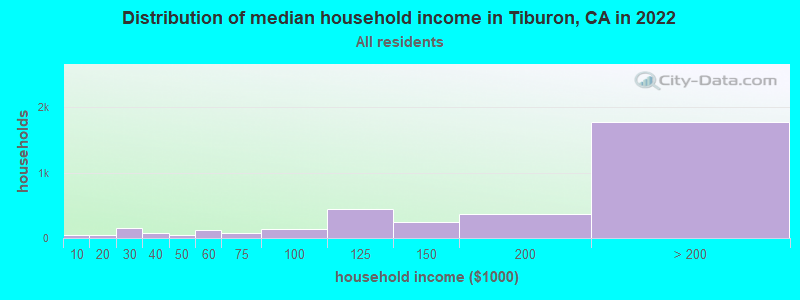
Median household income for houses/condos with a mortgage: $263,303
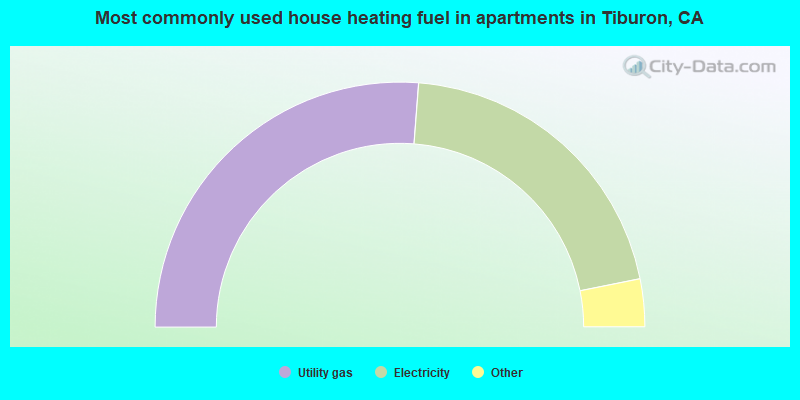
Median household income for apartments without a mortgage: $175,860
1,386 married couples with children.
229 single-parent households (81 men, 148 women).
76.1% of residents of Tiburon speak English at home.
3.2% of residents speak Spanish at home (91% speak English very well, 9% speak English well).
14.0% of residents speak other Indo-European language at home (73% speak English very well, 13% speak English well, 13% speak English not well, 1% don't speak English at all).
5.6% of residents speak Asian or Pacific Island language at home (66% speak English very well, 7% speak English well, 21% speak English not well, 6% don't speak English at all).
1.7% of residents speak other language at home (83% speak English very well, 17% speak English well).
Foreign born population: 2,322 (25.9%)
(62.7% of them are naturalized citizens)
Percentage of workers working in this county: 73.2% Number of people working at home: 1,737 (43.4% of all workers)
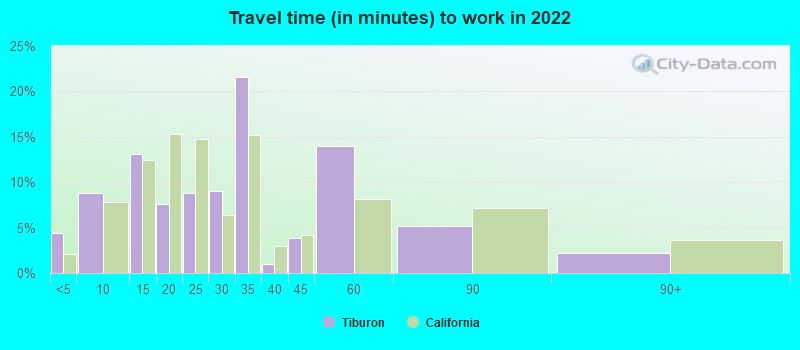
Travel time to work (commute)
Less than 5 minutes: 144
5 to 9 minutes: 154
10 to 14 minutes: 234
15 to 19 minutes: 496
20 to 24 minutes: 264
25 to 29 minutes: 32
30 to 34 minutes: 286
35 to 39 minutes: 157
40 to 44 minutes: 187
45 to 59 minutes: 156
60 to 89 minutes: 209
90 or more minutes: 64
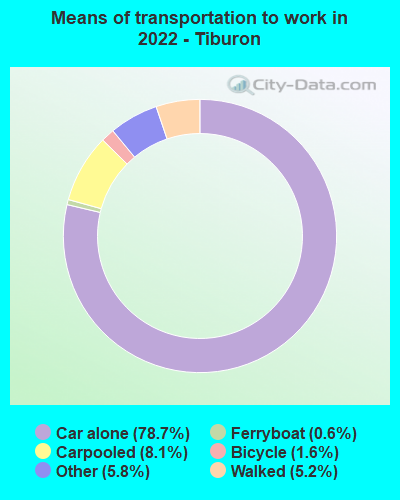
Means of transportation to work:
Drove a car alone: 1,784 (45.1%)
Carpooled: 174 (4.4%)
Ferryboat: 16 (0.4%)
Taxi: 230 (5.8%)
Bicycle: 72 (1.8%)
Walked: 152 (3.8%)
Worked at home: 1,737 (43.9%)
Unemployment by race in 2022
Unemployment rate for White non-Hispanic residents
13.3%Males
2.0%Females
Unemployment rate for Asian residents
49.5%Males
Unemployment rate for two or more race residents
9.4%Males
Year of entry for the foreign-born population in Tiburon, California
8972010 or later
2602000 to 2009
1901990 to 1999
4061980 to 1989
2751970 to 1979
644Before 1970
First ancestries reported:
English: 684 (14.2%)
German: 412 (8.5%)
Brazilian: 396 (8.2%)
Irish: 290 (6.0%)
Russian: 247 (5.1%)
Northern European: 201 (4.2%)
Italian: 196 (4.1%)
Scottish: 167 (3.5%)
American: 155 (3.2%)
Eastern European: 108 (2.2%)
Palestinian: 105 (2.2%)
European: 101 (2.1%)
Turkish: 93 (1.9%)
South African: 87 (1.8%)
Bulgarian: 69 (1.4%)
Iranian: 69 (1.4%)
Dutch: 55 (1.1%)
Welsh: 50 (1.0%)
Swedish: 48 (1.0%)
Danish: 36 (0.7%)
Austrian: 33 (0.7%)
French: 32 (0.7%)
Armenian: 28 (0.6%)
Swiss: 27 (0.6%)
Norwegian: 26 (0.5%)
Syrian: 25 (0.5%)
Canadian: 22 (0.5%)
Romanian: 19 (0.4%)
British: 19 (0.4%)
Czech: 16 (0.3%)
Ukrainian: 16 (0.3%)
Serbian: 14 (0.3%)
Slovak: 14 (0.3%)
Lithuanian: 9 (0.2%)
Most common places of birth for foreign-born residents (%):
Brazil
Tiburon:
19.8% (463)
California:
0.5% (53,222)
Korea
Tiburon:
6.8% (158)
California:
3.0% (315,248)
Philippines
Tiburon:
6.5% (151)
California:
7.8% (818,297)
United Kingdom, excluding England and Scotland
Tiburon:
6.3% (148)
California:
0.6% (60,582)
England
Tiburon:
5.6% (132)
California:
0.6% (57,953)
South Africa
Tiburon:
4.6% (107)
California:
0.2% (20,614)
Canada
Tiburon:
4.2% (98)
California:
1.2% (127,477)
Turkey
Tiburon:
4.1% (95)
California:
0.2% (20,474)
Iran
Tiburon:
3.3% (77)
California:
2.0% (206,004)
Germany
Tiburon:
3.1% (72)
California:
0.7% (73,304)
Bulgaria
Tiburon:
2.9% (68)
California:
0.1% (9,442)
China, excluding Hong Kong and Taiwan
Tiburon:
2.8% (65)
California:
6.6% (684,672)
Kenya
Tiburon:
2.8% (65)
California:
0.1% (12,503)
Russia
Tiburon:
2.4% (57)
California:
0.7% (71,932)
Jordan
Tiburon:
2.2% (52)
California:
0.2% (16,384)
Hong Kong
Tiburon:
1.9% (44)
California:
1.0% (105,215)
Ukraine
Tiburon:
1.8% (43)
California:
0.6% (60,761)
Place of birth for U.S.-born residents:
This state: 3,656
Other state: 2,825
Northeast: 1,115
Midwest: 952
South: 395
West: 345
83.2% of Tiburon residents lived in the same house 1 years ago. Out of people who lived in different houses, 30.8% lived in this county. Out of people who lived in different counties, 54.3% lived in California.
Tiburon:
83.2%
State average:
88.9%
Education attainment for males 25 years and older:
No schooling: 0
Nursery to 4th grade: 0
5th and 6th grade: 0
7th and 8th grade: 0
9th grade: 0
10th grade: 0
11th grade: 11
12th grade, no diploma: 0
High school graduate (or equivalency): 162
Less than 1 year of college: 117
Some college more than 1 year, no degree: 272
Associate degree: 107
Bachelor's degree: 1,269
Master's degree: 622
Professional school degree: 571
Doctorate degree: 172
Education attainment for females 25 years and older:
No schooling: 0
Nursery to 4th grade: 14
5th and 6th grade: 0
7th and 8th grade: 0
9th grade: 0
10th grade: 0
11th grade: 38
12th grade, no diploma: 0
High school graduate (or equivalency): 133
Less than 1 year of college: 25
Some college more than 1 year, no degree: 233
Associate degree: 241
Bachelor's degree: 1,388
Master's degree: 725
Professional school degree: 462
Doctorate degree: 186
Housing units in structures:
One, detached: 2,518
One, attached: 226
Two: 77
3 or 4: 374
5 to 9: 372
10 to 19: 126
20 to 49: 57
50 or more: 53
Housing units lacking complete kitchen facilities in 2022: 0.6%
House/condo owner moved in on average 13 years ago