Chinatown neighborhood in New York, New York (NY), 10002, 10013 detailed profile
Settings
X

Business Search - 14 Million verified businesses
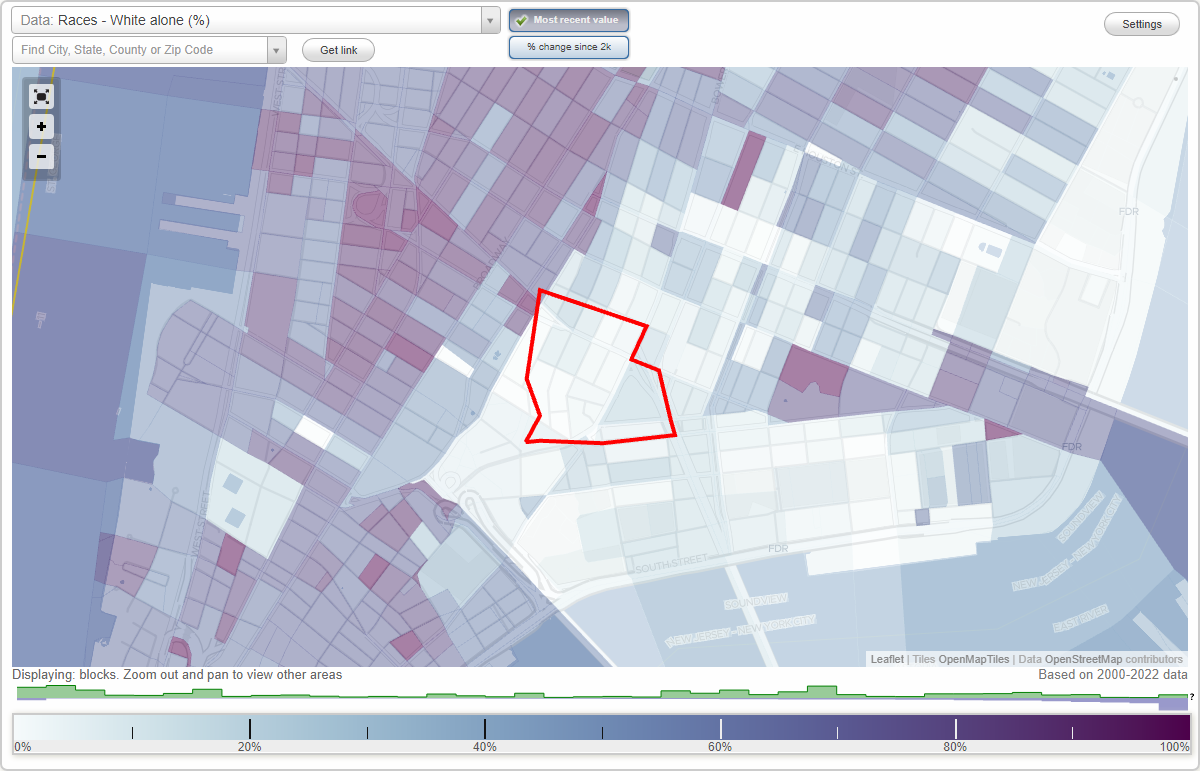
Area: 0.082 square miles
Population: 4,722
Population density:
| Chinatown: | 57,314 people per square mile |
| New York: | 27,483 people per square mile |

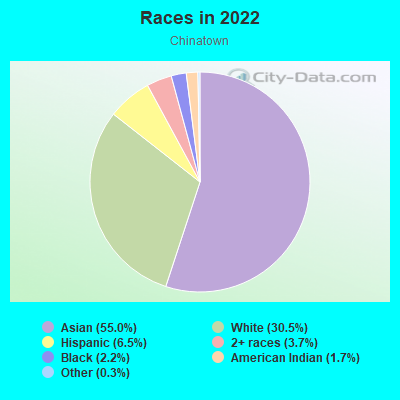
- 2,76655.0%Asian
- 1,53430.5%White
- 3296.5%Hispanic or Latino
- 1883.7%Two or more races
- 1112.2%Black
- 871.7%American Indian
- 160.3%Some other race
Distribution of median household income
![Distribution of median household income]()
- 110Less than $10,000
- 512$10,000 to $19,999
- 226$20,000 to $29,999
- 368$30,000 to $39,999
- 241$40,000 to $49,999
- 117$50,000 to $59,999
- 154$60,000 to $74,999
- 187$75,000 to $99,999
- 241$100,000 to $124,999
- 192$125,000 to $149,999
- 306$150,000 to $199,999
- 514$200,000 or more

Distribution of owner-occupied house/condo value
![Distribution of owner-occupied house/condo value]()
- 27Less than $50,000
- 13$150,000 to $199,999
- 16$200,000 to $249,999
- 28$250,000 to $299,999
- 27$300,000 to $399,999
- 174$400,000 to $499,999
- 202$500,000 to $749,999
- 56$750,000 to $999,999
- 349$1,000,000 or more

Distribution of rent paid by renters
![Distribution of rent paid by renters]()
- 107Less than $100
- 153$100 to $199
- 309$200 to $299
- 363$300 to $399
- 291$400 to $499
- 300$500 to $599
- 169$600 to $699
- 473$700 to $799
- 149$800 to $899
- 300$900 to $999
- 332$1,000 to $1,249
- 165$1,250 to $1,499
- 388$1,500 to $1,999
- 695$2,000 or more

Median rent in 2022:
| Chinatown: | $1,474 |
| New York: | $1,573 |
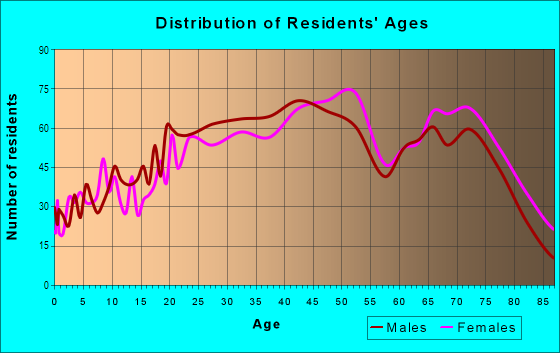
| Males: | 2,493 |
| Females: | 2,228 |
Males:
| This neighborhood: | 39.3 years |
| Whole city: | 37.0 years |
| This neighborhood: | 40.4 years |
| Whole city: | 39.8 years |
Average household size:
| Chinatown: | 2.0 people |
| New York: | 2.4 people |
Percentage of family households:
| Chinatown: | 33.2% |
| New York: | 38.3% |
| Here: | 31.2% |
| New York: | 34.8% |
Percentage of married-couple families with children (among all households):
| Chinatown: | 43.6% |
| New York: | 25.9% |
Percentage of single-mother households (among all households):
| Chinatown: | 19.4% |
| New York: | 11.8% |
Percentage of never married males 15 years old and over:
Percentage of never married females 15 years old and over:
| Chinatown: | 26.1% |
| New York: | 21.7% |
Percentage of never married females 15 years old and over:
| Chinatown: | 21.8% |
| city: | 22.4% |
Percentage of people that speak English not well or not at all:
| Chinatown: | 28.8% |
| New York: | 12.2% |
Percentage of people born in this state:
Percentage of people born in another U.S. state:
Percentage of native residents but born outside the U.S.:
Percentage of foreign born residents:
| Here: | 29.2% |
| New York: | 48.0% |
Percentage of people born in another U.S. state:
| Chinatown: | 17.5% |
| New York: | 11.7% |
Percentage of native residents but born outside the U.S.:
| Here: | 2.0% |
| city: | 3.6% |
Percentage of foreign born residents:
| Here: | 51.4% |
| New York: | 36.8% |
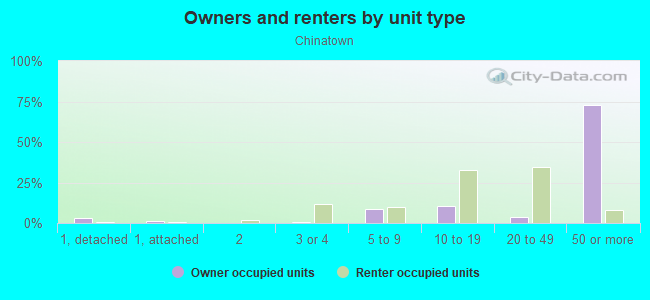
Owner-occupied
Renter-occupied

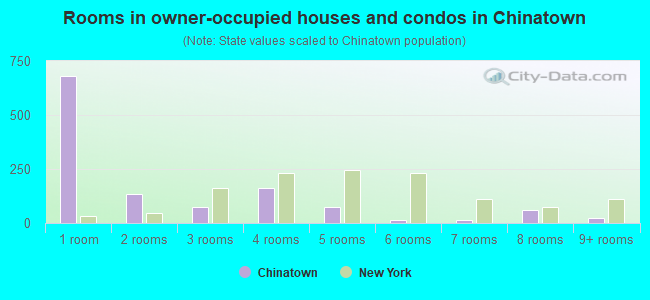
- Rooms in owner-occupied houses and condos in Chinatown
- 6811 room
- 1352 rooms
- 763 rooms
- 1624 rooms
- 745 rooms
- 156 rooms
- 157 rooms
- 628 rooms
- 229+ rooms
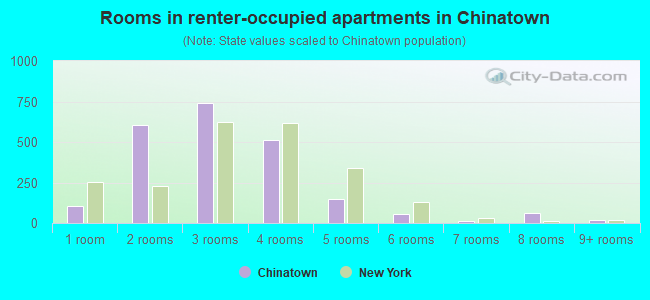
- Rooms in renter-occupied apartments in Chinatown
- 1021 room
- 6082 rooms
- 7383 rooms
- 5124 rooms
- 1485 rooms
- 536 rooms
- 157 rooms
- 608 rooms
- 199+ rooms
Owner-occupied
Renter-occupied
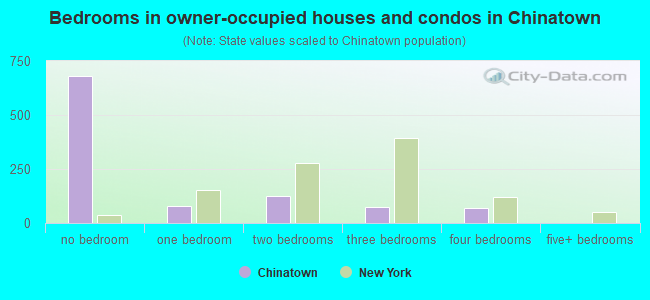
- Bedrooms in owner-occupied houses and condos in Chinatown
- 682no bedroom
- 781 bedroom
- 1252 bedrooms
- 753 bedrooms
- 684 bedrooms
- 05+ bedrooms
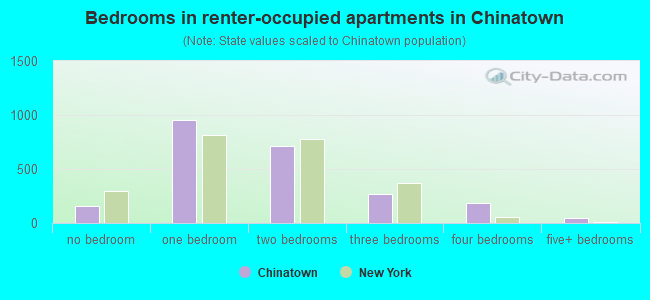
- Bedrooms in renter-occupied apartments in Chinatown
- 161no bedroom
- 9561 bedroom
- 7142 bedrooms
- 2703 bedrooms
- 1824 bedrooms
- 495+ bedrooms
Average number of cars or other vehicles available in houses/condos:
Average number of cars or other vehicles available in apartments:
| This neighborhood: | |
| New York: |
Average number of cars or other vehicles available in apartments:
| Here: | |
| city: |
Percentage of units with a mortgage:
| Chinatown: | 38.2% |
| New York: | 56.2% |
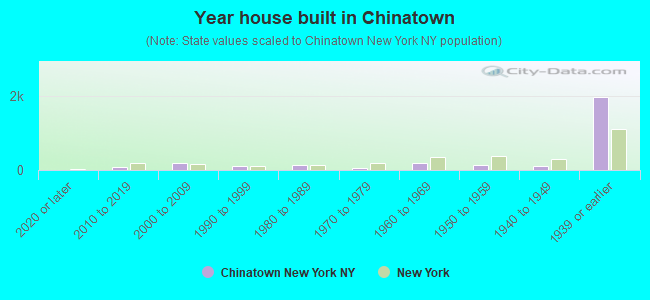
- Year house built in Chinatown
- 02020 or later
- 682010 to 2019
- 1892000 to 2009
- 991990 to 1999
- 1271980 to 1989
- 661970 to 1979
- 1851960 to 1969
- 1211950 to 1959
- 991940 to 1949
- 1,9531939 or earlier
City-data.com crime index for city in 2020 (higher means more crime):
| City: | 229.7 |
| U.S. average: | 219.5 |
Travel time to work (commute)
![Travel time to work (commute)]()
- 60Less than 5 minutes
- 1665 to 9 minutes
- 29610 to 14 minutes
- 66815 to 19 minutes
- 63920 to 24 minutes
- 30425 to 29 minutes
- 85030 to 34 minutes
- 15235 to 39 minutes
- 13940 to 44 minutes
- 24145 to 59 minutes
- 28360 to 89 minutes
- 8190 or more minutes

Means of transportation to work
![Means of transportation to work]()
- 3.9%105Drove a car alone
- 2.2%60Carpooled
- 7.2%192Bus
- 38.9%1,039Subway or elevated rail
- 1.0%28Long-distance train or commuter rail
- 1.0%27Ferryboat
- 1.4%38Taxi
- 6.5%174Bicycle
- 28.3%755Walked
- 0.8%22Other means
- 18.8%503Worked at home

Time leaving home to go to work
![Time leaving home to go to work]()
- 7812:00 a.m. to 4:59 a.m.
- 75:00 a.m. to 5:29 a.m.
- 785:30 a.m. to 5:59 a.m.
- 1106:00 a.m. to 6:29 a.m.
- 1286:30 a.m. to 6:59 a.m.
- 2847:00 a.m. to 7:29 a.m.
- 7527:30 a.m. to 7:59 a.m.
- 8488:00 a.m. to 8:29 a.m.
- 4828:30 a.m. to 8:59 a.m.
- 6969:00 a.m. to 9:59 a.m.
- 11810:00 a.m. to 10:59 a.m.
- 4311:00 a.m. to 11:59 a.m.
- 13212:00 p.m. to 3:59 p.m.
- 2034:00 p.m. to 11:59 p.m.

Occupations of males:
- Percentage of males in management occupations (except farmers):
Here: 11.3% city: 11.2%
- Percentage of males in business and financial operations occupations:
Here: 11.5% city: 6.4%
- Percentage of males in computer and mathematical occupations:
Here: 14.7% city: 5.3%
- Percentage of males in legal occupations:
Here: 3.4% city: 2.1%
- Percentage of males in education, training, and library occupations:
Here: 2.7% city: 4.0%
- Percentage of males in arts, design, entertainment, sports, and media occupations:
Here: 9.1% city: 4.8%
- Percentage of males in healthcare practitioners and technical occupations:
Here: 2.2% city: 3.4%
- Percentage of males in service occupations:
Here: 19.0% city: 18.7%
- Percentage of males in sales and office occupations:
Here: 9.5% city: 15.0%
- Percentage of males in construction, extraction, and maintenance occupations:
Here: 1.4% city: 7.8%
- Percentage of males in transportation occupations:
Here: 2.6% city: 8.1%
- Percentage of males in material moving occupations:
Here: 7.6% city: 3.3%
Occupations of females:
- Percentage of females in management occupations (except farmers):
Here: 14.2% city: 10.4%
- Percentage of females in business and financial operations occupations:
Here: 14.4% city: 7.1%
- Percentage of females in computer and mathematical occupations:
Here: 2.8% city: 1.9%
- Percentage of females in legal occupations:
Here: 4.8% city: 2.2%
- Percentage of females in education, training, and library occupations:
Here: 2.3% city: 9.5%
- Percentage of females in arts, design, entertainment, sports, and media occupations:
Here: 8.6% city: 4.9%
- Percentage of females in healthcare practitioners and technical occupations:
Here: 4.2% city: 7.8%
- Percentage of females in service occupations:
Here: 17.8% city: 25.1%
- Percentage of females in sales and office occupations:
Here: 26.9% city: 22.5%
- Percentage of females in production occupations:
Here: 2.7% city: 1.5%
Percentage of people 16-64 in Armed Forces:
| Chinatown: | 0.0% |
| New York: | 0.1% |
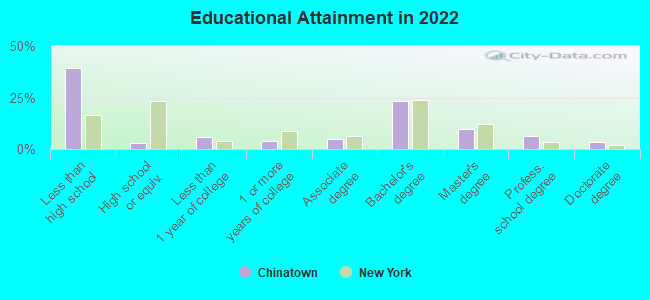
Education in this neighborhood (subdivision or community):
- Percentage of people 3 years and older in K-12 schools:
Chinatown: 22.6% New York: 15.2%
- Percentage of people 3 years and older in undergraduate colleges:
Chinatown: 9.7% New York: 5.1%
- Percentage of people 3 years and older in grad. or professional schools:
Chinatown: 3.7% New York: 2.1%
- Percentage of students K-12 enrolled in private schools:
Chinatown: 43.9% New York: 19.6%
Percentage of population below poverty level:
| Chinatown: | 14.7% |
| New York: | 18.3% |
Median year renter moved in (as recorded in 2022):
| Chinatown: | 2013 |
| New York: | 2016 |
Percentage of married-couple families with both working:
| Chinatown: | 111.9% |
| New York: | 65.6% |
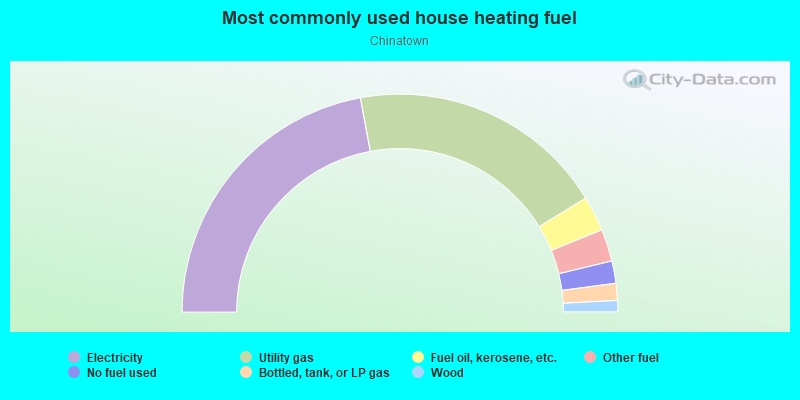
- 44.2%Electricity
- 38.3%Utility gas
- 5.2%Fuel oil, kerosene, etc.
- 4.8%Other fuel
- 3.3%No fuel used
- 2.5%Bottled, tank, or LP gas
- 1.7%Wood
Roads and streets:
Canal St
Length: 0.30 miles
Directions: E-W, SE-NW
Address range: 150 to 238
Directions: E-W, SE-NW
Address range: 150 to 238
Bayard St
Length: 0.24 miles
Direction: E-W
Address range: 40 to 108
Direction: E-W
Address range: 40 to 108
E Broadway
Length: 0.24 miles
Direction: E-W
Address range: 12 to 76
Direction: E-W
Address range: 12 to 76
Mulberry St
Length: 0.24 miles
Directions: N-S, SW-NE
Address range: 1 to 98
Directions: N-S, SW-NE
Address range: 1 to 98
Manhattan Brg
Length: 0.22 miles
Directions: N-S, SE-NW
Directions: N-S, SE-NW
Division St
Length: 0.21 miles
Directions: E-W, SE-NW
Address range: 1 to 74
Directions: E-W, SE-NW
Address range: 1 to 74
Mott St
Length: 0.18 miles
Directions: N-S, SW-NE
Address range: 23 to 87
Directions: N-S, SW-NE
Address range: 23 to 87
Bowery
Length: 0.18 miles
Direction: SW-NE
Address range: 1 to 75
Direction: SW-NE
Address range: 1 to 75
Pell St
Length: 0.12 miles
Direction: E-W
Address range: 1 to 37
Direction: E-W
Address range: 1 to 37
Baxter St
Length: 0.11 miles
Direction: SW-NE
Address range: 79 to 108
Direction: SW-NE
Address range: 79 to 108
Elizabeth St
Length: 0.10 miles
Direction: SW-NE
Address range: 1 to 34
Direction: SW-NE
Address range: 1 to 34
Doyers St
Length: 0.08 miles
Directions: N-S, SE-NW
Address range: 1 to 99
Directions: N-S, SE-NW
Address range: 1 to 99
Walker St
Length: 0.06 miles
Direction: E-W
Direction: E-W
Mosco St
Length: 0.06 miles
Direction: E-W
Address range: 100 to 120
Direction: E-W
Address range: 100 to 120
Chatham Sq
Length: 0.04 miles
Direction: N-S
Address range: 14 to 25
Direction: N-S
Address range: 14 to 25
Market St
Length: 0.04 miles
Direction: SE-NW
Address range: 1 to 8
Direction: SE-NW
Address range: 1 to 8
Catherine St
Length: 0.03 miles
Direction: N-S
Address range: 1 to 12
Direction: N-S
Address range: 1 to 12