Dorsa (Miller) neighborhood in San Jose, California (CA), 95122 detailed profile
Settings
X


Business Search - 14 Million verified businesses
Area: 0.285 square miles
Population: 4,016
Population density:
| Dorsa (Miller): | 14,101 people per square mile |
| San Jose: | 5,554 people per square mile |

- 2,89169.7%Hispanic or Latino
- 1,07025.8%Asian
- 1353.3%Black
- 270.7%Two or more races
- 250.6%White

Median household income in 2022:
| Dorsa (Miller): | $130,785 |
| San Jose: | $133,835 |
Distribution of median household income
![Distribution of median household income]()
- 73Less than $10,000
- 91$10,000 to $19,999
- 40$20,000 to $29,999
- 51$30,000 to $39,999
- 58$40,000 to $49,999
- 172$50,000 to $59,999
- 28$60,000 to $74,999
- 112$75,000 to $99,999
- 152$100,000 to $124,999
- 98$125,000 to $149,999
- 220$150,000 to $199,999
- 150$200,000 or more

Distribution of owner-occupied house/condo value
![Distribution of owner-occupied house/condo value]()
- 53Less than $50,000
- 86$50,000 to $99,999
- 17$100,000 to $149,999
- 23$150,000 to $199,999
- 12$200,000 to $249,999
- 40$300,000 to $399,999
- 30$400,000 to $499,999
- 179$500,000 to $749,999
- 245$750,000 to $999,999
- 116$1,000,000 or more

Distribution of rent paid by renters
![Distribution of rent paid by renters]()
- 12$200 to $299
- 4$300 to $399
- 14$400 to $499
- 11$500 to $599
- 54$600 to $699
- 37$900 to $999
- 104$1,000 to $1,249
- 72$1,250 to $1,499
- 42$1,500 to $1,999
- 456$2,000 or more

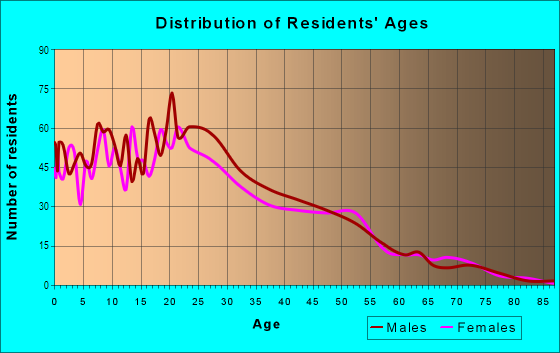
| Males: | 2,005 |
| Females: | 2,011 |
Males:
| This neighborhood: | 35.1 years |
| Whole city: | 37.6 years |
| This neighborhood: | 35.6 years |
| Whole city: | 39.1 years |
Average household size:
| Dorsa (Miller): | 4.8 people |
| San Jose: | 2.9 people |
Percentage of family households:
| Dorsa (Miller): | 57.5% |
| San Jose: | 49.9% |
| Here: | 53.1% |
| San Jose: | 53.0% |
Percentage of married-couple families with children (among all households):
| Dorsa (Miller): | 12.9% |
| San Jose: | 25.8% |
Percentage of single-mother households (among all households):
| Dorsa (Miller): | 10.4% |
| San Jose: | 5.2% |
Percentage of never married males 15 years old and over:
Percentage of never married females 15 years old and over:
| Dorsa (Miller): | 29.5% |
| San Jose: | 20.9% |
Percentage of never married females 15 years old and over:
| Dorsa (Miller): | 23.4% |
| city: | 16.7% |
Percentage of people that speak English not well or not at all:
| Dorsa (Miller): | 25.5% |
| San Jose: | 11.4% |
Percentage of people born in this state:
Percentage of people born in another U.S. state:
Percentage of native residents but born outside the U.S.:
Percentage of foreign born residents:
| Here: | 40.3% |
| San Jose: | 46.1% |
Percentage of people born in another U.S. state:
| Dorsa (Miller): | 1.8% |
| San Jose: | 10.4% |
Percentage of native residents but born outside the U.S.:
| Here: | 1.7% |
| city: | 1.7% |
Percentage of foreign born residents:
| Here: | 56.2% |
| San Jose: | 41.8% |
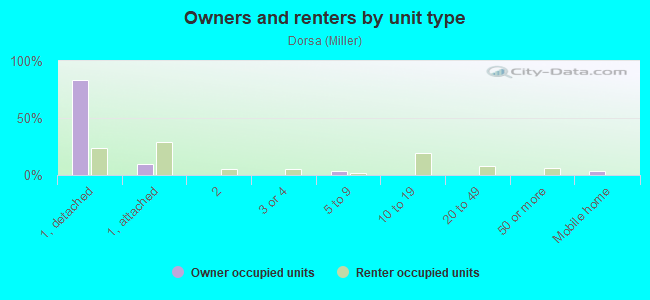
Owner-occupied
Renter-occupied

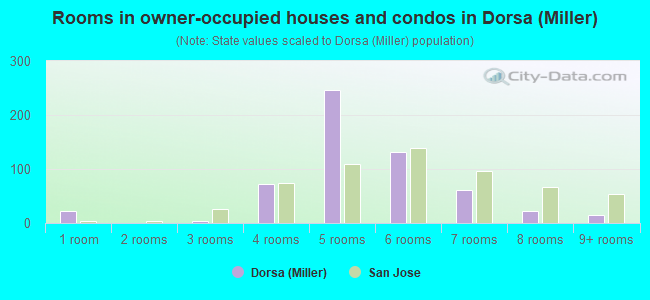
- Rooms in owner-occupied houses and condos in Dorsa <
> - 221 room
- 02 rooms
- 43 rooms
- 734 rooms
- 2475 rooms
- 1316 rooms
- 617 rooms
- 228 rooms
- 159+ rooms

- Rooms in renter-occupied apartments in Dorsa <
> - 381 room
- 792 rooms
- 1123 rooms
- 1154 rooms
- 3025 rooms
- 776 rooms
- 517 rooms
- 08 rooms
- 59+ rooms
Owner-occupied
Renter-occupied
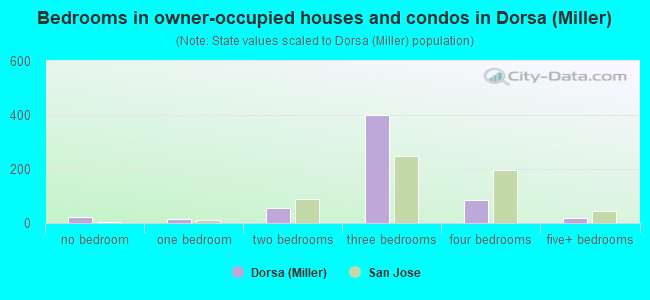
- Bedrooms in owner-occupied houses and condos in Dorsa <
> - 22no bedroom
- 131 bedroom
- 542 bedrooms
- 4013 bedrooms
- 864 bedrooms
- 195+ bedrooms
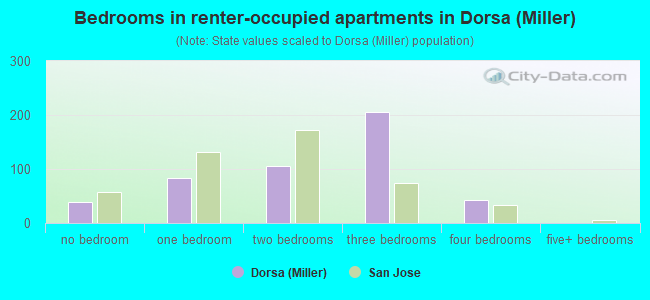
- Bedrooms in renter-occupied apartments in Dorsa <
> - 38no bedroom
- 831 bedroom
- 1052 bedrooms
- 2053 bedrooms
- 434 bedrooms
- 05+ bedrooms
Average number of cars or other vehicles available in houses/condos:
Average number of cars or other vehicles available in apartments:
| This neighborhood: | 3.4 |
| San Jose: | 2.3 |
Average number of cars or other vehicles available in apartments:
| Here: | 3.2 |
| city: | 1.6 |
Percentage of units with a mortgage:
| Dorsa (Miller): | 74.0% |
| San Jose: | 66.9% |
Average estimated value of detached houses in 2022 (79.2% of all units):
| Dorsa (Miller): | $724,681 |
| San Jose: | $1,532,815 |
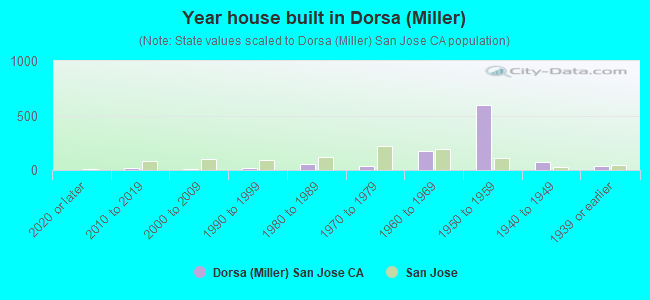
- Year house built in Dorsa <
> - 02020 or later
- 192010 to 2019
- 92000 to 2009
- 221990 to 1999
- 571980 to 1989
- 411970 to 1979
- 1711960 to 1969
- 5951950 to 1959
- 741940 to 1949
- 341939 or earlier
City-data.com crime index for city in 2020 (higher means more crime):
| City: | 268.4 |
| U.S. average: | 219.5 |
Travel time to work (commute)
![Travel time to work (commute)]()
- 33Less than 5 minutes
- 825 to 9 minutes
- 14310 to 14 minutes
- 34115 to 19 minutes
- 35320 to 24 minutes
- 19025 to 29 minutes
- 43430 to 34 minutes
- 9535 to 39 minutes
- 6640 to 44 minutes
- 5845 to 59 minutes
- 4160 to 89 minutes
- 3690 or more minutes

Means of transportation to work
![Means of transportation to work]()
- 75.7%1,613Drove a car alone
- 18.9%403Carpooled
- 1.1%23Bus
- 0.1%3Long-distance train or commuter rail
- 0.4%8Taxi
- 1.6%34Walked
- 1.1%24Other means
- 4.4%94Worked at home

Time leaving home to go to work
![Time leaving home to go to work]()
- 20212:00 a.m. to 4:59 a.m.
- 1685:00 a.m. to 5:29 a.m.
- 855:30 a.m. to 5:59 a.m.
- 1476:00 a.m. to 6:29 a.m.
- 1816:30 a.m. to 6:59 a.m.
- 2487:00 a.m. to 7:29 a.m.
- 2037:30 a.m. to 7:59 a.m.
- 2058:00 a.m. to 8:29 a.m.
- 198:30 a.m. to 8:59 a.m.
- 1629:00 a.m. to 9:59 a.m.
- 9210:00 a.m. to 10:59 a.m.
- 511:00 a.m. to 11:59 a.m.
- 9912:00 p.m. to 3:59 p.m.
- 394:00 p.m. to 11:59 p.m.

Occupations of males:
- Percentage of males in management occupations (except farmers):
Here: 5.3% city: 13.0%
- Percentage of males in business and financial operations occupations:
Here: 2.5% city: 4.6%
- Percentage of males in education, training, and library occupations:
Here: 3.2% city: 2.8%
- Percentage of males in service occupations:
Here: 25.3% city: 12.7%
- Percentage of males in sales and office occupations:
Here: 17.0% city: 12.8%
- Percentage of males in construction, extraction, and maintenance occupations:
Here: 25.4% city: 7.8%
- Percentage of males in production occupations:
Here: 11.9% city: 5.5%
- Percentage of males in transportation occupations:
Here: 3.5% city: 3.6%
Occupations of females:
- Percentage of females in management occupations (except farmers):
Here: 9.1% city: 11.0%
- Percentage of females in business and financial operations occupations:
Here: 7.0% city: 8.6%
- Percentage of females in community and social services occupations:
Here: 2.6% city: 1.8%
- Percentage of females in healthcare practitioners and technical occupations:
Here: 2.2% city: 6.8%
- Percentage of females in service occupations:
Here: 54.5% city: 21.7%
- Percentage of females in sales and office occupations:
Here: 14.0% city: 22.0%
- Percentage of females in production occupations:
Here: 6.1% city: 4.0%
- Percentage of females in material moving occupations:
Here: 2.0% city: 1.5%
Percentage of people 16-64 in Armed Forces:
| Dorsa (Miller): | 0.0% |
| San Jose: | 0.0% |
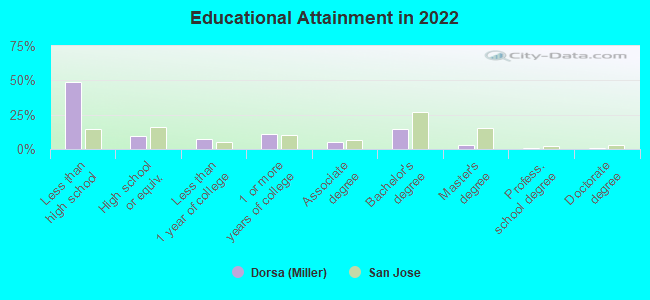
Education in this neighborhood (subdivision or community):
- Percentage of people 3 years and older in K-12 schools:
Dorsa (Miller): 20.7% San Jose: 16.1%
- Percentage of people 3 years and older in undergraduate colleges:
Dorsa (Miller): 14.3% San Jose: 6.5%
- Percentage of people 3 years and older in grad. or professional schools:
Dorsa (Miller): 1.5% San Jose: 2.0%
- Percentage of students K-12 enrolled in private schools:
Dorsa (Miller): 11.2% San Jose: 14.9%
Percentage of population below poverty level:
| Dorsa (Miller): | 10.2% |
| San Jose: | 9.0% |
Median year owner moved in (as recorded in 2022):
| Dorsa (Miller): | 2003 |
| San Jose: | 2008 |
Percentage of married-couple families with both working:
| Dorsa (Miller): | 91.3% |
| San Jose: | 72.5% |
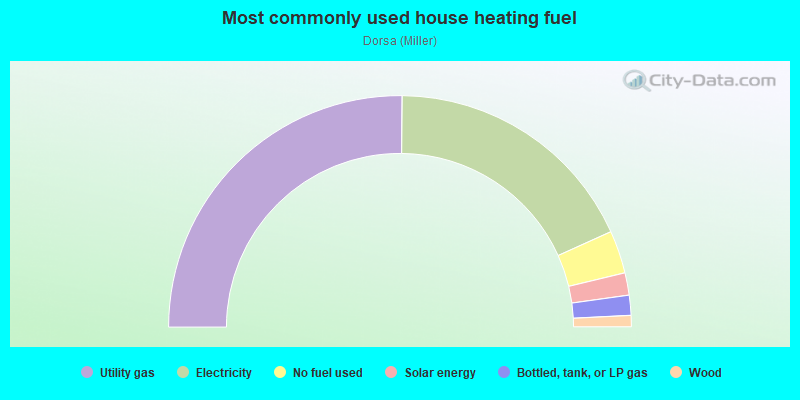
- 50.3%Utility gas
- 36.2%Electricity
- 6.0%No fuel used
- 3.1%Solar energy
- 2.8%Bottled, tank, or LP gas
- 1.6%Wood
Roads and streets:
Cathay Dr
Length: 0.66 miles
Directions: E-W, SE-NW
Address range: 1100 to 1749
Directions: E-W, SE-NW
Address range: 1100 to 1749
Bal Harbor Way
Length: 0.56 miles
Directions: E-W, SE-NW, SW-NE
Address range: 1100 to 1499
Directions: E-W, SE-NW, SW-NE
Address range: 1100 to 1499
Everglade Ave
Length: 0.35 miles
Directions: E-W, SW-NE
Address range: 1721 to 1999
Directions: E-W, SW-NE
Address range: 1721 to 1999
Biscayne Way
Length: 0.34 miles
Direction: SW-NE
Address range: 1723 to 1999
Direction: SW-NE
Address range: 1723 to 1999
Orlando Dr
Length: 0.31 miles
Directions: N-S, SE-NW, SW-NE
Address range: 1300 to 1551
Directions: N-S, SE-NW, SW-NE
Address range: 1300 to 1551
Loyola Dr
Length: 0.28 miles
Direction: SW-NE
Address range: 1700 to 1999
Direction: SW-NE
Address range: 1700 to 1999
Seaview Dr
Length: 0.28 miles
Direction: SW-NE
Address range: 1700 to 1999
Direction: SW-NE
Address range: 1700 to 1999
la Porte Ave
Length: 0.28 miles
Directions: E-W, SE-NW, SW-NE
Address range: 1700 to 1899
Directions: E-W, SE-NW, SW-NE
Address range: 1700 to 1899
Cliffwood Dr
Length: 0.24 miles
Direction: SE-NW
Address range: 1300 to 1599
Direction: SE-NW
Address range: 1300 to 1599
Chiplay Dr
Length: 0.24 miles
Directions: E-W, SE-NW, SW-NE
Address range: 1300 to 1499
Directions: E-W, SE-NW, SW-NE
Address range: 1300 to 1499
Bermuda Way
Length: 0.22 miles
Direction: SE-NW
Address range: 1500 to 1751
Direction: SE-NW
Address range: 1500 to 1751
Palmview Way
Length: 0.22 miles
Direction: SE-NW
Address range: 1400 to 1599
Direction: SE-NW
Address range: 1400 to 1599
Palmwood Dr
Length: 0.21 miles
Directions: N-S, SE-NW, SW-NE
Address range: 1400 to 1499
Directions: N-S, SE-NW, SW-NE
Address range: 1400 to 1499
Story Rd
Length: 0.20 miles
Direction: SW-NE
Address range: 1847 to 1999
Direction: SW-NE
Address range: 1847 to 1999
Decatur Dr
Length: 0.18 miles
Direction: SW-NE
Address range: 1800 to 1999
Direction: SW-NE
Address range: 1800 to 1999
Mandarin Way
Length: 0.18 miles
Direction: SW-NE
Address range: 1800 to 1999
Direction: SW-NE
Address range: 1800 to 1999
Naples Dr
Length: 0.18 miles
Directions: E-W, SW-NE
Address range: 1800 to 1999
Directions: E-W, SW-NE
Address range: 1800 to 1999
Cortez Ave
Length: 0.14 miles
Direction: SW-NE
Address range: 1700 to 1899
Direction: SW-NE
Address range: 1700 to 1899