Downtown neighborhood in El Segundo, California (CA), 90245 detailed profile
Settings
X


Business Search - 14 Million verified businesses
Area: 0.307 square miles
Population: 2,683
Population density:
| Downtown: | 8,734 people per square mile |
| El Segundo: | 3,084 people per square mile |

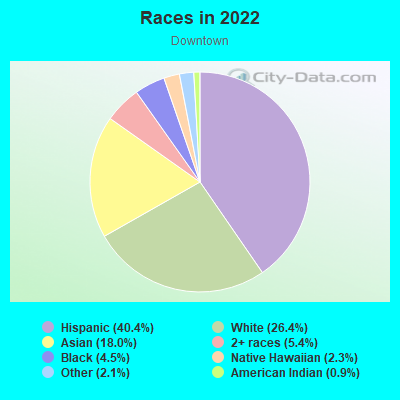
- 1,63459.2%White
- 48917.7%Hispanic or Latino
- 30311.0%Asian
- 1886.8%Two or more races
- 1114.0%Black
- 180.7%American Indian
- 160.6%Some other race
Median household income in 2022:
| Downtown: | $133,941 |
| El Segundo: | $142,596 |
Distribution of median household income
![Distribution of median household income]()
- 59Less than $10,000
- 91$10,000 to $19,999
- 31$20,000 to $29,999
- 102$30,000 to $39,999
- 33$40,000 to $49,999
- 97$50,000 to $59,999
- 95$60,000 to $74,999
- 137$75,000 to $99,999
- 106$100,000 to $124,999
- 142$125,000 to $149,999
- 176$150,000 to $199,999
- 400$200,000 or more

Distribution of owner-occupied house/condo value
![Distribution of owner-occupied house/condo value]()
- 30Less than $50,000
- 27$50,000 to $99,999
- 10$150,000 to $199,999
- 8$250,000 to $299,999
- 40$400,000 to $499,999
- 22$500,000 to $749,999
- 63$750,000 to $999,999
- 376$1,000,000 or more

Distribution of rent paid by renters
![Distribution of rent paid by renters]()
- 38$900 to $999
- 64$1,000 to $1,249
- 69$1,250 to $1,499
- 155$1,500 to $1,999
- 722$2,000 or more

Median rent in 2022:
| Downtown: | $2,525 |
| El Segundo: | $2,001 |
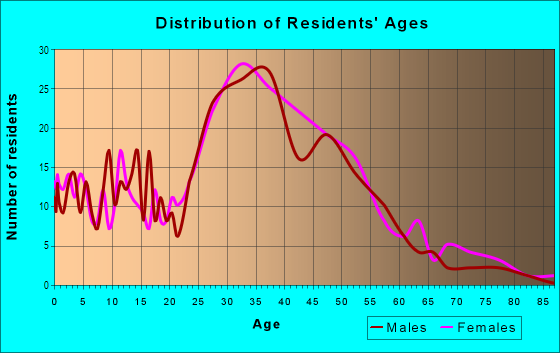
| Males: | 1,488 |
| Females: | 1,194 |
Males:
| This neighborhood: | 42.0 years |
| Whole city: | 35.9 years |
| This neighborhood: | 34.2 years |
| Whole city: | 36.8 years |
Average household size:
| Downtown: | 13.4 people |
| El Segundo: | 2.4 people |
Percentage of family households:
| Downtown: | 41.9% |
| El Segundo: | 45.9% |
| Here: | 38.9% |
| El Segundo: | 47.5% |
Percentage of married-couple families with children (among all households):
| Downtown: | 35.0% |
| El Segundo: | 34.4% |
Percentage of single-mother households (among all households):
| Downtown: | 4.2% |
| El Segundo: | 3.5% |
Percentage of never married males 15 years old and over:
Percentage of never married females 15 years old and over:
| Downtown: | 25.3% |
| El Segundo: | 18.7% |
Percentage of never married females 15 years old and over:
| Downtown: | 15.3% |
| city: | 15.5% |
Percentage of people that speak English not well or not at all:
| Downtown: | 0.5% |
| El Segundo: | 0.8% |
Percentage of people born in this state:
Percentage of people born in another U.S. state:
Percentage of native residents but born outside the U.S.:
Percentage of foreign born residents:
| Here: | 60.3% |
| El Segundo: | 61.8% |
Percentage of people born in another U.S. state:
| Downtown: | 24.8% |
| El Segundo: | 24.1% |
Percentage of native residents but born outside the U.S.:
| Here: | 1.7% |
| city: | 2.1% |
Percentage of foreign born residents:
| Here: | 13.2% |
| El Segundo: | 12.0% |
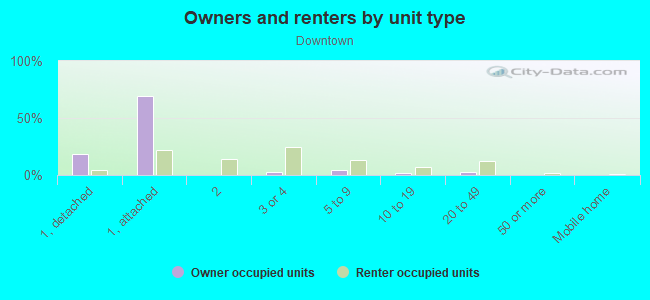
Owner-occupied
Renter-occupied

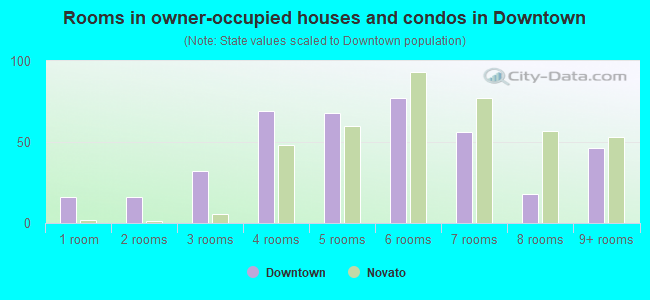
- Rooms in owner-occupied houses and condos in Downtown
- 01 room
- 232 rooms
- 143 rooms
- 624 rooms
- 365 rooms
- 766 rooms
- 657 rooms
- 1648 rooms
- 619+ rooms
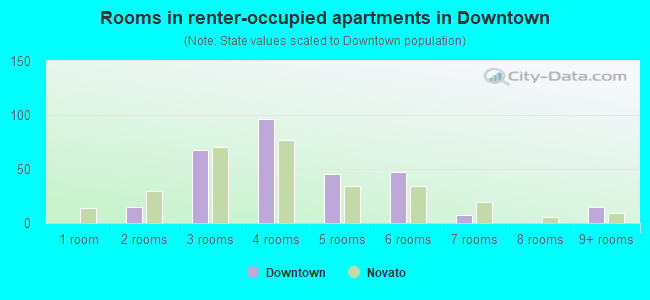
- Rooms in renter-occupied apartments in Downtown
- 721 room
- 472 rooms
- 2163 rooms
- 4054 rooms
- 1095 rooms
- 536 rooms
- 657 rooms
- 208 rooms
- 149+ rooms
Owner-occupied
Renter-occupied
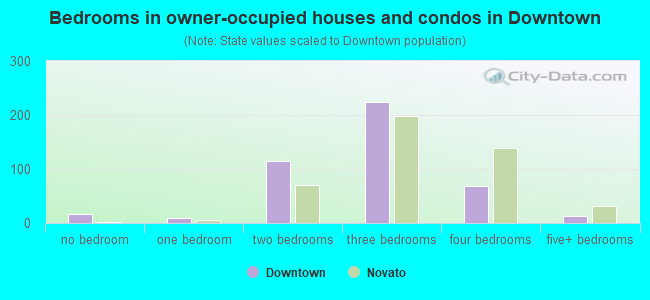
- Bedrooms in owner-occupied houses and condos in Downtown
- 0no bedroom
- 201 bedroom
- 912 bedrooms
- 1633 bedrooms
- 1464 bedrooms
- 925+ bedrooms
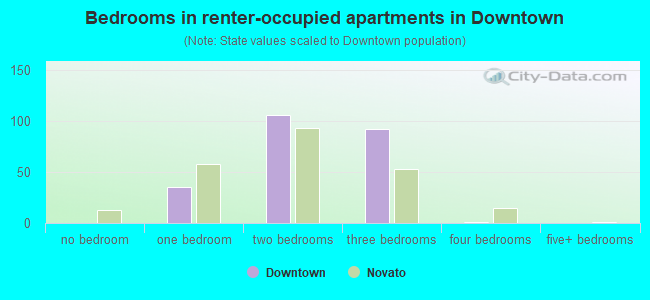
- Bedrooms in renter-occupied apartments in Downtown
- 74no bedroom
- 1971 bedroom
- 5262 bedrooms
- 1283 bedrooms
- 264 bedrooms
- 05+ bedrooms
Average number of cars or other vehicles available in houses/condos:
Average number of cars or other vehicles available in apartments:
| This neighborhood: | 3.2 |
| El Segundo: | 2.2 |
Average number of cars or other vehicles available in apartments:
| Here: | 1.4 |
| city: | 1.6 |
Percentage of units with a mortgage:
| Downtown: | 78.7% |
| El Segundo: | 76.7% |
Housing prices:
- Average estimated value of detached houses in 2022 (29.8% of all units):
Downtown: $1,535,895 California: $988,808
- Average estimated '22 value of housing units in 5-or-more-unit structures (6.1% of all units):
Downtown: $568,196 California: $730,996
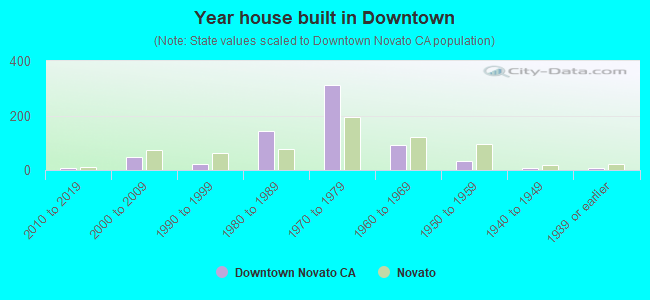
- Year house built in Downtown
- 02020 or later
- 222010 to 2019
- 1012000 to 2009
- 1111990 to 1999
- 1521980 to 1989
- 1271970 to 1979
- 3221960 to 1969
- 2461950 to 1959
- 1461940 to 1949
- 1691939 or earlier
City-data.com crime index for city in 2020 (higher means more crime):
| City: | 451.3 |
| U.S. average: | 219.5 |
Travel time to work (commute)
![Travel time to work (commute)]()
- 33Less than 5 minutes
- 1185 to 9 minutes
- 19010 to 14 minutes
- 17015 to 19 minutes
- 16320 to 24 minutes
- 8825 to 29 minutes
- 8330 to 34 minutes
- 435 to 39 minutes
- 2240 to 44 minutes
- 13945 to 59 minutes
- 8660 to 89 minutes
- 1090 or more minutes

Means of transportation to work
![Means of transportation to work]()
- 59.4%1,017Drove a car alone
- 1.1%18Carpooled
- 1.5%25Motorcycle
- 2.0%35Bicycle
- 5.3%90Walked
- 1.5%25Other means
- 32.3%554Worked at home

Time leaving home to go to work
![Time leaving home to go to work]()
- 3312:00 a.m. to 4:59 a.m.
- 305:00 a.m. to 5:29 a.m.
- 425:30 a.m. to 5:59 a.m.
- 666:00 a.m. to 6:29 a.m.
- 716:30 a.m. to 6:59 a.m.
- 1277:00 a.m. to 7:29 a.m.
- 1357:30 a.m. to 7:59 a.m.
- 2398:00 a.m. to 8:29 a.m.
- 638:30 a.m. to 8:59 a.m.
- 1449:00 a.m. to 9:59 a.m.
- 2710:00 a.m. to 10:59 a.m.
- 1311:00 a.m. to 11:59 a.m.
- 4812:00 p.m. to 3:59 p.m.
- 284:00 p.m. to 11:59 p.m.

Occupations of males:
- Percentage of males in management occupations (except farmers):
Here: 17.3% city: 15.3%
- Percentage of males in business and financial operations occupations:
Here: 9.9% city: 7.4%
- Percentage of males in computer and mathematical occupations:
Here: 4.5% city: 7.2%
- Percentage of males in architecture and engineering occupations:
Here: 9.7% city: 11.5%
- Percentage of males in community and social services occupations:
Here: 5.6% city: 3.6%
- Percentage of males in education, training, and library occupations:
Here: 1.2% city: 2.5%
- Percentage of males in arts, design, entertainment, sports, and media occupations:
Here: 18.5% city: 9.7%
- Percentage of males in healthcare practitioners and technical occupations:
Here: 6.3% city: 2.6%
- Percentage of males in service occupations:
Here: 4.8% city: 9.3%
- Percentage of males in sales and office occupations:
Here: 11.9% city: 13.2%
- Percentage of males in construction, extraction, and maintenance occupations:
Here: 1.3% city: 2.1%
- Percentage of males in material moving occupations:
Here: 1.5% city: 1.2%
Occupations of females:
- Percentage of females in management occupations (except farmers):
Here: 14.8% city: 15.2%
- Percentage of females in business and financial operations occupations:
Here: 18.9% city: 12.3%
- Percentage of females in computer and mathematical occupations:
Here: 1.6% city: 3.6%
- Percentage of females in legal occupations:
Here: 1.6% city: 3.2%
- Percentage of females in education, training, and library occupations:
Here: 11.9% city: 7.7%
- Percentage of females in arts, design, entertainment, sports, and media occupations:
Here: 4.9% city: 7.5%
- Percentage of females in healthcare practitioners and technical occupations:
Here: 6.7% city: 9.6%
- Percentage of females in service occupations:
Here: 10.6% city: 10.8%
- Percentage of females in sales and office occupations:
Here: 25.1% city: 22.0%
- Percentage of females in production occupations:
Here: 1.1% city: 0.7%
- Percentage of females in material moving occupations:
Here: 1.2% city: 1.0%
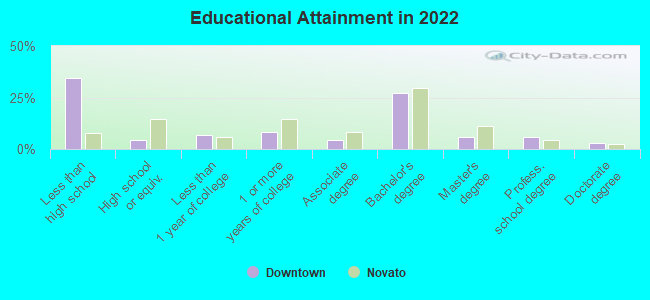
Education in this neighborhood (subdivision or community):
- Percentage of people 3 years and older in K-12 schools:
Downtown: 22.8% El Segundo: 17.1%
- Percentage of people 3 years and older in undergraduate colleges:
Downtown: 4.1% El Segundo: 4.3%
- Percentage of people 3 years and older in grad. or professional schools:
Downtown: 1.6% El Segundo: 2.4%
- Percentage of students K-12 enrolled in private schools:
Downtown: 29.8% El Segundo: 6.7%
Percentage of population below poverty level:
| Downtown: | 5.5% |
| El Segundo: | 4.7% |
Median year renter moved in (as recorded in 2022):
| Downtown: | 2015 |
| El Segundo: | 2016 |
Percentage of married-couple families with both working:
| Downtown: | 102.9% |
| El Segundo: | 75.9% |

- 72.0%Utility gas
- 19.6%Electricity
- 4.9%No fuel used
- 2.2%Wood
- 1.4%Bottled, tank, or LP gas
Roads and streets:
Eucalyptus Dr
Length: 0.56 miles
Direction: N-S
Address range: 100 to 699
Direction: N-S
Address range: 100 to 699
Richmond St
Length: 0.51 miles
Direction: N-S
Address range: 100 to 615
Direction: N-S
Address range: 100 to 615
Main St
Length: 0.50 miles
Direction: N-S
Address range: 100 to 599
Direction: N-S
Address range: 100 to 599
Standard St
Length: 0.50 miles
Direction: N-S
Address range: 100 to 599
Direction: N-S
Address range: 100 to 599
Virginia St
Length: 0.50 miles
Direction: N-S
Address range: 100 to 599
Direction: N-S
Address range: 100 to 599
Concord St
Length: 0.50 miles
Direction: N-S
Address range: 100 to 599
Direction: N-S
Address range: 100 to 599
Arena St
Length: 0.37 miles
Direction: N-S
Address range: 100 to 699
Direction: N-S
Address range: 100 to 699
E Pine Ave
Length: 0.29 miles
Direction: E-W
Address range: 100 to 449
Direction: E-W
Address range: 100 to 449
E el Segundo Blvd
Length: 0.29 miles
Direction: E-W
Address range: 100 to 449
Direction: E-W
Address range: 100 to 449
E Mariposa Ave
Length: 0.29 miles
Direction: E-W
Address range: 100 to 449
Direction: E-W
Address range: 100 to 449
E Franklin Ave
Length: 0.29 miles
Direction: E-W
Address range: 100 to 449
Direction: E-W
Address range: 100 to 449
E Grand Ave
Length: 0.25 miles
Direction: E-W
Address range: 100 to 399
Direction: E-W
Address range: 100 to 399
W el Segundo Blvd
Length: 0.24 miles
Directions: E-W, SE-NW
Address range: 300 to 399
Directions: E-W, SE-NW
Address range: 300 to 399
W Franklin Ave
Length: 0.24 miles
Direction: E-W
Address range: 100 to 399
Direction: E-W
Address range: 100 to 399
W Mariposa Ave
Length: 0.24 miles
Direction: E-W
Address range: 100 to 399
Direction: E-W
Address range: 100 to 399
W Pine Ave
Length: 0.24 miles
Direction: E-W
Address range: 100 to 399
Direction: E-W
Address range: 100 to 399
W Grand Ave
Length: 0.24 miles
Direction: E-W
Address range: 100 to 399
Direction: E-W
Address range: 100 to 399
W Holly Ave
Length: 0.24 miles
Direction: E-W
Address range: 100 to 399
Direction: E-W
Address range: 100 to 399
E Holly Ave
Length: 0.17 miles
Direction: E-W
Address range: 100 to 299
Direction: E-W
Address range: 100 to 299
Binder Pl
Length: 0.07 miles
Direction: N-S
Direction: N-S