East Santa Clara Street neighborhood in San Jose, California (CA), 95112, 95116 detailed profile
Settings
X

Business Search - 14 Million verified businesses
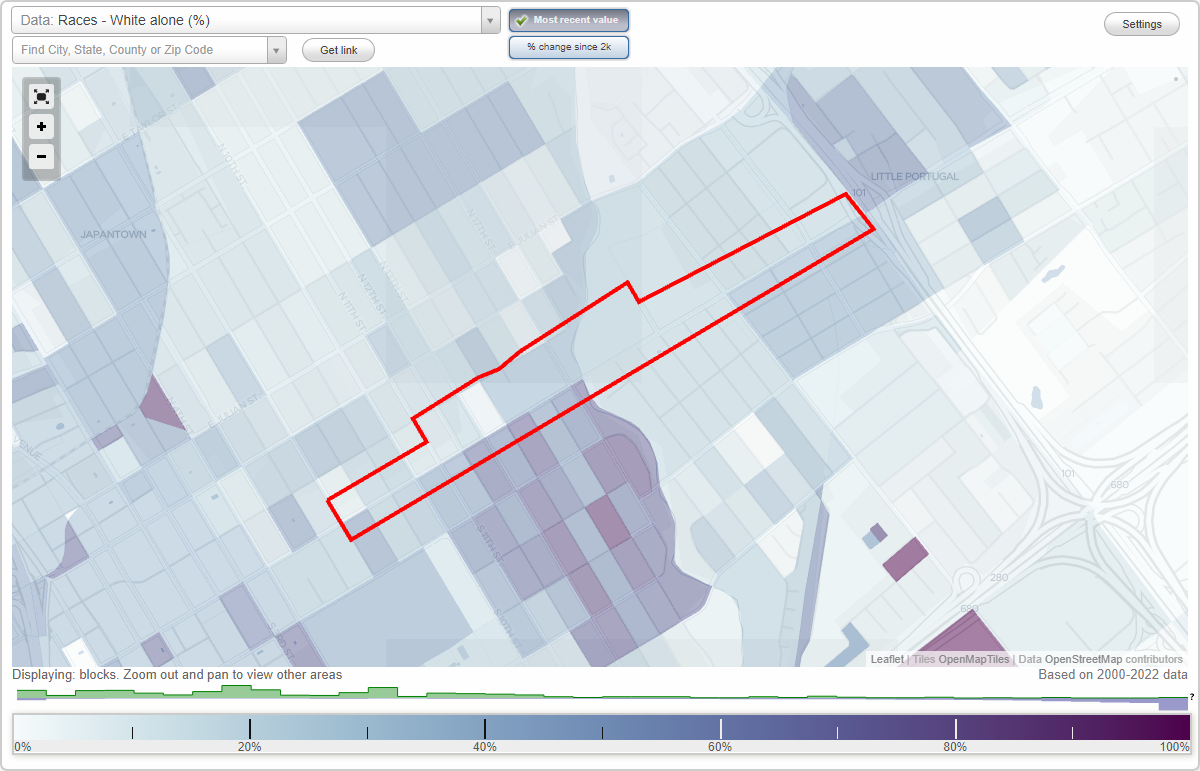
Area: 0.202 square miles
Population: 2,586
Population density:
| East Santa Clara Street: | 12,789 people per square mile |
| San Jose: | 5,554 people per square mile |

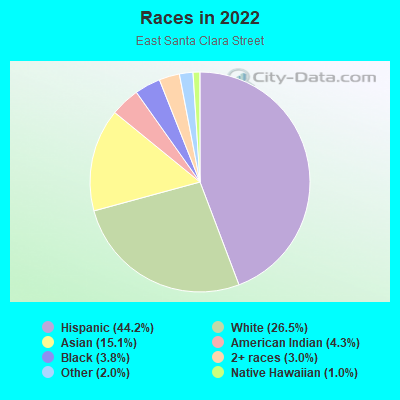
- 1,21944.2%Hispanic or Latino
- 73226.5%White
- 41715.1%Asian
- 1194.3%American Indian
- 1063.8%Black
- 823.0%Two or more races
- 552.0%Some other race
- 281.0%Native Hawaiian and Other
Pacific Islander
Distribution of median household income
![Distribution of median household income]()
- 51Less than $10,000
- 107$10,000 to $19,999
- 137$20,000 to $29,999
- 77$30,000 to $39,999
- 137$40,000 to $49,999
- 43$50,000 to $59,999
- 101$60,000 to $74,999
- 107$75,000 to $99,999
- 82$100,000 to $124,999
- 120$125,000 to $149,999
- 128$150,000 to $199,999
- 105$200,000 or more

Distribution of owner-occupied house/condo value
![Distribution of owner-occupied house/condo value]()
- 63$200,000 to $249,999
- 26$400,000 to $499,999
- 25$500,000 to $749,999
- 89$750,000 to $999,999
- 172$1,000,000 or more

Distribution of rent paid by renters
![Distribution of rent paid by renters]()
- 88Less than $100
- 12$100 to $199
- 119$200 to $299
- 120$300 to $399
- 61$400 to $499
- 82$500 to $599
- 26$600 to $699
- 35$700 to $799
- 16$800 to $899
- 86$900 to $999
- 101$1,000 to $1,249
- 194$1,250 to $1,499
- 157$1,500 to $1,999
- 223$2,000 or more

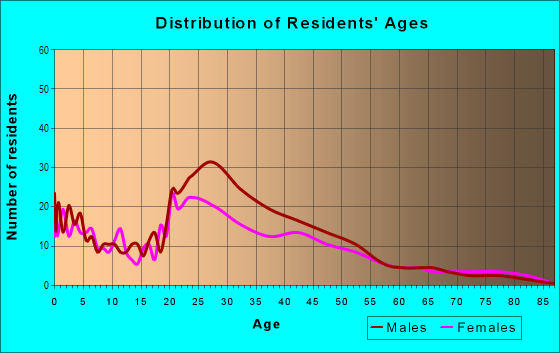
| Males: | 1,400 |
| Females: | 1,186 |
Males:
| This neighborhood: | 28.8 years |
| Whole city: | 37.6 years |
| This neighborhood: | 29.5 years |
| Whole city: | 39.1 years |
Average household size:
| East Santa Clara Street: | 2.9 people |
| San Jose: | 2.9 people |
Percentage of family households:
| East Santa Clara Street: | 34.4% |
| San Jose: | 49.9% |
| Here: | 24.1% |
| San Jose: | 53.0% |
Percentage of married-couple families with children (among all households):
| East Santa Clara Street: | 24.4% |
| San Jose: | 25.8% |
Percentage of single-mother households (among all households):
| East Santa Clara Street: | 12.5% |
| San Jose: | 5.2% |
Percentage of never married males 15 years old and over:
Percentage of never married females 15 years old and over:
| East Santa Clara Street: | 36.3% |
| San Jose: | 20.9% |
Percentage of never married females 15 years old and over:
| East Santa Clara Street: | 22.5% |
| city: | 16.7% |
Percentage of people that speak English not well or not at all:
| East Santa Clara Street: | 8.3% |
| San Jose: | 11.4% |
Percentage of people born in this state:
Percentage of people born in another U.S. state:
Percentage of native residents but born outside the U.S.:
Percentage of foreign born residents:
| Here: | 52.2% |
| San Jose: | 46.1% |
Percentage of people born in another U.S. state:
| East Santa Clara Street: | 17.4% |
| San Jose: | 10.4% |
Percentage of native residents but born outside the U.S.:
| Here: | 3.3% |
| city: | 1.7% |
Percentage of foreign born residents:
| Here: | 27.1% |
| San Jose: | 41.8% |
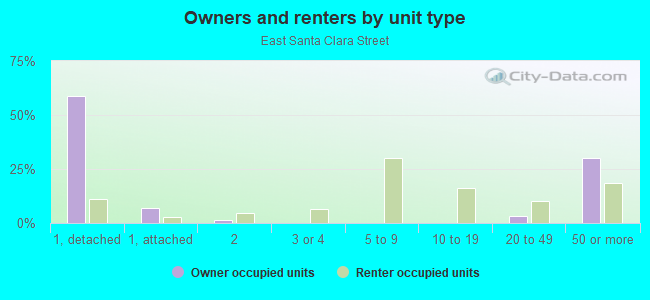
Owner-occupied
Renter-occupied

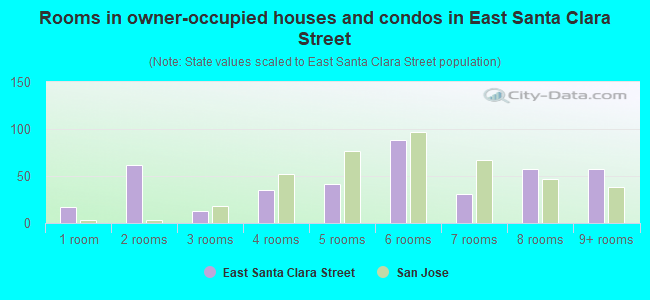
- Rooms in owner-occupied houses and condos in East Santa Clara Street
- 171 room
- 622 rooms
- 133 rooms
- 354 rooms
- 415 rooms
- 886 rooms
- 317 rooms
- 578 rooms
- 579+ rooms
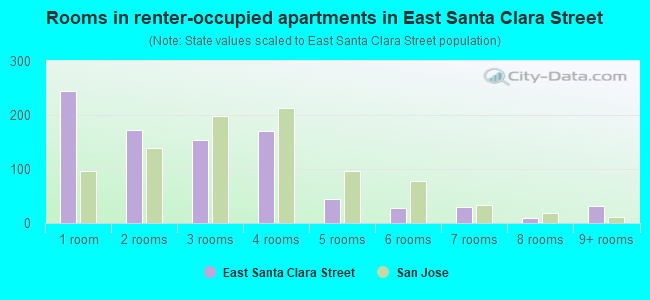
- Rooms in renter-occupied apartments in East Santa Clara Street
- 2441 room
- 1732 rooms
- 1543 rooms
- 1704 rooms
- 445 rooms
- 286 rooms
- 297 rooms
- 108 rooms
- 329+ rooms
Owner-occupied
Renter-occupied
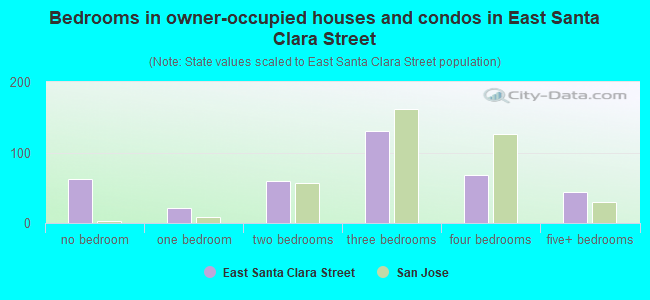
- Bedrooms in owner-occupied houses and condos in East Santa Clara Street
- 62no bedroom
- 211 bedroom
- 592 bedrooms
- 1303 bedrooms
- 684 bedrooms
- 445+ bedrooms
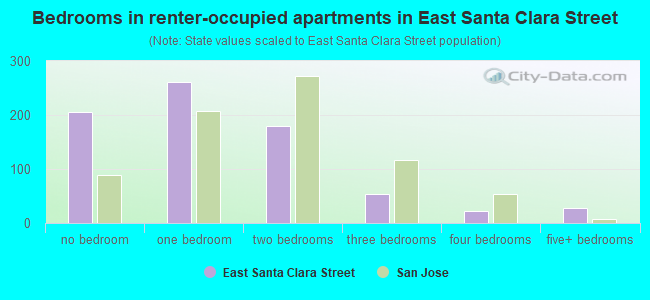
- Bedrooms in renter-occupied apartments in East Santa Clara Street
- 205no bedroom
- 2611 bedroom
- 1802 bedrooms
- 533 bedrooms
- 224 bedrooms
- 285+ bedrooms
Average number of cars or other vehicles available in houses/condos:
Average number of cars or other vehicles available in apartments:
| This neighborhood: | 2.5 |
| San Jose: | 2.3 |
Average number of cars or other vehicles available in apartments:
| Here: | 1.6 |
| city: | 1.6 |
Percentage of units with a mortgage:
| East Santa Clara Street: | 68.9% |
| San Jose: | 66.9% |
Average estimated value of detached houses in 2022 (36.4% of all units):
| East Santa Clara Street: | $1,154,378 |
| San Jose: | $1,532,815 |
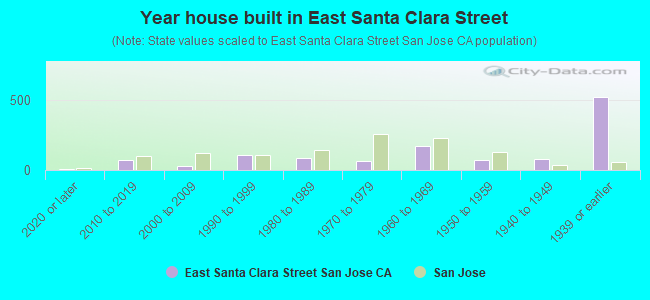
- Year house built in East Santa Clara Street
- 52020 or later
- 722010 to 2019
- 322000 to 2009
- 1041990 to 1999
- 871980 to 1989
- 681970 to 1979
- 1711960 to 1969
- 711950 to 1959
- 771940 to 1949
- 5211939 or earlier
City-data.com crime index for city in 2020 (higher means more crime):
| City: | 268.4 |
| U.S. average: | 219.5 |
Travel time to work (commute)
![Travel time to work (commute)]()
- 15Less than 5 minutes
- 765 to 9 minutes
- 14210 to 14 minutes
- 26415 to 19 minutes
- 20520 to 24 minutes
- 6725 to 29 minutes
- 13330 to 34 minutes
- 2135 to 39 minutes
- 5840 to 44 minutes
- 10145 to 59 minutes
- 10360 to 89 minutes
- 3790 or more minutes

Means of transportation to work
![Means of transportation to work]()
- 60.1%842Drove a car alone
- 7.6%106Carpooled
- 5.7%80Bus
- 0.7%10Subway or elevated rail
- 5.1%72Long-distance train or commuter rail
- 1.3%18Light rail, streetcar or trolley
- 2.2%31Taxi
- 0.4%5Motorcycle
- 3.8%53Bicycle
- 7.9%111Walked
- 1.4%20Other means
- 16.8%235Worked at home

Time leaving home to go to work
![Time leaving home to go to work]()
- 2312:00 a.m. to 4:59 a.m.
- 445:00 a.m. to 5:29 a.m.
- 365:30 a.m. to 5:59 a.m.
- 366:00 a.m. to 6:29 a.m.
- 1566:30 a.m. to 6:59 a.m.
- 1567:00 a.m. to 7:29 a.m.
- 1457:30 a.m. to 7:59 a.m.
- 1288:00 a.m. to 8:29 a.m.
- 1128:30 a.m. to 8:59 a.m.
- 1209:00 a.m. to 9:59 a.m.
- 6610:00 a.m. to 10:59 a.m.
- 1511:00 a.m. to 11:59 a.m.
- 9512:00 p.m. to 3:59 p.m.
- 604:00 p.m. to 11:59 p.m.

Occupations of males:
- Percentage of males in management occupations (except farmers):
Here: 15.4% city: 13.0%
- Percentage of males in business and financial operations occupations:
Here: 3.0% city: 4.6%
- Percentage of males in computer and mathematical occupations:
Here: 11.2% city: 13.6%
- Percentage of males in architecture and engineering occupations:
Here: 6.2% city: 10.2%
- Percentage of males in community and social services occupations:
Here: 3.5% city: 0.8%
- Percentage of males in education, training, and library occupations:
Here: 3.9% city: 2.8%
- Percentage of males in arts, design, entertainment, sports, and media occupations:
Here: 6.9% city: 1.8%
- Percentage of males in healthcare practitioners and technical occupations:
Here: 1.8% city: 2.0%
- Percentage of males in service occupations:
Here: 16.5% city: 12.7%
- Percentage of males in sales and office occupations:
Here: 8.3% city: 12.8%
- Percentage of males in construction, extraction, and maintenance occupations:
Here: 5.4% city: 7.8%
- Percentage of males in production occupations:
Here: 3.7% city: 5.5%
- Percentage of males in material moving occupations:
Here: 8.0% city: 3.1%
Occupations of females:
- Percentage of females in management occupations (except farmers):
Here: 5.1% city: 11.0%
- Percentage of females in business and financial operations occupations:
Here: 2.9% city: 8.6%
- Percentage of females in computer and mathematical occupations:
Here: 4.1% city: 5.4%
- Percentage of females in life, physical, and social science occupations:
Here: 3.2% city: 1.7%
- Percentage of females in community and social services occupations:
Here: 2.5% city: 1.8%
- Percentage of females in education, training, and library occupations:
Here: 4.8% city: 8.1%
- Percentage of females in arts, design, entertainment, sports, and media occupations:
Here: 5.3% city: 2.0%
- Percentage of females in healthcare practitioners and technical occupations:
Here: 4.5% city: 6.8%
- Percentage of females in service occupations:
Here: 23.0% city: 21.7%
- Percentage of females in sales and office occupations:
Here: 29.2% city: 22.0%
- Percentage of females in farming, fishing, and forestry occupations:
Here: 6.4% city: 0.2%
- Percentage of females in production occupations:
Here: 6.1% city: 4.0%
- Percentage of females in material moving occupations:
Here: 5.8% city: 1.5%
Percentage of people 16-64 in Armed Forces:
| East Santa Clara Street: | 0.1% |
| San Jose: | 0.0% |
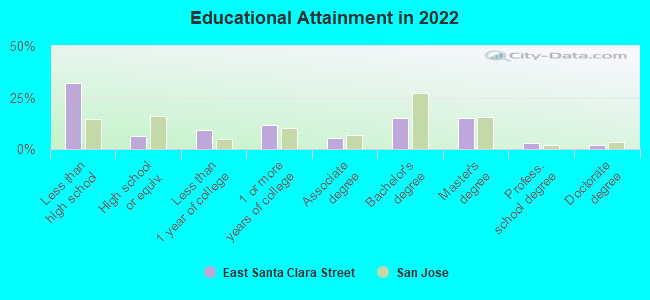
Education in this neighborhood (subdivision or community):
- Percentage of people 3 years and older in K-12 schools:
East Santa Clara Street: 24.7% San Jose: 16.1%
- Percentage of people 3 years and older in undergraduate colleges:
East Santa Clara Street: 18.5% San Jose: 6.5%
- Percentage of people 3 years and older in grad. or professional schools:
East Santa Clara Street: 4.8% San Jose: 2.0%
- Percentage of students K-12 enrolled in private schools:
East Santa Clara Street: 49.7% San Jose: 14.9%
Percentage of population below poverty level:
| East Santa Clara Street: | 17.2% |
| San Jose: | 9.0% |
Median year renter moved in (as recorded in 2022):
| East Santa Clara Street: | 2015 |
| San Jose: | 2020 |
Percentage of married-couple families with both working:
| East Santa Clara Street: | 159.6% |
| San Jose: | 72.5% |
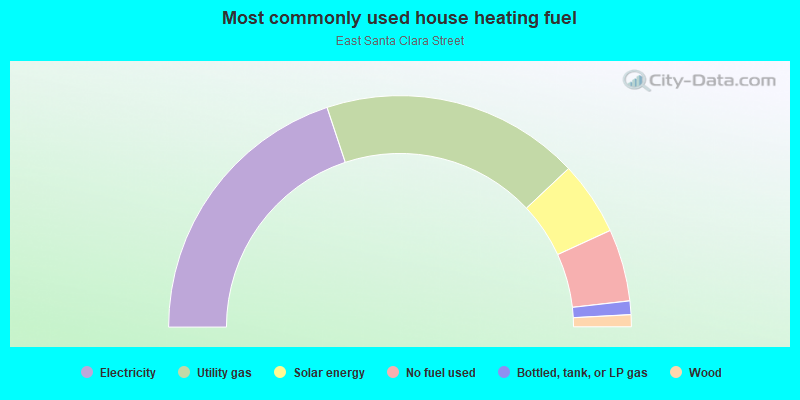
- 39.8%Electricity
- 36.2%Utility gas
- 10.3%Solar energy
- 10.1%No fuel used
- 1.9%Bottled, tank, or LP gas
- 1.7%Wood
Roads and streets:
E Santa Clara St
Length: 1.59 miles
Directions: E-W, SW-NE
Address range: 350 to 1449
Directions: E-W, SW-NE
Address range: 350 to 1449
E St John St
Length: 0.28 miles
Directions: N-S, SW-NE
Address range: 551 to 898
Directions: N-S, SW-NE
Address range: 551 to 898
N 13th St
Length: 0.13 miles
Direction: SE-NW
Address range: 1 to 99
Direction: SE-NW
Address range: 1 to 99
N 14th St
Length: 0.13 miles
Direction: SE-NW
Address range: 1 to 99
Direction: SE-NW
Address range: 1 to 99
N 17th St
Length: 0.13 miles
Direction: SE-NW
Address range: 1 to 99
Direction: SE-NW
Address range: 1 to 99
N 12th St
Length: 0.13 miles
Direction: SE-NW
Address range: 1 to 99
Direction: SE-NW
Address range: 1 to 99
Elizabeth St
Length: 0.08 miles
Direction: SW-NE
Address range: 400 to 499
Direction: SW-NE
Address range: 400 to 499
N 20th St
Length: 0.08 miles
Direction: SE-NW
Address range: 1 to 99
Direction: SE-NW
Address range: 1 to 99
S 10th St
Length: 0.05 miles
Direction: SE-NW
Address range: 1 to 31
Direction: SE-NW
Address range: 1 to 31
S 9th St
Length: 0.05 miles
Direction: SE-NW
Address range: 1 to 39
Direction: SE-NW
Address range: 1 to 39
N 15th St
Length: 0.02 miles
Direction: SE-NW
Address range: 1 to 6
Direction: SE-NW
Address range: 1 to 6