Green River neighborhood in Corona, California (CA), 92880 detailed profile
Settings
X


Business Search - 14 Million verified businesses
Area: 0.367 square miles
Population: 994
Population density:
| Green River: | 2,708 people per square mile |
| Corona: | 4,539 people per square mile |

- 45946.0%White
- 25125.2%Hispanic or Latino
- 23923.9%Asian
- 272.7%Two or more races
- 111.1%Native Hawaiian and Other
Pacific Islander - 60.6%Some other race
- 50.5%Black

Median household income in 2022:
| Green River: | $136,478 |
| Corona: | $99,953 |
Distribution of median household income
![Distribution of median household income]()
- 13$10,000 to $19,999
- 8$20,000 to $29,999
- 9$30,000 to $39,999
- 22$40,000 to $49,999
- 13$50,000 to $59,999
- 20$60,000 to $74,999
- 42$75,000 to $99,999
- 42$100,000 to $124,999
- 28$125,000 to $149,999
- 71$150,000 to $199,999
- 73$200,000 or more

Distribution of owner-occupied house/condo value
![Distribution of owner-occupied house/condo value]()
- 19Less than $50,000
- 34$50,000 to $99,999
- 18$100,000 to $149,999
- 29$200,000 to $249,999
- 4$250,000 to $299,999
- 14$300,000 to $399,999
- 75$400,000 to $499,999
- 180$500,000 to $749,999
- 89$750,000 to $999,999
- 20$1,000,000 or more

Distribution of rent paid by renters
![Distribution of rent paid by renters]()
- 8$200 to $299
- 16$2,000 or more

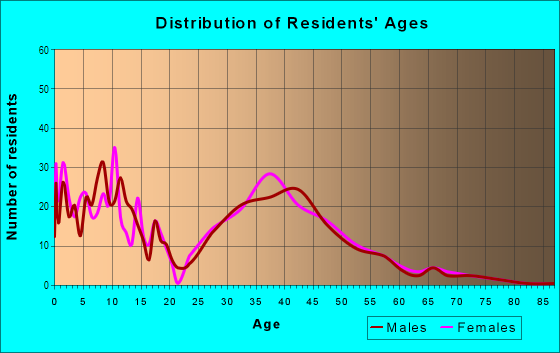
| Males: | 516 |
| Females: | 478 |
Males:
| This neighborhood: | 38.7 years |
| Whole city: | 32.2 years |
| This neighborhood: | 40.0 years |
| Whole city: | 38.1 years |
Average household size:
| Green River: | 21.5 people |
| Corona: | 3.4 people |
Percentage of family households:
| Green River: | 53.7% |
| Corona: | 57.2% |
| Here: | 77.0% |
| Corona: | 58.1% |
Percentage of married-couple families with children (among all households):
| Green River: | 28.9% |
| Corona: | 22.8% |
Percentage of single-mother households (among all households):
| Green River: | 0.5% |
| Corona: | 5.2% |
Percentage of never married males 15 years old and over:
Percentage of never married females 15 years old and over:
| Green River: | 19.9% |
| Corona: | 18.9% |
Percentage of never married females 15 years old and over:
| Green River: | 12.2% |
| city: | 20.0% |
Percentage of people that speak English not well or not at all:
| Green River: | 1.7% |
| Corona: | 8.4% |
Percentage of people born in this state:
Percentage of people born in another U.S. state:
Percentage of native residents but born outside the U.S.:
Percentage of foreign born residents:
| Here: | 69.1% |
| Corona: | 66.3% |
Percentage of people born in another U.S. state:
| Green River: | 11.3% |
| Corona: | 7.8% |
Percentage of native residents but born outside the U.S.:
| Here: | 0.3% |
| city: | 1.4% |
Percentage of foreign born residents:
| Here: | 19.4% |
| Corona: | 24.5% |

Owner-occupied
Renter-occupied


- Rooms in owner-occupied houses and condos in Green River
- 01 room
- 02 rooms
- 03 rooms
- 204 rooms
- 465 rooms
- 826 rooms
- 527 rooms
- 398 rooms
- 669+ rooms

- Rooms in renter-occupied apartments in Green River
- 01 room
- 02 rooms
- 03 rooms
- 04 rooms
- 105 rooms
- 86 rooms
- 17 rooms
- 48 rooms
- 09+ rooms
Owner-occupied
Renter-occupied

- Bedrooms in owner-occupied houses and condos in Green River
- 0no bedroom
- 01 bedroom
- 122 bedrooms
- 1703 bedrooms
- 1224 bedrooms
- 155+ bedrooms

- Bedrooms in renter-occupied apartments in Green River
- 0no bedroom
- 01 bedroom
- 52 bedrooms
- 93 bedrooms
- 14 bedrooms
- 45+ bedrooms
Average number of cars or other vehicles available in houses/condos:
Average number of cars or other vehicles available in apartments:
| This neighborhood: | 3.9 |
| Corona: | 2.6 |
Average number of cars or other vehicles available in apartments:
| Here: | 4.3 |
| city: | 1.8 |
Percentage of units with a mortgage:
| Green River: | 74.9% |
| Corona: | 73.1% |
Average estimated value of detached houses in 2022 (100.0% of all units):
| Green River: | $691,141 |
| California: | $988,808 |

- Year house built in Green River
- 02020 or later
- 142010 to 2019
- 82000 to 2009
- 361990 to 1999
- 3361980 to 1989
- 81970 to 1979
- 201960 to 1969
- 1601950 to 1959
- 01940 to 1949
- 131939 or earlier

City-data.com crime index for city in 2020 (higher means more crime):
| City: | 160.4 |
| U.S. average: | 219.5 |
Travel time to work (commute)
![Travel time to work (commute)]()
- 9Less than 5 minutes
- 335 to 9 minutes
- 4610 to 14 minutes
- 5615 to 19 minutes
- 7220 to 24 minutes
- 2925 to 29 minutes
- 13630 to 34 minutes
- 4635 to 39 minutes
- 2040 to 44 minutes
- 6145 to 59 minutes
- 15460 to 89 minutes
- 1690 or more minutes

Means of transportation to work
![Means of transportation to work]()
- 89.9%466Drove a car alone
- 1.7%9Carpooled
- 0.2%1Walked
- 8.1%42Worked at home

Time leaving home to go to work
![Time leaving home to go to work]()
- 12812:00 a.m. to 4:59 a.m.
- 315:00 a.m. to 5:29 a.m.
- 195:30 a.m. to 5:59 a.m.
- 746:00 a.m. to 6:29 a.m.
- 576:30 a.m. to 6:59 a.m.
- 1327:00 a.m. to 7:29 a.m.
- 617:30 a.m. to 7:59 a.m.
- 408:00 a.m. to 8:29 a.m.
- 508:30 a.m. to 8:59 a.m.
- 239:00 a.m. to 9:59 a.m.
- 1110:00 a.m. to 10:59 a.m.
- 211:00 a.m. to 11:59 a.m.
- 6512:00 p.m. to 3:59 p.m.
- 194:00 p.m. to 11:59 p.m.

Occupations of males:
- Percentage of males in management occupations (except farmers):
Here: 16.2% city: 11.6%
- Percentage of males in business and financial operations occupations:
Here: 8.7% city: 4.3%
- Percentage of males in computer and mathematical occupations:
Here: 1.6% city: 4.5%
- Percentage of males in architecture and engineering occupations:
Here: 4.9% city: 3.0%
- Percentage of males in community and social services occupations:
Here: 1.3% city: 1.3%
- Percentage of males in education, training, and library occupations:
Here: 7.5% city: 2.3%
- Percentage of males in arts, design, entertainment, sports, and media occupations:
Here: 2.6% city: 2.4%
- Percentage of males in healthcare practitioners and technical occupations:
Here: 3.0% city: 2.8%
- Percentage of males in service occupations:
Here: 3.1% city: 14.3%
- Percentage of males in sales and office occupations:
Here: 20.7% city: 19.0%
- Percentage of males in construction, extraction, and maintenance occupations:
Here: 3.3% city: 8.3%
- Percentage of males in production occupations:
Here: 7.5% city: 7.7%
- Percentage of males in transportation occupations:
Here: 15.4% city: 6.6%
- Percentage of males in material moving occupations:
Here: 4.8% city: 6.0%
Occupations of females:
- Percentage of females in management occupations (except farmers):
Here: 8.3% city: 9.7%
- Percentage of females in business and financial operations occupations:
Here: 7.1% city: 7.1%
- Percentage of females in community and social services occupations:
Here: 2.7% city: 3.1%
- Percentage of females in legal occupations:
Here: 1.5% city: 1.2%
- Percentage of females in education, training, and library occupations:
Here: 8.8% city: 9.7%
- Percentage of females in arts, design, entertainment, sports, and media occupations:
Here: 1.9% city: 0.7%
- Percentage of females in healthcare practitioners and technical occupations:
Here: 36.7% city: 8.5%
- Percentage of females in service occupations:
Here: 13.5% city: 18.8%
- Percentage of females in sales and office occupations:
Here: 23.0% city: 30.9%
- Percentage of females in production occupations:
Here: 5.6% city: 3.8%
- Percentage of females in material moving occupations:
Here: 2.5% city: 3.1%
Education in this neighborhood (subdivision or community):
- Percentage of people 3 years and older in K-12 schools:
Green River: 16.8% Corona: 19.0%
- Percentage of people 3 years and older in undergraduate colleges:
Green River: 5.6% Corona: 7.2%
- Percentage of people 3 years and older in grad. or professional schools:
Green River: 4.3% Corona: 1.7%
- Percentage of students K-12 enrolled in private schools:
Green River: 3.1% Corona: 5.2%
Percentage of population below poverty level:
| Green River: | 2.4% |
| Corona: | 7.5% |
Median year owner moved in (as recorded in 2022):
| Green River: | 2004 |
| Corona: | 2011 |
Percentage of married-couple families with both working:
| Green River: | 66.6% |
| Corona: | 70.1% |

- 83.2%Utility gas
- 10.3%Electricity
- 3.7%Solar energy
- 2.1%Bottled, tank, or LP gas
- 0.7%No fuel used
Roads and streets:
Feather River Rd
Length: 0.51 miles
Directions: E-W, SE-NW, SW-NE
Address range: 4400 to 4899
Directions: E-W, SE-NW, SW-NE
Address range: 4400 to 4899
Pennyroyal Dr
Length: 0.50 miles
Directions: E-W, N-S, SE-NW, SW-NE
Address range: 4495 to 4799
Directions: E-W, N-S, SE-NW, SW-NE
Address range: 4495 to 4799
Golden Ridge Dr
Length: 0.49 miles
Directions: E-W, N-S, SE-NW, SW-NE
Address range: 4600 to 4899
Directions: E-W, N-S, SE-NW, SW-NE
Address range: 4600 to 4899
Chadwick Rd
Length: 0.47 miles
Directions: E-W, N-S, SE-NW, SW-NE
Address range: 11501 to 11798
Directions: E-W, N-S, SE-NW, SW-NE
Address range: 11501 to 11798
Prado Rd
Length: 0.45 miles
Directions: E-W, N-S, SE-NW
Address range: 4584 to 4798
Directions: E-W, N-S, SE-NW
Address range: 4584 to 4798
Crest Ridge Dr
Length: 0.29 miles
Directions: E-W, N-S, SE-NW
Address range: 11300 to 11399
Directions: E-W, N-S, SE-NW
Address range: 11300 to 11399
Norgate Cir
Length: 0.27 miles
Directions: E-W, N-S, SE-NW, SW-NE
Address range: 11500 to 11699
Directions: E-W, N-S, SE-NW, SW-NE
Address range: 11500 to 11699
Green River Rd
Length: 0.25 miles
Directions: N-S, SW-NE
Address range: 4732 to 4809
Directions: N-S, SW-NE
Address range: 4732 to 4809
Valley Glen Dr
Length: 0.21 miles
Directions: E-W, N-S, SE-NW, SW-NE
Address range: 4600 to 4799
Directions: E-W, N-S, SE-NW, SW-NE
Address range: 4600 to 4799
Ingram Dr
Length: 0.21 miles
Directions: E-W, SW-NE
Address range: 4900 to 4966
Directions: E-W, SW-NE
Address range: 4900 to 4966
American River Rd
Length: 0.19 miles
Directions: E-W, N-S, SE-NW, SW-NE
Address range: 11300 to 11499
Directions: E-W, N-S, SE-NW, SW-NE
Address range: 11300 to 11499
Moon Crest Dr
Length: 0.10 miles
Directions: E-W, SW-NE
Address range: 4800 to 4899
Directions: E-W, SW-NE
Address range: 4800 to 4899
Shadydale Ln
Length: 0.10 miles
Direction: E-W
Address range: 4900 to 5099
Direction: E-W
Address range: 4900 to 5099
Larchmont Dr
Length: 0.10 miles
Directions: N-S, SE-NW, SW-NE
Address range: 11500 to 11699
Directions: N-S, SE-NW, SW-NE
Address range: 11500 to 11699
Alder Creek Ave
Length: 0.10 miles
Directions: N-S, SE-NW, SW-NE
Address range: 11400 to 11499
Directions: N-S, SE-NW, SW-NE
Address range: 11400 to 11499
Foxglove Ln
Length: 0.08 miles
Directions: E-W, N-S, SE-NW
Address range: 11300 to 11499
Directions: E-W, N-S, SE-NW
Address range: 11300 to 11499
Satin Bell Dr
Length: 0.07 miles
Directions: E-W, N-S, SE-NW
Address range: 4700 to 4799
Directions: E-W, N-S, SE-NW
Address range: 4700 to 4799
Milbury Ct
Length: 0.05 miles
Direction: N-S
Address range: 11500 to 11599
Direction: N-S
Address range: 11500 to 11599
E Fork Rd
Length: 0.05 miles
Directions: N-S, SW-NE
Directions: N-S, SW-NE
Merry Hill Dr
Length: 0.05 miles
Directions: N-S, SW-NE
Address range: 11500 to 11599
Directions: N-S, SW-NE
Address range: 11500 to 11599
Hidden Oak Dr
Length: 0.03 miles
Directions: N-S, SW-NE
Directions: N-S, SW-NE
Railroad features:
at and Sf Rlwy
Length: 0.49 miles
Directions: E-W, SW-NE
Directions: E-W, SW-NE