Hamann Park neighborhood in San Jose, California (CA), 95128 detailed profile
Settings
X

Business Search - 14 Million verified businesses
Area: 0.264 square miles
Population: 970
Population density:
| Hamann Park: | 3,677 people per square mile |
| San Jose: | 5,554 people per square mile |

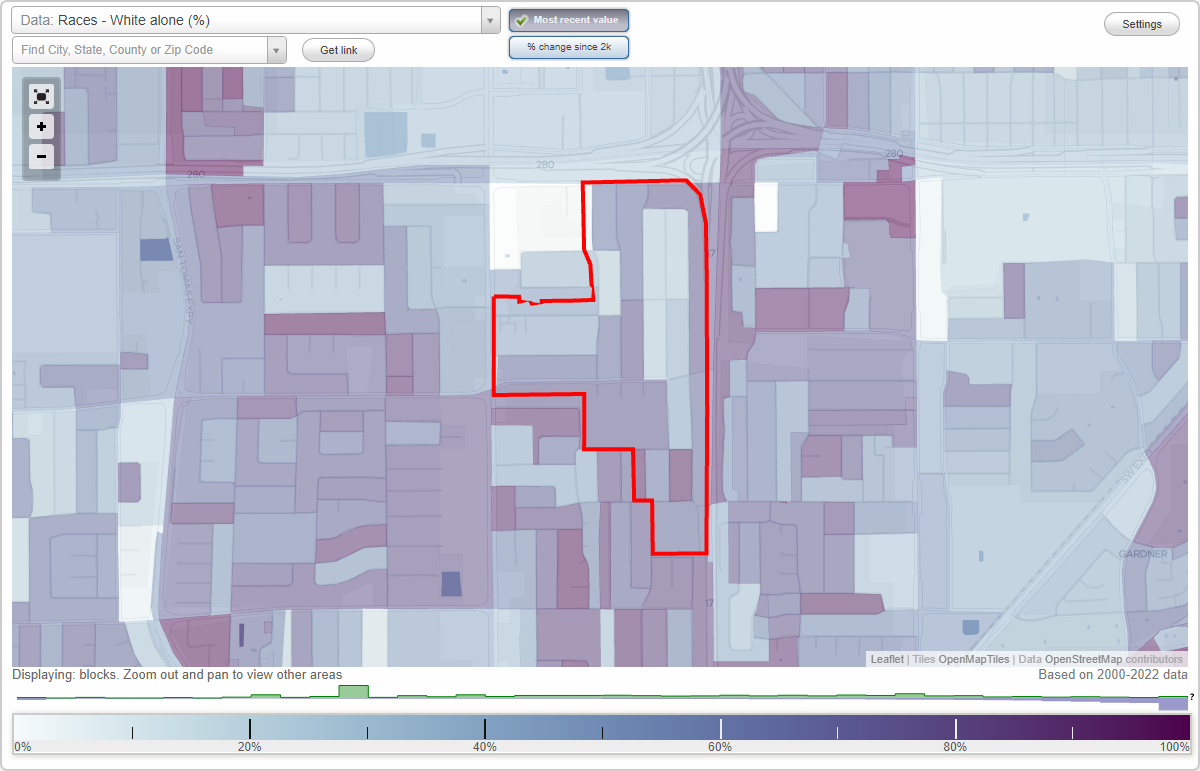
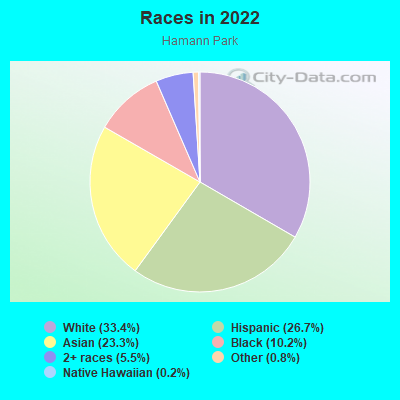
- 35033.4%White
- 28026.7%Hispanic or Latino
- 24423.3%Asian
- 10710.2%Black
- 585.5%Two or more races
- 80.8%Some other race
- 20.2%Native Hawaiian and Other
Pacific Islander
Median household income in 2022:
| Hamann Park: | $174,823 |
| San Jose: | $133,835 |
Distribution of median household income
![Distribution of median household income]()
- 27Less than $10,000
- 34$10,000 to $19,999
- 34$20,000 to $29,999
- 68$30,000 to $39,999
- 198$40,000 to $49,999
- 2$50,000 to $59,999
- 117$60,000 to $74,999
- 44$75,000 to $99,999
- 34$100,000 to $124,999
- 67$125,000 to $149,999
- 34$150,000 to $199,999
- 156$200,000 or more

Distribution of owner-occupied house/condo value
![Distribution of owner-occupied house/condo value]()
- 14Less than $50,000
- 161$100,000 to $149,999
- 5$400,000 to $499,999
- 3$500,000 to $749,999
- 124$750,000 to $999,999
- 331$1,000,000 or more

Distribution of rent paid by renters
![Distribution of rent paid by renters]()
- 23$300 to $399
- 6$400 to $499
- 13$500 to $599
- 82$1,250 to $1,499
- 48$1,500 to $1,999
- 204$2,000 or more

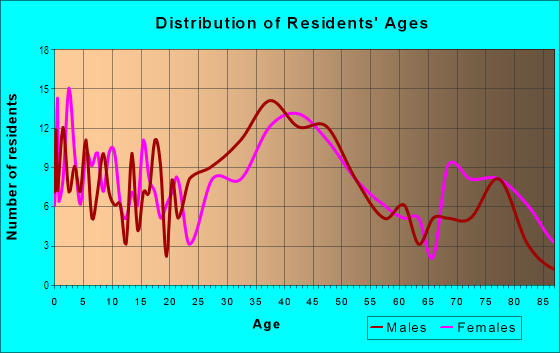
| Males: | 513 |
| Females: | 456 |
Males:
| This neighborhood: | 39.1 years |
| Whole city: | 37.6 years |
| This neighborhood: | 35.7 years |
| Whole city: | 39.1 years |
Average household size:
| Hamann Park: | 2.2 people |
| San Jose: | 2.9 people |
Percentage of family households:
| Hamann Park: | 53.9% |
| San Jose: | 49.9% |
| Here: | 49.8% |
| San Jose: | 53.0% |
Percentage of married-couple families with children (among all households):
| Hamann Park: | 76.8% |
| San Jose: | 25.8% |
Percentage of single-mother households (among all households):
| Hamann Park: | 5.0% |
| San Jose: | 5.2% |
Percentage of never married males 15 years old and over:
Percentage of never married females 15 years old and over:
| Hamann Park: | 14.4% |
| San Jose: | 20.9% |
Percentage of never married females 15 years old and over:
| Hamann Park: | 13.8% |
| city: | 16.7% |
Percentage of people that speak English not well or not at all:
| Hamann Park: | 14.9% |
| San Jose: | 11.4% |
Percentage of people born in this state:
Percentage of people born in another U.S. state:
Percentage of native residents but born outside the U.S.:
Percentage of foreign born residents:
| Here: | 49.3% |
| San Jose: | 46.1% |
Percentage of people born in another U.S. state:
| Hamann Park: | 13.4% |
| San Jose: | 10.4% |
Percentage of native residents but born outside the U.S.:
| Here: | 1.8% |
| city: | 1.7% |
Percentage of foreign born residents:
| Here: | 35.5% |
| San Jose: | 41.8% |
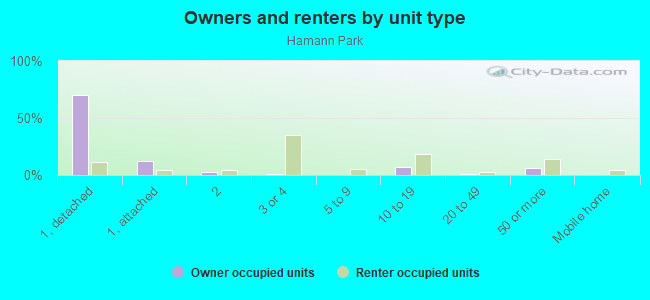
Owner-occupied
Renter-occupied

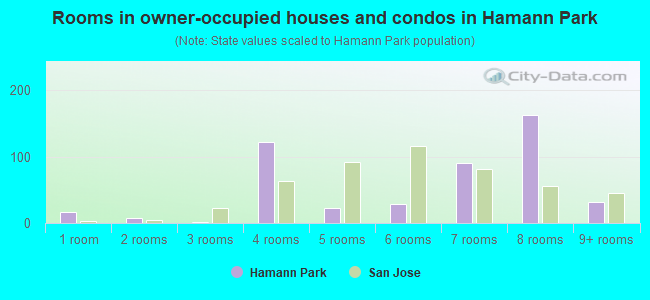
- Rooms in owner-occupied houses and condos in Hamann Park
- 161 room
- 82 rooms
- 13 rooms
- 1234 rooms
- 225 rooms
- 286 rooms
- 917 rooms
- 1638 rooms
- 319+ rooms
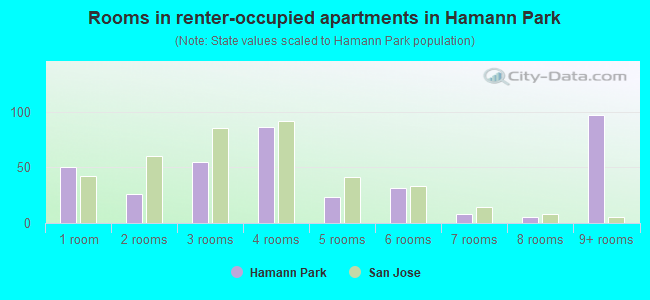
- Rooms in renter-occupied apartments in Hamann Park
- 501 room
- 262 rooms
- 553 rooms
- 864 rooms
- 235 rooms
- 316 rooms
- 87 rooms
- 58 rooms
- 979+ rooms
Owner-occupied
Renter-occupied
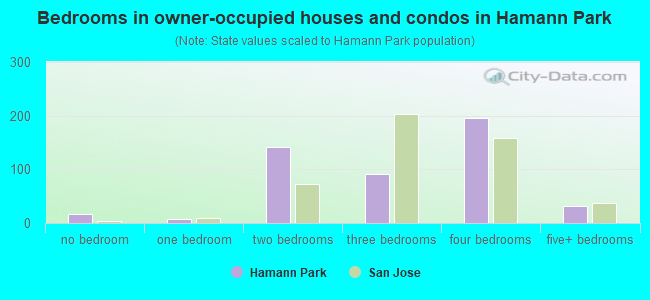
- Bedrooms in owner-occupied houses and condos in Hamann Park
- 16no bedroom
- 81 bedroom
- 1422 bedrooms
- 913 bedrooms
- 1954 bedrooms
- 315+ bedrooms
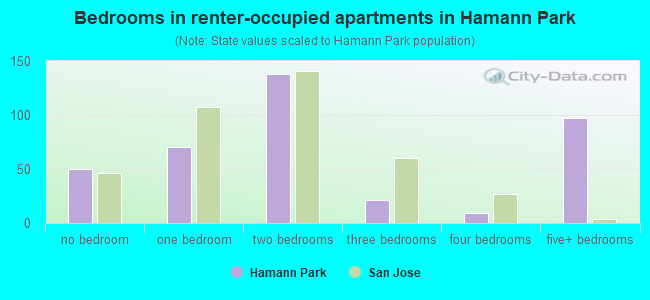
- Bedrooms in renter-occupied apartments in Hamann Park
- 50no bedroom
- 701 bedroom
- 1382 bedrooms
- 213 bedrooms
- 94 bedrooms
- 975+ bedrooms
Average number of cars or other vehicles available in houses/condos:
Average number of cars or other vehicles available in apartments:
| This neighborhood: | |
| San Jose: |
Average number of cars or other vehicles available in apartments:
| Here: | |
| city: |
Percentage of units with a mortgage:
| Hamann Park: | 39.4% |
| San Jose: | 66.9% |
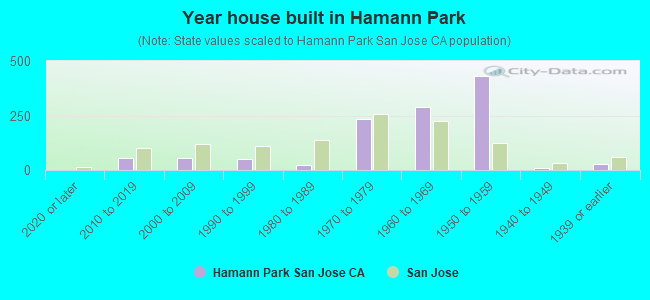
- Year house built in Hamann Park
- 02020 or later
- 562010 to 2019
- 562000 to 2009
- 491990 to 1999
- 221980 to 1989
- 2361970 to 1979
- 2911960 to 1969
- 4311950 to 1959
- 111940 to 1949
- 261939 or earlier
City-data.com crime index for city in 2020 (higher means more crime):
| City: | 268.4 |
| U.S. average: | 219.5 |
Travel time to work (commute)
![Travel time to work (commute)]()
- 23Less than 5 minutes
- 495 to 9 minutes
- 9010 to 14 minutes
- 14315 to 19 minutes
- 18320 to 24 minutes
- 2825 to 29 minutes
- 13930 to 34 minutes
- 1335 to 39 minutes
- 4240 to 44 minutes
- 8945 to 59 minutes
- 2160 to 89 minutes
- 4690 or more minutes

Means of transportation to work
![Means of transportation to work]()
- 75.5%333Drove a car alone
- 7.7%34Carpooled
- 6.3%28Bus
- 1.8%8Long-distance train or commuter rail
- 1.1%5Light rail, streetcar or trolley
- 5.9%26Motorcycle
- 4.5%20Bicycle
- 3.9%17Walked
- 4.1%18Other means
- 13.1%58Worked at home

Time leaving home to go to work
![Time leaving home to go to work]()
- 512:00 a.m. to 4:59 a.m.
- 295:00 a.m. to 5:29 a.m.
- 325:30 a.m. to 5:59 a.m.
- 656:00 a.m. to 6:29 a.m.
- 146:30 a.m. to 6:59 a.m.
- 1117:00 a.m. to 7:29 a.m.
- 1557:30 a.m. to 7:59 a.m.
- 1148:00 a.m. to 8:29 a.m.
- 778:30 a.m. to 8:59 a.m.
- 1049:00 a.m. to 9:59 a.m.
- 1210:00 a.m. to 10:59 a.m.
- 1711:00 a.m. to 11:59 a.m.
- 4312:00 p.m. to 3:59 p.m.
- 464:00 p.m. to 11:59 p.m.

Occupations of males:
- Percentage of males in management occupations (except farmers):
Here: 13.8% city: 13.0%
- Percentage of males in business and financial operations occupations:
Here: 15.7% city: 4.6%
- Percentage of males in computer and mathematical occupations:
Here: 11.5% city: 13.6%
- Percentage of males in architecture and engineering occupations:
Here: 16.5% city: 10.2%
- Percentage of males in community and social services occupations:
Here: 1.7% city: 0.8%
- Percentage of males in education, training, and library occupations:
Here: 2.8% city: 2.8%
- Percentage of males in arts, design, entertainment, sports, and media occupations:
Here: 1.5% city: 1.8%
- Percentage of males in healthcare practitioners and technical occupations:
Here: 9.4% city: 2.0%
- Percentage of males in service occupations:
Here: 12.9% city: 12.7%
- Percentage of males in sales and office occupations:
Here: 13.8% city: 12.8%
- Percentage of males in production occupations:
Here: 1.1% city: 5.5%
- Percentage of males in material moving occupations:
Here: 1.1% city: 3.1%
Occupations of females:
- Percentage of females in management occupations (except farmers):
Here: 12.1% city: 11.0%
- Percentage of females in business and financial operations occupations:
Here: 14.8% city: 8.6%
- Percentage of females in computer and mathematical occupations:
Here: 4.6% city: 5.4%
- Percentage of females in architecture and engineering occupations:
Here: 6.0% city: 2.8%
- Percentage of females in life, physical, and social science occupations:
Here: 3.2% city: 1.7%
- Percentage of females in community and social services occupations:
Here: 5.9% city: 1.8%
- Percentage of females in legal occupations:
Here: 1.8% city: 1.3%
- Percentage of females in education, training, and library occupations:
Here: 5.4% city: 8.1%
- Percentage of females in arts, design, entertainment, sports, and media occupations:
Here: 5.6% city: 2.0%
- Percentage of females in service occupations:
Here: 4.5% city: 21.7%
- Percentage of females in sales and office occupations:
Here: 34.2% city: 22.0%
- Percentage of females in production occupations:
Here: 6.0% city: 4.0%
Percentage of people 16-64 in Armed Forces:
| Hamann Park: | 0.1% |
| San Jose: | 0.0% |
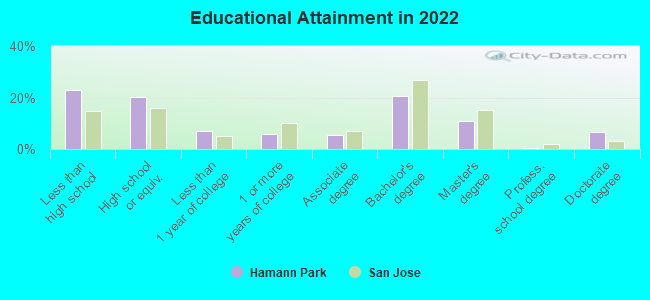
Education in this neighborhood (subdivision or community):
- Percentage of people 3 years and older in K-12 schools:
Hamann Park: 34.1% San Jose: 16.1%
- Percentage of people 3 years and older in undergraduate colleges:
Hamann Park: 9.0% San Jose: 6.5%
- Percentage of people 3 years and older in grad. or professional schools:
Hamann Park: 0.8% San Jose: 2.0%
- Percentage of students K-12 enrolled in private schools:
Hamann Park: 65.6% San Jose: 14.9%
Percentage of population below poverty level:
| Hamann Park: | 6.6% |
| San Jose: | 9.0% |
Percentage of married-couple families with both working:
| Hamann Park: | 101.2% |
| San Jose: | 72.5% |
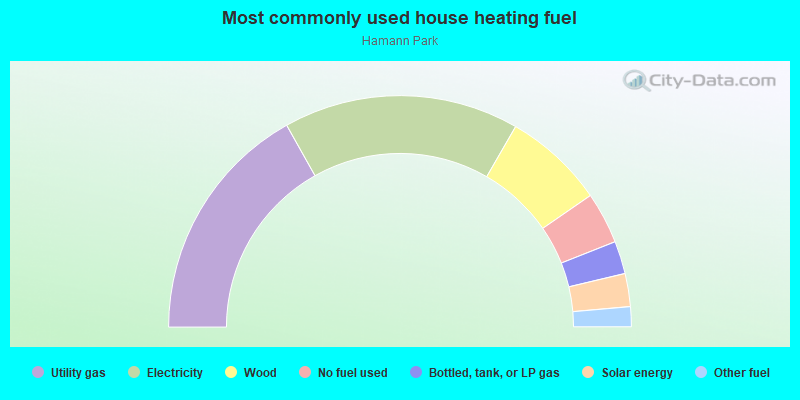
- 33.7%Utility gas
- 32.9%Electricity
- 14.1%Wood
- 7.2%No fuel used
- 4.6%Bottled, tank, or LP gas
- 4.6%Solar energy
- 2.8%Other fuel
Roads and streets:
S Genevieve Ln
Length: 0.69 miles
Direction: N-S
Address range: 600 to 1199
Direction: N-S
Address range: 600 to 1199
S Daniel Way
Length: 0.68 miles
Directions: N-S, SE-NW, SW-NE
Address range: 600 to 1199
Directions: N-S, SE-NW, SW-NE
Address range: 600 to 1199
Williams Rd
Length: 0.57 miles
Direction: E-W
Address range: 2700 to 2999
Direction: E-W
Address range: 2700 to 2999
Neal Ave
Length: 0.53 miles
Direction: E-W
Address range: 2700 to 3065
Direction: E-W
Address range: 2700 to 3065
S Monroe St
Length: 0.51 miles
Directions: N-S, SW-NE
Address range: 600 to 1099
Directions: N-S, SW-NE
Address range: 600 to 1099
S Baywood Ave
Length: 0.50 miles
Directions: N-S, SE-NW, SW-NE
Address range: 600 to 1098
Directions: N-S, SE-NW, SW-NE
Address range: 600 to 1098
S Clover Ave
Length: 0.50 miles
Directions: N-S, SE-NW
Address range: 600 to 1099
Directions: N-S, SE-NW
Address range: 600 to 1099
Fruitdale Ave
Length: 0.29 miles
Direction: E-W
Address range: 2900 to 2999
Direction: E-W
Address range: 2900 to 2999
Moorpark Ave
Length: 0.27 miles
Direction: E-W
Address range: 2772 to 2899
Direction: E-W
Address range: 2772 to 2899
Clifton Ave
Length: 0.18 miles
Direction: E-W
Direction: E-W
Ori Ave
Length: 0.13 miles
Directions: E-W, SE-NW
Address range: 2700 to 2799
Directions: E-W, SE-NW
Address range: 2700 to 2799
Huff Ave
Length: 0.08 miles
Direction: E-W
Direction: E-W
Westfield Ave
Length: 0.07 miles
Directions: E-W, SW-NE
Address range: 2732 to 2749
Directions: E-W, SW-NE
Address range: 2732 to 2749