Linwood Court neighborhood in Monrovia, California (CA), 91016 detailed profile
Settings
X


Business Search - 14 Million verified businesses
Area: 0.351 square miles
Population: 2,099
Population density:
| Linwood Court: | 5,983 people per square mile |
| Monrovia: | 2,739 people per square mile |

- 78432.4%Hispanic or Latino
- 57323.6%White
- 37715.6%Asian
- 1646.8%Native Hawaiian and Other
Pacific Islander - 1506.2%American Indian
- 1496.1%Two or more races
- 1184.9%Some other race
- 1084.5%Black

Median household income in 2022:
| Linwood Court: | $104,701 |
| Monrovia: | $93,827 |
Distribution of median household income
![Distribution of median household income]()
- 69Less than $10,000
- 108$10,000 to $19,999
- 119$20,000 to $29,999
- 115$30,000 to $39,999
- 49$40,000 to $49,999
- 55$50,000 to $59,999
- 86$60,000 to $74,999
- 79$75,000 to $99,999
- 135$100,000 to $124,999
- 139$125,000 to $149,999
- 53$150,000 to $199,999
- 173$200,000 or more

Distribution of owner-occupied house/condo value
![Distribution of owner-occupied house/condo value]()
- 119Less than $50,000
- 25$100,000 to $149,999
- 45$300,000 to $399,999
- 51$400,000 to $499,999
- 144$500,000 to $749,999
- 195$750,000 to $999,999
- 118$1,000,000 or more

Distribution of rent paid by renters
![Distribution of rent paid by renters]()
- 7$300 to $399
- 94$700 to $799
- 24$900 to $999
- 44$1,000 to $1,249
- 78$1,250 to $1,499
- 253$1,500 to $1,999
- 291$2,000 or more

Median rent in 2022:
| Linwood Court: | $1,931 |
| Monrovia: | $1,836 |
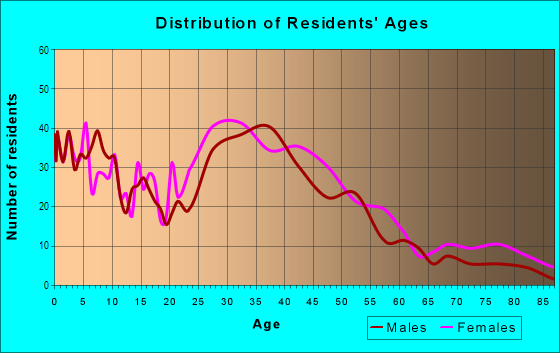
| Males: | 1,006 |
| Females: | 1,092 |
Males:
| This neighborhood: | 40.0 years |
| Whole city: | 36.5 years |
| This neighborhood: | 42.1 years |
| Whole city: | 39.9 years |
Average household size:
| Linwood Court: | 2.2 people |
| Monrovia: | 2.8 people |
Percentage of family households:
| Linwood Court: | 37.6% |
| Monrovia: | 50.1% |
| Here: | 32.4% |
| Monrovia: | 44.8% |
Percentage of married-couple families with children (among all households):
| Linwood Court: | 33.8% |
| Monrovia: | 26.4% |
Percentage of single-mother households (among all households):
| Linwood Court: | 19.5% |
| Monrovia: | 6.7% |
Percentage of never married males 15 years old and over:
Percentage of never married females 15 years old and over:
| Linwood Court: | 21.5% |
| Monrovia: | 20.0% |
Percentage of never married females 15 years old and over:
| Linwood Court: | 20.8% |
| city: | 17.2% |
Percentage of people that speak English not well or not at all:
| Linwood Court: | 3.3% |
| Monrovia: | 4.8% |
Percentage of people born in this state:
Percentage of people born in another U.S. state:
Percentage of native residents but born outside the U.S.:
Percentage of foreign born residents:
| Here: | 60.4% |
| Monrovia: | 60.6% |
Percentage of people born in another U.S. state:
| Linwood Court: | 16.0% |
| Monrovia: | 13.3% |
Percentage of native residents but born outside the U.S.:
| Here: | 0.8% |
| city: | 0.8% |
Percentage of foreign born residents:
| Here: | 22.8% |
| Monrovia: | 25.2% |

Owner-occupied
Renter-occupied


- Rooms in owner-occupied houses and condos in Linwood Court
- 01 room
- 302 rooms
- 583 rooms
- 514 rooms
- 1095 rooms
- 1786 rooms
- 517 rooms
- 498 rooms
- 979+ rooms

- Rooms in renter-occupied apartments in Linwood Court
- 161 room
- 512 rooms
- 2243 rooms
- 1584 rooms
- 215 rooms
- 356 rooms
- 317 rooms
- 478 rooms
- 139+ rooms
Owner-occupied
Renter-occupied

- Bedrooms in owner-occupied houses and condos in Linwood Court
- 0no bedroom
- 301 bedroom
- 1982 bedrooms
- 1923 bedrooms
- 744 bedrooms
- 455+ bedrooms

- Bedrooms in renter-occupied apartments in Linwood Court
- 17no bedroom
- 2021 bedroom
- 2482 bedrooms
- 523 bedrooms
- 264 bedrooms
- 335+ bedrooms
Average number of cars or other vehicles available in houses/condos:
Average number of cars or other vehicles available in apartments:
| This neighborhood: | 2.1 |
| Monrovia: | 2.2 |
Average number of cars or other vehicles available in apartments:
| Here: | 1.6 |
| city: | 1.8 |
Percentage of units with a mortgage:
| Linwood Court: | 63.9% |
| Monrovia: | 65.1% |

- Year house built in Linwood Court
- 252020 or later
- 902010 to 2019
- 1092000 to 2009
- 461990 to 1999
- 1301980 to 1989
- 1001970 to 1979
- 931960 to 1969
- 1711950 to 1959
- 1441940 to 1949
- 2241939 or earlier

City-data.com crime index for city in 2020 (higher means more crime):
| City: | 183.5 |
| U.S. average: | 219.5 |
Travel time to work (commute)
![Travel time to work (commute)]()
- 21Less than 5 minutes
- 575 to 9 minutes
- 6910 to 14 minutes
- 8515 to 19 minutes
- 10020 to 24 minutes
- 4725 to 29 minutes
- 20030 to 34 minutes
- 1435 to 39 minutes
- 5940 to 44 minutes
- 22445 to 59 minutes
- 7260 to 89 minutes
- 3990 or more minutes

Means of transportation to work
![Means of transportation to work]()
- 78.4%947Drove a car alone
- 5.6%68Carpooled
- 3.1%38Subway or elevated rail
- 0.1%1Light rail, streetcar or trolley
- 0.6%7Motorcycle
- 0.7%8Bicycle
- 1.3%16Walked
- 0.5%6Other means
- 14.2%172Worked at home

Time leaving home to go to work
![Time leaving home to go to work]()
- 5712:00 a.m. to 4:59 a.m.
- 285:00 a.m. to 5:29 a.m.
- 545:30 a.m. to 5:59 a.m.
- 426:00 a.m. to 6:29 a.m.
- 556:30 a.m. to 6:59 a.m.
- 1267:00 a.m. to 7:29 a.m.
- 1157:30 a.m. to 7:59 a.m.
- 1318:00 a.m. to 8:29 a.m.
- 608:30 a.m. to 8:59 a.m.
- 799:00 a.m. to 9:59 a.m.
- 4010:00 a.m. to 10:59 a.m.
- 1511:00 a.m. to 11:59 a.m.
- 3312:00 p.m. to 3:59 p.m.
- 164:00 p.m. to 11:59 p.m.

Occupations of males:
- Percentage of males in management occupations (except farmers):
Here: 18.5% city: 12.7%
- Percentage of males in business and financial operations occupations:
Here: 9.4% city: 3.1%
- Percentage of males in computer and mathematical occupations:
Here: 5.6% city: 4.5%
- Percentage of males in architecture and engineering occupations:
Here: 1.9% city: 4.8%
- Percentage of males in life, physical, and social science occupations:
Here: 1.8% city: 1.4%
- Percentage of males in community and social services occupations:
Here: 2.1% city: 1.4%
- Percentage of males in legal occupations:
Here: 2.8% city: 1.4%
- Percentage of males in education, training, and library occupations:
Here: 4.2% city: 5.1%
- Percentage of males in arts, design, entertainment, sports, and media occupations:
Here: 7.8% city: 4.2%
- Percentage of males in healthcare practitioners and technical occupations:
Here: 3.1% city: 4.5%
- Percentage of males in service occupations:
Here: 15.0% city: 13.0%
- Percentage of males in sales and office occupations:
Here: 19.2% city: 19.9%
- Percentage of males in construction, extraction, and maintenance occupations:
Here: 10.7% city: 10.7%
- Percentage of males in production occupations:
Here: 3.2% city: 4.8%
- Percentage of males in transportation occupations:
Here: 3.2% city: 4.1%
- Percentage of males in material moving occupations:
Here: 1.4% city: 2.7%
Occupations of females:
- Percentage of females in management occupations (except farmers):
Here: 18.6% city: 13.3%
- Percentage of females in business and financial operations occupations:
Here: 6.2% city: 5.5%
- Percentage of females in computer and mathematical occupations:
Here: 5.2% city: 2.4%
- Percentage of females in life, physical, and social science occupations:
Here: 1.4% city: 1.2%
- Percentage of females in community and social services occupations:
Here: 10.0% city: 4.3%
- Percentage of females in education, training, and library occupations:
Here: 5.1% city: 11.6%
- Percentage of females in arts, design, entertainment, sports, and media occupations:
Here: 7.8% city: 4.0%
- Percentage of females in healthcare practitioners and technical occupations:
Here: 12.3% city: 9.7%
- Percentage of females in service occupations:
Here: 13.5% city: 16.1%
- Percentage of females in sales and office occupations:
Here: 19.3% city: 26.0%
Percentage of people 16-64 in Armed Forces:
| Linwood Court: | 0.2% |
| Monrovia: | 0.1% |
Education in this neighborhood (subdivision or community):
- Percentage of people 3 years and older in K-12 schools:
Linwood Court: 24.6% Monrovia: 16.9%
- Percentage of people 3 years and older in undergraduate colleges:
Linwood Court: 8.6% Monrovia: 5.6%
- Percentage of people 3 years and older in grad. or professional schools:
Linwood Court: 6.5% Monrovia: 2.0%
- Percentage of students K-12 enrolled in private schools:
Linwood Court: 6.6% Monrovia: 10.9%
Percentage of population below poverty level:
| Linwood Court: | 8.5% |
| Monrovia: | 10.1% |
Median year owner moved in (as recorded in 2022):
Median year renter moved in (as recorded in 2022):
| Linwood Court: | 2012 |
| Monrovia: | 2004 |
Median year renter moved in (as recorded in 2022):
| Linwood Court: | 2017 |
| Monrovia: | 2015 |
Percentage of married-couple families with both working:
| Linwood Court: | 132.3% |
| Monrovia: | 64.0% |

- 59.5%Utility gas
- 20.4%Electricity
- 10.1%Fuel oil, kerosene, etc.
- 3.8%Solar energy
- 2.5%Bottled, tank, or LP gas
- 2.0%No fuel used
- 1.6%Other fuel
Roads and streets:
W Foothill Blvd
Length: 0.87 miles
Direction: E-W
Address range: 100 to 714
Direction: E-W
Address range: 100 to 714
W Colorado Blvd
Length: 0.83 miles
Direction: E-W
Address range: 100 to 699
Direction: E-W
Address range: 100 to 699
W Lime Ave
Length: 0.83 miles
Direction: E-W
Address range: 100 to 699
Direction: E-W
Address range: 100 to 699
W Lemon Ave
Length: 0.83 miles
Direction: E-W
Address range: 1 to 699
Direction: E-W
Address range: 1 to 699
W Palm Ave
Length: 0.83 miles
Direction: E-W
Address range: 100 to 699
Direction: E-W
Address range: 100 to 699
Linwood Ave
Length: 0.68 miles
Direction: E-W
Address range: 200 to 699
Direction: E-W
Address range: 200 to 699
S Alta Vista Ave
Length: 0.41 miles
Direction: N-S
Address range: 100 to 651
Direction: N-S
Address range: 100 to 651
S Primrose Ave
Length: 0.41 miles
Direction: N-S
Address range: 100 to 649
Direction: N-S
Address range: 100 to 649
S Magnolia Ave
Length: 0.41 miles
Direction: N-S
Address range: 100 to 649
Direction: N-S
Address range: 100 to 649
S Myrtle Ave
Length: 0.38 miles
Direction: N-S
Address range: 100 to 599
Direction: N-S
Address range: 100 to 599
Violet Ave
Length: 0.38 miles
Direction: N-S
Address range: 100 to 599
Direction: N-S
Address range: 100 to 599
S Mayflower Ave
Length: 0.37 miles
Direction: N-S
Address range: 100 to 599
Direction: N-S
Address range: 100 to 599
E Colorado Blvd
Length: 0.01 miles
Direction: E-W
Address range: 100 to 103
Direction: E-W
Address range: 100 to 103