Mulford neighborhood in San Leandro, California (CA), 94577 detailed profile
Settings
X


Business Search - 14 Million verified businesses
Area: 0.649 square miles
Population: 2,204
Population density:
| Mulford: | 3,398 people per square mile |
| San Leandro: | 6,610 people per square mile |

- 1,59566.6%Hispanic or Latino
- 34014.2%Asian
- 1466.1%White
- 1114.6%Black
- 1044.3%Native Hawaiian and Other
Pacific Islander - 853.6%Two or more races
- 130.5%Some other race

Median household income in 2022:
| Mulford: | $93,562 |
| San Leandro: | $92,651 |
Distribution of median household income
![Distribution of median household income]()
- 14Less than $10,000
- 17$10,000 to $19,999
- 35$20,000 to $29,999
- 45$30,000 to $39,999
- 71$40,000 to $49,999
- 7$50,000 to $59,999
- 55$60,000 to $74,999
- 80$75,000 to $99,999
- 54$100,000 to $124,999
- 23$125,000 to $149,999
- 84$150,000 to $199,999
- 17$200,000 or more

Distribution of owner-occupied house/condo value
![Distribution of owner-occupied house/condo value]()
- 93Less than $50,000
- 47$50,000 to $99,999
- 15$100,000 to $149,999
- 40$150,000 to $199,999
- 13$200,000 to $249,999
- 55$250,000 to $299,999
- 19$300,000 to $399,999
- 28$400,000 to $499,999
- 106$500,000 to $749,999
- 56$750,000 to $999,999
- 9$1,000,000 or more

Distribution of rent paid by renters
![Distribution of rent paid by renters]()
- 85$200 to $299
- 10$600 to $699
- 4$900 to $999
- 39$1,000 to $1,249
- 20$1,250 to $1,499
- 86$1,500 to $1,999
- 109$2,000 or more

Median rent in 2022:
| Mulford: | $2,076 |
| San Leandro: | $1,893 |
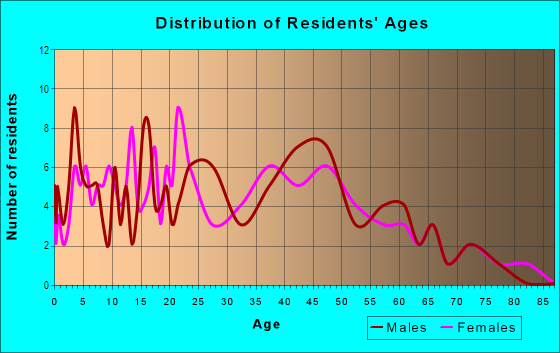
| Males: | 1,217 |
| Females: | 987 |
Males:
| This neighborhood: | 36.2 years |
| Whole city: | 40.3 years |
| This neighborhood: | 39.1 years |
| Whole city: | 45.2 years |
Average household size:
| Mulford: | 4.0 people |
| San Leandro: | 2.9 people |
Percentage of family households:
| Mulford: | 53.7% |
| San Leandro: | 44.4% |
| Here: | 52.1% |
| San Leandro: | 49.6% |
Percentage of married-couple families with children (among all households):
| Mulford: | 10.6% |
| San Leandro: | 26.2% |
Percentage of single-mother households (among all households):
| Mulford: | 9.6% |
| San Leandro: | 7.1% |
Percentage of never married males 15 years old and over:
Percentage of never married females 15 years old and over:
| Mulford: | 21.2% |
| San Leandro: | 18.2% |
Percentage of never married females 15 years old and over:
| Mulford: | 22.2% |
| city: | 16.0% |
Percentage of people that speak English not well or not at all:
| Mulford: | 14.5% |
| San Leandro: | 12.0% |
Percentage of people born in this state:
Percentage of people born in another U.S. state:
Percentage of native residents but born outside the U.S.:
Percentage of foreign born residents:
| Here: | 53.4% |
| San Leandro: | 44.1% |
Percentage of people born in another U.S. state:
| Mulford: | 5.1% |
| San Leandro: | 9.8% |
Percentage of native residents but born outside the U.S.:
| Here: | 1.6% |
| city: | 1.7% |
Percentage of foreign born residents:
| Here: | 39.9% |
| San Leandro: | 44.4% |

Owner-occupied
Renter-occupied


- Rooms in owner-occupied houses and condos in Mulford
- 111 room
- 272 rooms
- 53 rooms
- 304 rooms
- 915 rooms
- 1036 rooms
- 197 rooms
- 598 rooms
- 99+ rooms

- Rooms in renter-occupied apartments in Mulford
- 261 room
- 242 rooms
- 143 rooms
- 214 rooms
- 1165 rooms
- 736 rooms
- 447 rooms
- 328 rooms
- 129+ rooms
Owner-occupied
Renter-occupied

- Bedrooms in owner-occupied houses and condos in Mulford
- 11no bedroom
- 61 bedroom
- 652 bedrooms
- 1753 bedrooms
- 214 bedrooms
- 85+ bedrooms

- Bedrooms in renter-occupied apartments in Mulford
- 26no bedroom
- 291 bedroom
- 322 bedrooms
- 923 bedrooms
- 444 bedrooms
- 05+ bedrooms
Average number of cars or other vehicles available in houses/condos:
Average number of cars or other vehicles available in apartments:
| This neighborhood: | 2.6 |
| San Leandro: | 2.2 |
Average number of cars or other vehicles available in apartments:
| Here: | 1.9 |
| city: | 1.3 |
Percentage of units with a mortgage:
| Mulford: | 71.7% |
| San Leandro: | 63.4% |
Average estimated value of detached houses in 2022 (94.5% of all units):
| Mulford: | $665,290 |
| California: | $988,808 |

- Year house built in Mulford
- 02020 or later
- 252010 to 2019
- 92000 to 2009
- 301990 to 1999
- 291980 to 1989
- 411970 to 1979
- 671960 to 1969
- 781950 to 1959
- 2631940 to 1949
- 171939 or earlier

City-data.com crime index for city in 2020 (higher means more crime):
| City: | 374.8 |
| U.S. average: | 219.5 |
Travel time to work (commute)
![Travel time to work (commute)]()
- 15Less than 5 minutes
- 635 to 9 minutes
- 10810 to 14 minutes
- 12715 to 19 minutes
- 8220 to 24 minutes
- 10525 to 29 minutes
- 14230 to 34 minutes
- 735 to 39 minutes
- 940 to 44 minutes
- 6545 to 59 minutes
- 8660 to 89 minutes
- 1490 or more minutes

Means of transportation to work
![Means of transportation to work]()
- 77.0%692Drove a car alone
- 8.8%79Carpooled
- 3.7%33Bus
- 1.6%14Subway or elevated rail
- 2.7%24Long-distance train or commuter rail
- 2.9%26Motorcycle
- 4.7%42Walked
- 5.1%46Other means
- 1.9%17Worked at home

Time leaving home to go to work
![Time leaving home to go to work]()
- 6712:00 a.m. to 4:59 a.m.
- 555:00 a.m. to 5:29 a.m.
- 95:30 a.m. to 5:59 a.m.
- 406:00 a.m. to 6:29 a.m.
- 486:30 a.m. to 6:59 a.m.
- 1117:00 a.m. to 7:29 a.m.
- 727:30 a.m. to 7:59 a.m.
- 758:00 a.m. to 8:29 a.m.
- 308:30 a.m. to 8:59 a.m.
- 639:00 a.m. to 9:59 a.m.
- 3910:00 a.m. to 10:59 a.m.
- 311:00 a.m. to 11:59 a.m.
- 5212:00 p.m. to 3:59 p.m.
- 744:00 p.m. to 11:59 p.m.

Occupations of males:
- Percentage of males in management occupations (except farmers):
Here: 1.7% city: 9.9%
- Percentage of males in business and financial operations occupations:
Here: 1.2% city: 4.3%
- Percentage of males in computer and mathematical occupations:
Here: 2.5% city: 6.7%
- Percentage of males in architecture and engineering occupations:
Here: 1.6% city: 3.6%
- Percentage of males in education, training, and library occupations:
Here: 12.1% city: 3.0%
- Percentage of males in service occupations:
Here: 16.7% city: 14.6%
- Percentage of males in sales and office occupations:
Here: 17.3% city: 14.8%
- Percentage of males in construction, extraction, and maintenance occupations:
Here: 10.7% city: 10.0%
- Percentage of males in production occupations:
Here: 10.6% city: 7.8%
- Percentage of males in transportation occupations:
Here: 9.7% city: 7.3%
- Percentage of males in material moving occupations:
Here: 8.3% city: 6.8%
Occupations of females:
- Percentage of females in business and financial operations occupations:
Here: 2.0% city: 7.3%
- Percentage of females in education, training, and library occupations:
Here: 5.8% city: 6.9%
- Percentage of females in arts, design, entertainment, sports, and media occupations:
Here: 5.9% city: 2.2%
- Percentage of females in healthcare practitioners and technical occupations:
Here: 3.8% city: 6.5%
- Percentage of females in service occupations:
Here: 35.9% city: 23.3%
- Percentage of females in sales and office occupations:
Here: 36.2% city: 26.6%
- Percentage of females in production occupations:
Here: 6.5% city: 5.3%
- Percentage of females in material moving occupations:
Here: 3.5% city: 3.5%
Education in this neighborhood (subdivision or community):
- Percentage of people 3 years and older in K-12 schools:
Mulford: 25.5% San Leandro: 14.4%
- Percentage of people 3 years and older in undergraduate colleges:
Mulford: 10.3% San Leandro: 5.5%
- Percentage of people 3 years and older in grad. or professional schools:
Mulford: 1.0% San Leandro: 1.6%
- Percentage of students K-12 enrolled in private schools:
Mulford: 12.2% San Leandro: 9.9%
Percentage of population below poverty level:
| Mulford: | 7.4% |
| San Leandro: | 7.4% |
Median year owner moved in (as recorded in 2022):
Median year renter moved in (as recorded in 2022):
| Mulford: | 2003 |
| San Leandro: | 2006 |
Median year renter moved in (as recorded in 2022):
| Mulford: | 2013 |
| San Leandro: | 2018 |
Percentage of married-couple families with both working:
| Mulford: | 74.5% |
| San Leandro: | 62.2% |

- 62.0%Utility gas
- 23.2%Electricity
- 6.0%No fuel used
- 2.6%Bottled, tank, or LP gas
- 2.6%Wood
- 2.1%Solar energy
- 1.5%Fuel oil, kerosene, etc.
Limited-access highways (interstate or state) in this neighborhood:
State Hwy 17 (Nimitz Fwy, I- 880)
Length: 0.96 miles
Directions: SE-NW, SW-NE
Directions: SE-NW, SW-NE
Highways in this neighborhood:
State Hwy 61 (State Hwy 112, Davis St)
Length: 0.83 miles
Directions: E-W, N-S, SE-NW, SW-NE
Address range: 1750 to 2229
Directions: E-W, N-S, SE-NW, SW-NE
Address range: 1750 to 2229
Roads and streets:
Marina Blvd
Length: 1.87 miles
Directions: E-W, SW-NE
Address range: 1500 to 2207
Directions: E-W, SW-NE
Address range: 1500 to 2207
Williams St
Length: 1.63 miles
Directions: E-W, SW-NE
Address range: 1678 to 2207
Directions: E-W, SW-NE
Address range: 1678 to 2207
Doolittle Dr
Length: 1.51 miles
Direction: SE-NW
Address range: 1001 to 2199
Direction: SE-NW
Address range: 1001 to 2199
Timothy Dr
Length: 0.74 miles
Directions: E-W, N-S, SE-NW, SW-NE
Address range: 1200 to 1799
Directions: E-W, N-S, SE-NW, SW-NE
Address range: 1200 to 1799
Merced St
Length: 0.56 miles
Directions: N-S, SE-NW
Address range: 1800 to 2199
Directions: N-S, SE-NW
Address range: 1800 to 2199
Doolittle
Length: 0.35 miles
Direction: SE-NW
Direction: SE-NW
Menlo St
Length: 0.24 miles
Direction: SE-NW
Address range: 13000 to 13199
Direction: SE-NW
Address range: 13000 to 13199
Marybelle Ave
Length: 0.22 miles
Directions: N-S, SE-NW, SW-NE
Address range: 1300 to 1699
Directions: N-S, SE-NW, SW-NE
Address range: 1300 to 1699
Abram Ct
Length: 0.18 miles
Direction: SW-NE
Address range: 1600 to 1799
Direction: SW-NE
Address range: 1600 to 1799
Davis
Length: 0.17 miles
Direction: E-W
Direction: E-W
Carden St
Length: 0.15 miles
Directions: E-W, SE-NW, SW-NE
Address range: 1236 to 2299
Directions: E-W, SE-NW, SW-NE
Address range: 1236 to 2299
Charlotte Ave
Length: 0.14 miles
Directions: E-W, SW-NE
Address range: 1900 to 2099
Directions: E-W, SW-NE
Address range: 1900 to 2099
Wallace Ave
Length: 0.12 miles
Directions: E-W, SW-NE
Address range: 1900 to 2099
Directions: E-W, SW-NE
Address range: 1900 to 2099
Vestal Ct
Length: 0.03 miles
Direction: E-W
Address range: 2000 to 2099
Direction: E-W
Address range: 2000 to 2099
Railroad features:
Union Pacific RR
Length: 2.28 miles
Directions: E-W, N-S, SE-NW, SW-NE
Directions: E-W, N-S, SE-NW, SW-NE