Races in Ballston, New York (NY) Detailed Stats
Ancestries, Foreign-born residents, place of birth
2.5% of Ballston, NY residents are foreign-born (1.3% born in Europe, 0.7% born in Asia, 0.3% born in Latin America), which is 789.1% less than the foreign-born rate of 22.0% across the entire state of New York.
Race distribution in Ballston

- 8,44996.8%White alone
- 1161.3%Hispanic
- 510.6%Two or more races
- 430.5%Black alone
- 420.5%Asian alone
- 200.2%American Indian alone
- 70.08%Other race alone
- 10.01%Native Hawaiian and Other
Pacific Islander alone

2000
2022
-
- 11,760,98162.0%White alone
- 2,867,58315.1%Hispanic
- 2,812,62314.8%Black alone
- 1,035,9265.5%Asian alone
- 366,1161.9%Two or more races
- 75,4990.4%Other race alone
- 52,4990.3%American Indian alone
- 5,2300.03%Native Hawaiian and Other
Pacific Islander alone

-
- 10,408,93352.9%White alone
- 3,867,29919.7%Hispanic
- 2,633,84013.4%Black alone
- 1,776,2869.0%Asian alone
- 732,6703.7%Two or more races
- 216,1101.1%Other race alone
- 35,0820.2%American Indian alone
- 6,9310.04%Native Hawaiian and Other
Pacific Islander alone

Income and house value in Ballston
- Median household income in 2022
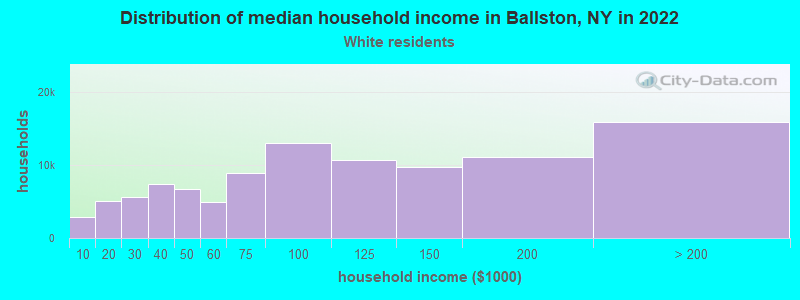
- $102,571White non-Hispanic householders
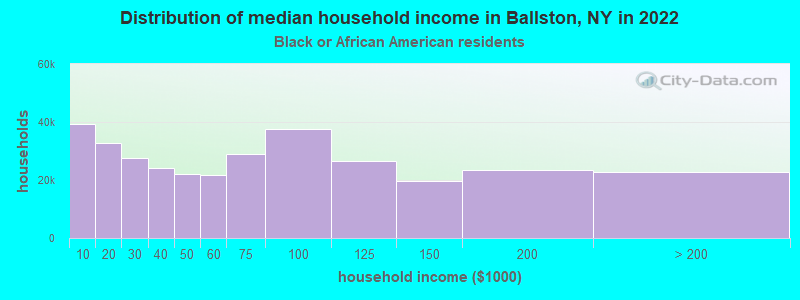
- $39,765Black householders
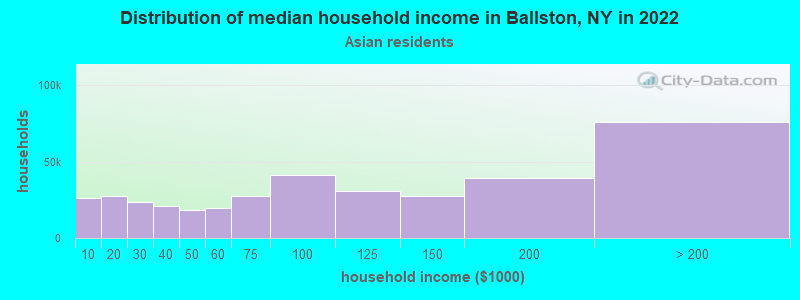
- $155,998Asian householders
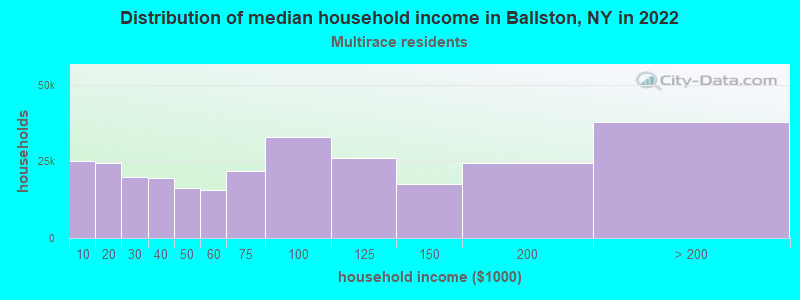
- $75,129Two or more races householders
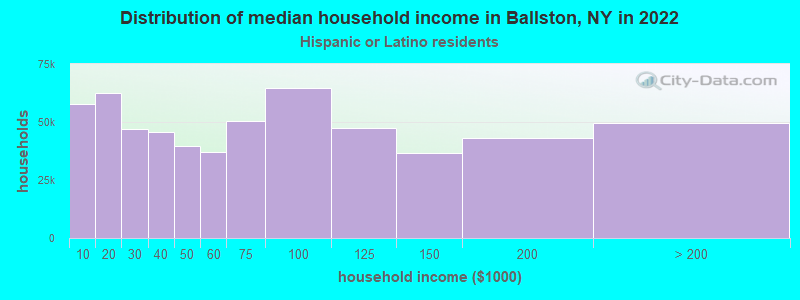
- $38,352Hispanic or Latino race householders
- Median 2022 house value
- $365,423White Non-Hispanic householders
- $378,441Asian householders
- $567,662Hispanic or Latino householders
Household income for White non-Hispanic householders
Household income for Black householders
Household income for Asian householders
Household income for Two or more races householders
Household income for Hispanic or Latino race householders
Foreign-born residents in Ballston
216 residents are foreign born (1.3% Europe, 0.7% Asia, 0.3% Latin America).
| This city: | 2.5% |
| New York: | 20.4% |
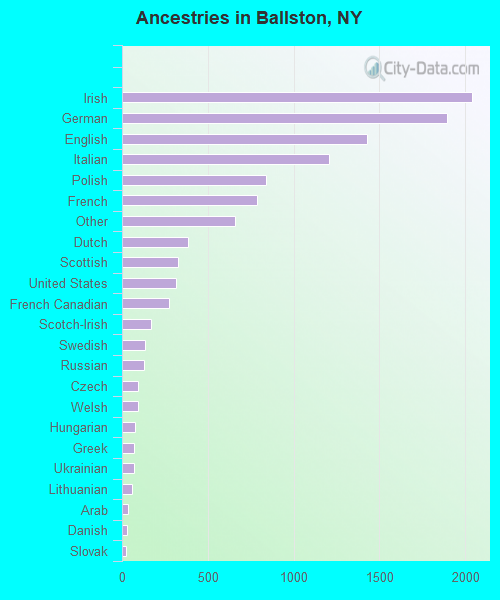
Ancestries in Ballston

- 2,03818.3%Irish
- 1,89517.0%German
- 1,42812.8%English
- 1,20910.8%Italian
- 8407.5%Polish
- 7887.1%French
- 6575.9%Other
- 3833.4%Dutch
- 3293.0%Scottish
- 3162.8%United States
- 2742.5%French Canadian
- 1691.5%Scotch-Irish
- 1321.2%Swedish
- 1271.1%Russian
- 960.9%Czech
- 960.9%Welsh
- 730.7%Hungarian
- 700.6%Greek
- 690.6%Ukrainian
- 560.5%Lithuanian
- 350.3%Arab
- 270.2%Danish
- 230.2%Slovak
- 120.1%Swiss
- 70.06%Portuguese
Zip codes: 12020.