Races in Briarcliff Manor, New York (NY) Detailed Stats
Data:
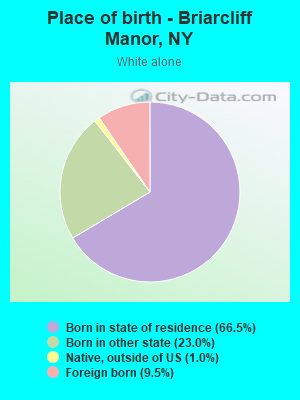
Races - White alone (%)
Races - White alone (% change since 2000)
Races - Black alone (%)
Races - Black alone (% change since 2000)
Races - American Indian alone (%)
Races - American Indian alone (% change since 2000)
Races - Asian alone (%)
Races - Asian alone (% change since 2000)
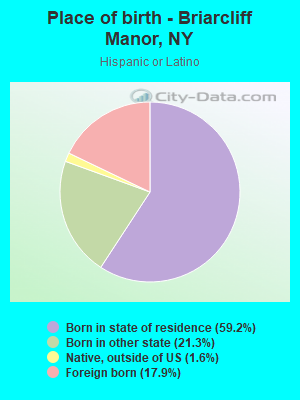
Races - Hispanic (%)
Races - Hispanic (% change since 2000)
Races - Native Hawaiian and Other Pacific Islander alone (%)
Races - Native Hawaiian and Other Pacific Islander alone (% change since 2000)
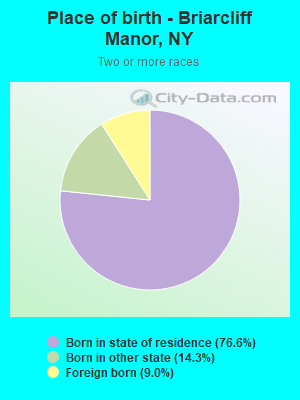
Races - Two or more races(%)
Races - Two or more races(% change since 2000)
Races - Other race alone (%)
Races - Other race alone (% change since 2000)
Racial diversity
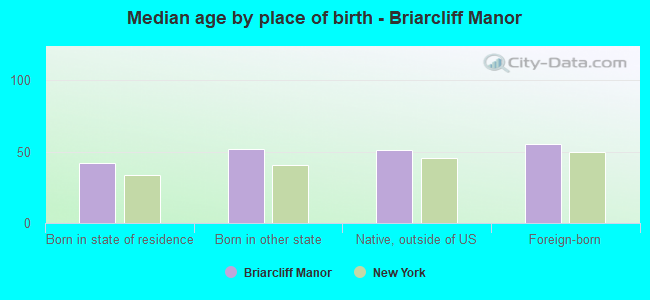
Place of birth - Born in state of residence (%)
Place of birth - Born in state of residence (%) - White
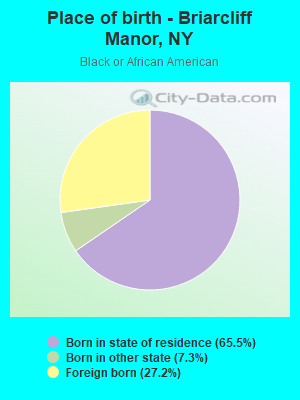
Place of birth - Born in state of residence (%) - Black or African American
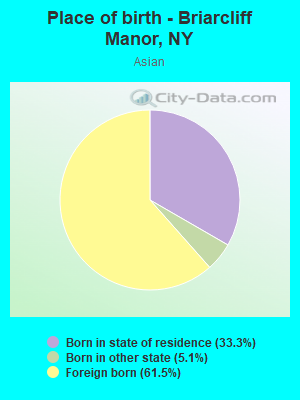
Place of birth - Born in state of residence (%) - Asian
Place of birth - Born in state of residence (%) - Hispanic or Latino
Place of birth - Born in state of residence (%) - American Indian and Alaska Native
Place of birth - Born in state of residence (%) - Multirace
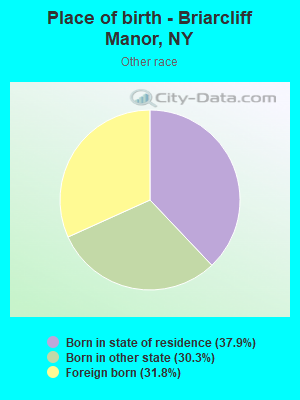
Place of birth - Born in state of residence (%) - Other Race
Place of birth - Born in other state (%)
Place of birth - Born in other state (%) - White
Place of birth - Born in other state (%) - Black or African American
Place of birth - Born in other state (%) - Asian
Place of birth - Born in other state (%) - Hispanic or Latino
Place of birth - Born in other state (%) - American Indian and Alaska Native
Place of birth - Born in other state (%) - Multirace
Place of birth - Born in other state (%) - Other Race
Place of birth - Native, outside of US (%)
Place of birth - Native, outside of US (%) - White
Place of birth - Native, outside of US (%) - Black or African American
Place of birth - Native, outside of US (%) - Asian
Place of birth - Native, outside of US (%) - Hispanic or Latino
Place of birth - Native, outside of US (%) - American Indian and Alaska Native
Place of birth - Native, outside of US (%) - Multirace
Place of birth - Native, outside of US (%) - Other Race
Place of birth - Foreign born (%)
Place of birth - Foreign born (%) - White
Place of birth - Foreign born (%) - Black or African American
Place of birth - Foreign born (%) - Asian
Place of birth - Foreign born (%) - Hispanic or Latino
Place of birth - Foreign born (%) - American Indian and Alaska Native
Place of birth - Foreign born (%) - Multirace
Place of birth - Foreign born (%) - Other Race
Residents speaking English at home (%)
Residents speaking English at home - Born in the United States (%)
Residents speaking English at home - Native, born elsewhere (%)
Residents speaking English at home - Foreign born (%)
Residents speaking Spanish at home (%)
Residents speaking Spanish at home - Born in the United States (%)
Residents speaking Spanish at home - Native, born elsewhere (%)
Residents speaking Spanish at home - Foreign born (%)
Residents speaking other language at home (%)
Residents speaking other language at home - Born in the United States (%)
Residents speaking other language at home - Native, born elsewhere (%)
Residents speaking other language at home - Foreign born (%)
Marital status - Never married (%)
Marital status - Now married (%)
Marital status - Separated (%)
Marital status - Widowed (%)
Marital status - Divorced (%)
Ancestries Reported - Arab (%)
Ancestries Reported - Czech (%)
Ancestries Reported - Danish (%)
Ancestries Reported - Dutch (%)
Ancestries Reported - English (%)
Ancestries Reported - French (%)
Ancestries Reported - French Canadian (%)
Ancestries Reported - German (%)
Ancestries Reported - Greek (%)
Ancestries Reported - Hungarian (%)
Ancestries Reported - Irish (%)
Ancestries Reported - Italian (%)
Ancestries Reported - Lithuanian (%)
Ancestries Reported - Norwegian (%)
Ancestries Reported - Polish (%)
Ancestries Reported - Portuguese (%)
Ancestries Reported - Russian (%)
Ancestries Reported - Scotch-Irish (%)
Ancestries Reported - Scottish (%)
Ancestries Reported - Slovak (%)
Ancestries Reported - Subsaharan African (%)
Ancestries Reported - Swedish (%)
Ancestries Reported - Swiss (%)
Ancestries Reported - Ukrainian (%)
Ancestries Reported - United States (%)
Ancestries Reported - Welsh (%)
Ancestries Reported - West Indian (%)
Ancestries Reported - Other (%)
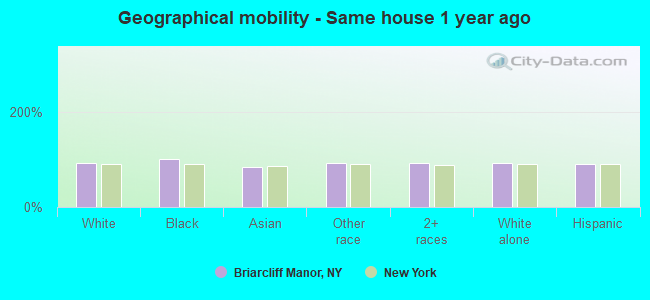
Geographical mobility - Same house 1 year ago (%)
Geographical mobility - Same house 1 year ago (%) - White
Geographical mobility - Same house 1 year ago (%) - Black or African American
Geographical mobility - Same house 1 year ago (%) - Asian
Geographical mobility - Same house 1 year ago (%) - Hispanic or Latino
Geographical mobility - Same house 1 year ago (%) - American Indian and Alaska Native
Geographical mobility - Same house 1 year ago (%) - Multirace
Geographical mobility - Same house 1 year ago (%) - Other Race
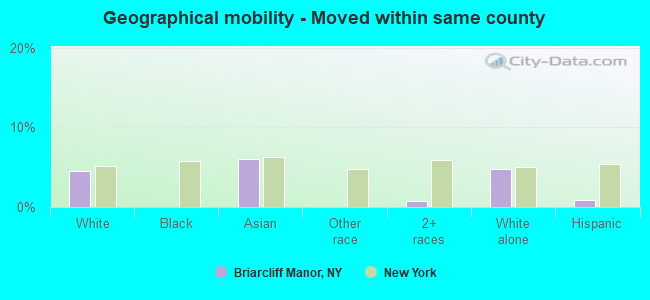
Geographical mobility - Moved within same county (%)
Geographical mobility - Moved within same county (%) - White
Geographical mobility - Moved within same county (%) - Black or African American
Geographical mobility - Moved within same county (%) - Asian
Geographical mobility - Moved within same county (%) - Hispanic or Latino
Geographical mobility - Moved within same county (%) - American Indian and Alaska Native
Geographical mobility - Moved within same county (%) - Multirace
Geographical mobility - Moved within same county (%) - Other Race
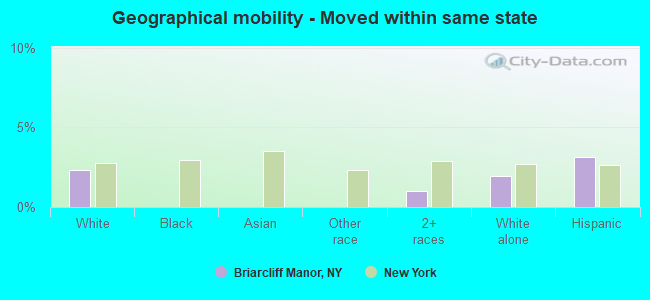
Geographical mobility - Moved from different county within same state (%)
Geographical mobility - Moved from different county within same state (%) - White
Geographical mobility - Moved from different county within same state (%) - Black or African American
Geographical mobility - Moved from different county within same state (%) - Asian
Geographical mobility - Moved from different county within same state (%) - Hispanic or Latino
Geographical mobility - Moved from different county within same state (%) - American Indian and Alaska Native
Geographical mobility - Moved from different county within same state (%) - Multirace
Geographical mobility - Moved from different county within same state (%) - Other Race
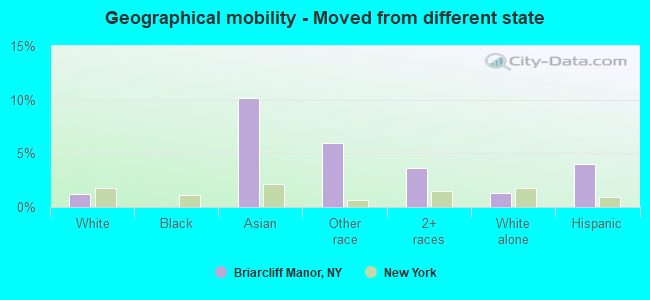
Geographical mobility - Moved from different state (%)
Geographical mobility - Moved from different state (%) - White
Geographical mobility - Moved from different state (%) - Black or African American
Geographical mobility - Moved from different state (%) - Asian
Geographical mobility - Moved from different state (%) - Hispanic or Latino
Geographical mobility - Moved from different state (%) - American Indian and Alaska Native
Geographical mobility - Moved from different state (%) - Multirace
Geographical mobility - Moved from different state (%) - Other Race
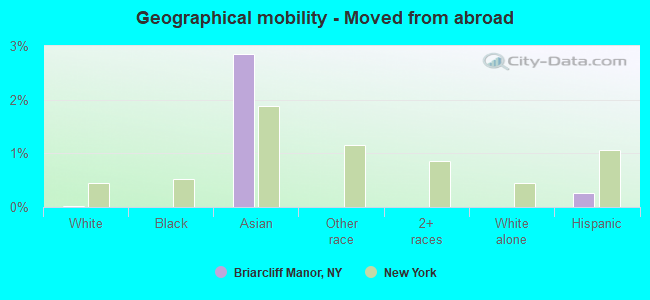
Geographical mobility - Moved from abroad (%)
Geographical mobility - Moved from abroad (%) - White
Geographical mobility - Moved from abroad (%) - Black or African American
Geographical mobility - Moved from abroad (%) - Asian
Geographical mobility - Moved from abroad (%) - Hispanic or Latino
Geographical mobility - Moved from abroad (%) - American Indian and Alaska Native
Geographical mobility - Moved from abroad (%) - Multirace
Geographical mobility - Moved from abroad (%) - Other Race
Place of birth for the foreign-born population - Ireland (%)
Place of birth for the foreign-born population - Denmark (%)
Place of birth for the foreign-born population - Norway (%)
Place of birth for the foreign-born population - Sweden (%)
Place of birth for the foreign-born population - United Kingdom (%)
Place of birth for the foreign-born population - England (%)
Place of birth for the foreign-born population - Scotland (%)
Place of birth for the foreign-born population - Other Northern Europe (%)
Place of birth for the foreign-born population - Austria (%)
Place of birth for the foreign-born population - Belgium (%)
Place of birth for the foreign-born population - France (%)
Place of birth for the foreign-born population - Germany (%)
Place of birth for the foreign-born population - Netherlands (%)
Place of birth for the foreign-born population - Switzerland (%)
Place of birth for the foreign-born population - Other Western Europe (%)
Place of birth for the foreign-born population - Greece (%)
Place of birth for the foreign-born population - Italy (%)
Place of birth for the foreign-born population - Portugal (%)
Place of birth for the foreign-born population - Spain (%)
Place of birth for the foreign-born population - Other Southern Europe (%)
Place of birth for the foreign-born population - Albania (%)
Place of birth for the foreign-born population - Belarus (%)
Place of birth for the foreign-born population - Bosnia and Herzegovina (%)
Place of birth for the foreign-born population - Bulgaria (%)
Place of birth for the foreign-born population - Croatia (%)
Place of birth for the foreign-born population - Czechoslovakia (%)
Place of birth for the foreign-born population - Hungary (%)
Place of birth for the foreign-born population - Latvia (%)
Place of birth for the foreign-born population - Lithuania (%)
Place of birth for the foreign-born population - North Macedonia (Macedonia) (%)
Place of birth for the foreign-born population - Moldova (%)
Place of birth for the foreign-born population - Poland (%)
Place of birth for the foreign-born population - Romania (%)
Place of birth for the foreign-born population - Russia (%)
Place of birth for the foreign-born population - Serbia (%)
Place of birth for the foreign-born population - Ukraine (%)
Place of birth for the foreign-born population - Other Eastern Europe (%)
Place of birth for the foreign-born population - China (%)
Place of birth for the foreign-born population - Hong Kong (%)
Place of birth for the foreign-born population - Taiwan (%)
Place of birth for the foreign-born population - Japan (%)
Place of birth for the foreign-born population - Korea (%)
Place of birth for the foreign-born population - Other Eastern Asia (%)
Place of birth for the foreign-born population - Afghanistan (%)
Place of birth for the foreign-born population - Bangladesh (%)
Place of birth for the foreign-born population - India (%)
Place of birth for the foreign-born population - Iran (%)
Place of birth for the foreign-born population - Kazakhstan (%)
Place of birth for the foreign-born population - Nepal (%)
Place of birth for the foreign-born population - Pakistan (%)
Place of birth for the foreign-born population - Sri Lanka (%)
Place of birth for the foreign-born population - Uzbekistan (%)
Place of birth for the foreign-born population - Other South Central Asia (%)
Place of birth for the foreign-born population - Burma (%)
Place of birth for the foreign-born population - Cambodia (%)
Place of birth for the foreign-born population - Indonesia (%)
Place of birth for the foreign-born population - Laos (%)
Place of birth for the foreign-born population - Malaysia (%)
Place of birth for the foreign-born population - Philippines (%)
Place of birth for the foreign-born population - Singapore (%)
Place of birth for the foreign-born population - Thailand (%)
Place of birth for the foreign-born population - Vietnam (%)
Place of birth for the foreign-born population - Other South Eastern Asia (%)
Place of birth for the foreign-born population - Armenia (%)
Place of birth for the foreign-born population - Iraq (%)
Place of birth for the foreign-born population - Israel (%)
Place of birth for the foreign-born population - Jordan (%)
Place of birth for the foreign-born population - Kuwait (%)
Place of birth for the foreign-born population - Lebanon (%)
Place of birth for the foreign-born population - Saudi Arabia (%)
Place of birth for the foreign-born population - Syria (%)
Place of birth for the foreign-born population - Turkey (%)
Place of birth for the foreign-born population - Yemen (%)
Place of birth for the foreign-born population - Other Western Asia (%)
Place of birth for the foreign-born population - Eritrea (%)
Place of birth for the foreign-born population - Ethiopia (%)
Place of birth for the foreign-born population - Kenya (%)
Place of birth for the foreign-born population - Somalia (%)
Place of birth for the foreign-born population - Uganda (%)
Place of birth for the foreign-born population - Zimbabwe (%)
Place of birth for the foreign-born population - Other Eastern Africa (%)
Place of birth for the foreign-born population - Cameroon (%)
Place of birth for the foreign-born population - Congo (%)
Place of birth for the foreign-born population - Democratic Republic of Congo (Zaire) (%)
Place of birth for the foreign-born population - Other Middle Africa (%)
Place of birth for the foreign-born population - Egypt (%)
Place of birth for the foreign-born population - Morocco (%)
Place of birth for the foreign-born population - Sudan (%)
Place of birth for the foreign-born population - Other Northern Africa (%)
Place of birth for the foreign-born population - South Africa (%)
Place of birth for the foreign-born population - Other Southern Africa (%)
Place of birth for the foreign-born population - Cabo Verde (%)
Place of birth for the foreign-born population - Ghana (%)
Place of birth for the foreign-born population - Liberia (%)
Place of birth for the foreign-born population - Nigeria (%)
Place of birth for the foreign-born population - Senegal (%)
Place of birth for the foreign-born population - Sierra Leone (%)
Place of birth for the foreign-born population - Other Western Africa (%)
Place of birth for the foreign-born population - Australia (%)
Place of birth for the foreign-born population - New Zealand (%)
Place of birth for the foreign-born population - Fiji (%)
Place of birth for the foreign-born population - Micronesia (%)
Place of birth for the foreign-born population - Bahamas (%)
Place of birth for the foreign-born population - Barbados (%)
Place of birth for the foreign-born population - Cuba (%)
Place of birth for the foreign-born population - Dominica (%)
Place of birth for the foreign-born population - Dominican Republic (%)
Place of birth for the foreign-born population - Grenada (%)
Place of birth for the foreign-born population - Haiti (%)
Place of birth for the foreign-born population - Jamaica (%)
Place of birth for the foreign-born population - St. Vincent and the Grenadines (%)
Place of birth for the foreign-born population - Trinidad and Tobago (%)
Place of birth for the foreign-born population - West Indies (%)
Place of birth for the foreign-born population - Other Caribbean (%)
Place of birth for the foreign-born population - Belize (%)
Place of birth for the foreign-born population - Costa Rica (%)
Place of birth for the foreign-born population - El Salvador (%)
Place of birth for the foreign-born population - Guatemala (%)
Place of birth for the foreign-born population - Honduras (%)
Place of birth for the foreign-born population - Mexico (%)
Place of birth for the foreign-born population - Nicaragua (%)
Place of birth for the foreign-born population - Panama (%)
Place of birth for the foreign-born population - Other Central America (%)
Place of birth for the foreign-born population - Argentina (%)
Place of birth for the foreign-born population - Bolivia (%)
Place of birth for the foreign-born population - Brazil (%)
Place of birth for the foreign-born population - Chile (%)
Place of birth for the foreign-born population - Colombia (%)
Place of birth for the foreign-born population - Ecuador (%)
Place of birth for the foreign-born population - Guyana (%)
Place of birth for the foreign-born population - Peru (%)
Place of birth for the foreign-born population - Uruguay (%)
Place of birth for the foreign-born population - Venezuela (%)
Place of birth for the foreign-born population - Other South America (%)
Place of birth for the foreign-born population - Canada (%)
Place of birth for the foreign-born population - Other Northern America (%)
Place of birth for the foreign-born population - Other (%)
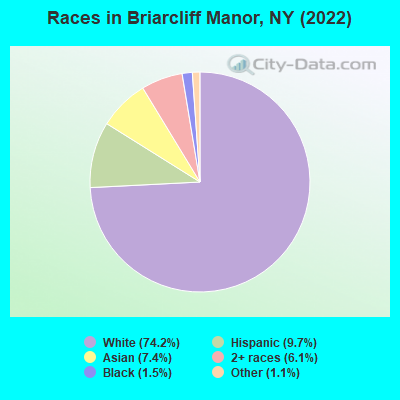
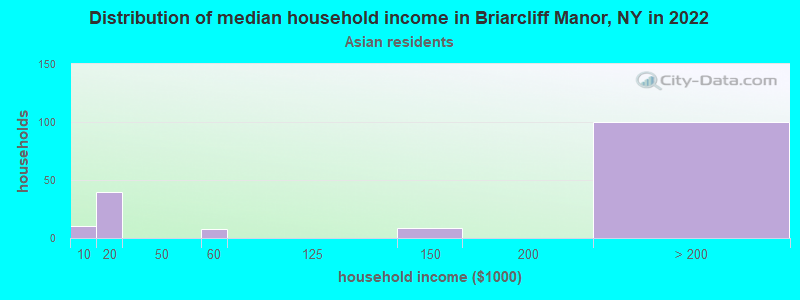
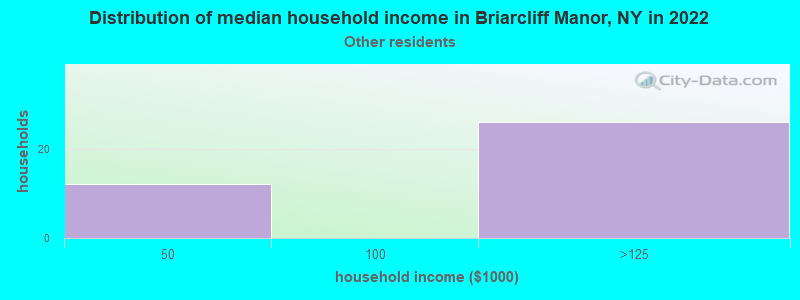
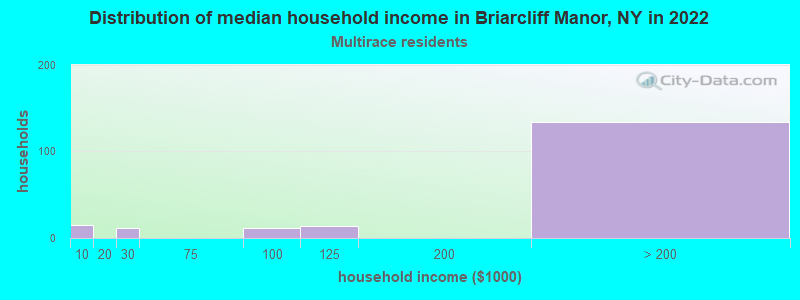
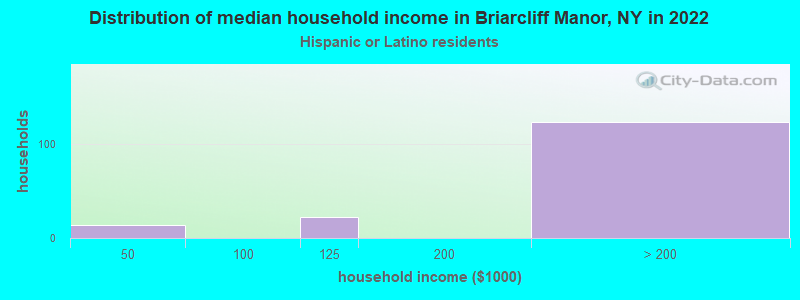
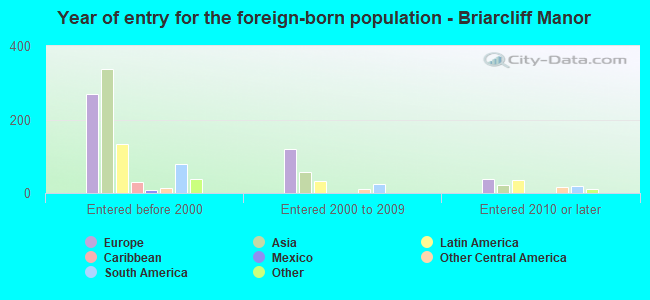
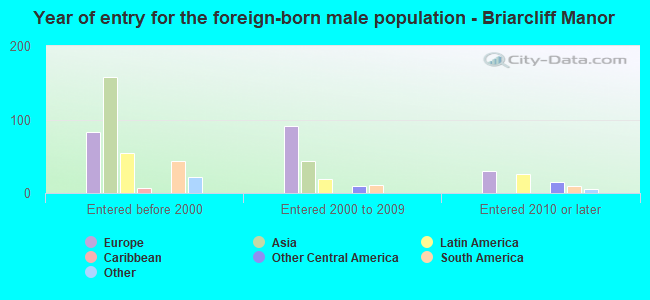
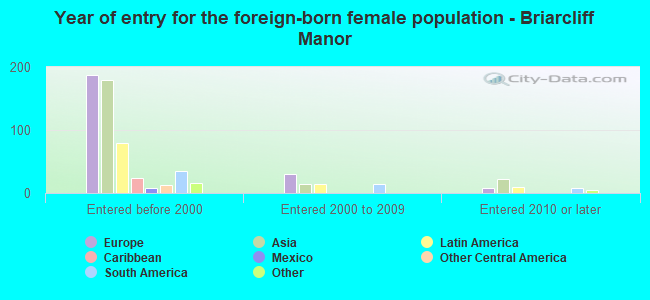
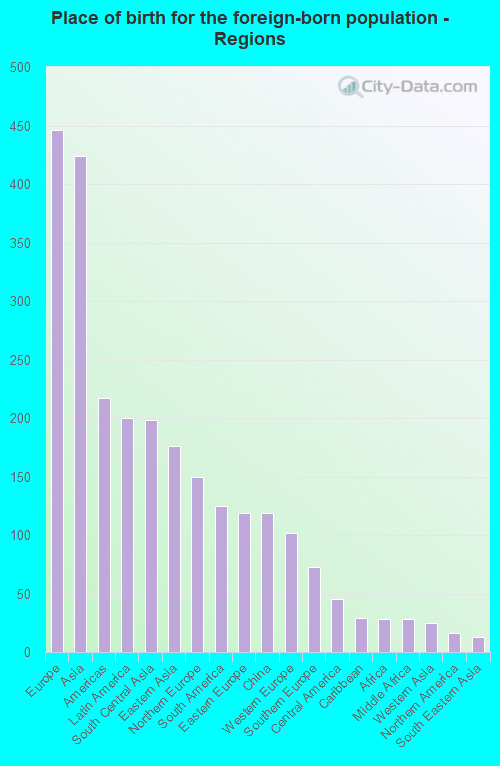
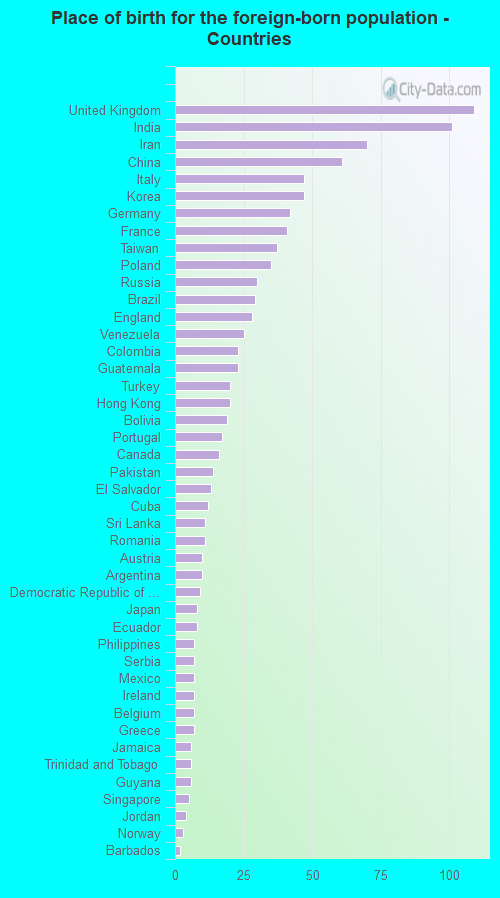
According to 2022 data, the most numerous races in Briarcliff Manor, NY are White alone (5,447 residents), Hispanic (710 residents), and Black alone (110 residents). 84.5% of Briarcliff Manor residents speak English at home. 15.2% of Briarcliff Manor, NY residents are foreign-born (6.1% born in Europe, 5.8% born in Asia, 2.7% born in Latin America), which is 44.7% less than the foreign-born rate of 22.0% across the entire state of New York.
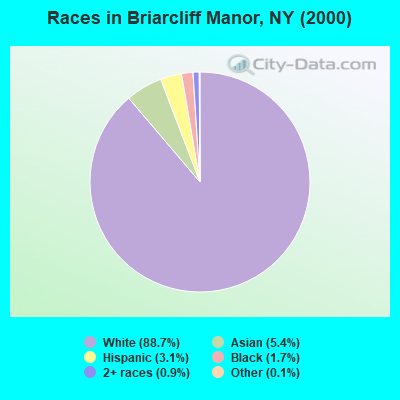
Race distribution in Briarcliff Manor
2000 2022
11,760,981 62.0% White alone 2,867,583 15.1% Hispanic 2,812,623 14.8% Black alone 1,035,926 5.5% Asian alone 366,116 1.9% Two or more races 75,499 0.4% Other race alone 52,499 0.3% American Indian alone 5,230 0.03% Native Hawaiian and Other
10,408,933 52.9% White alone 3,867,299 19.7% Hispanic 2,633,840 13.4% Black alone 1,776,286 9.0% Asian alone 732,670 3.7% Two or more races 216,110 1.1% Other race alone 35,082 0.2% American Indian alone 6,931 0.04% Native Hawaiian and Other
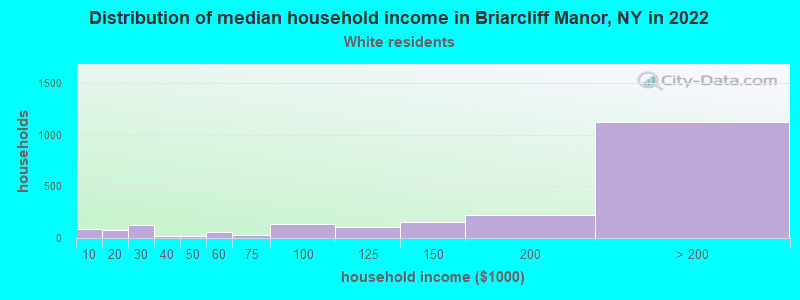
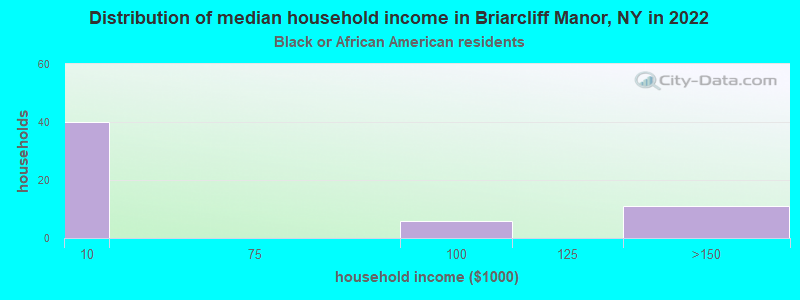
Income and house value in Briarcliff Manor Median household income in 2022 $189,502 White non-Hispanic householdersover $200,000 Asian householdersover $200,000 Two or more races householdersover $200,000 Hispanic or Latino race householdersMedian 2022 house value $871,557 White Non-Hispanic householders$755,769 Black or African American householders $744,515 Asian householders$429,197 Some other race householders$635,785 Hispanic or Latino householders
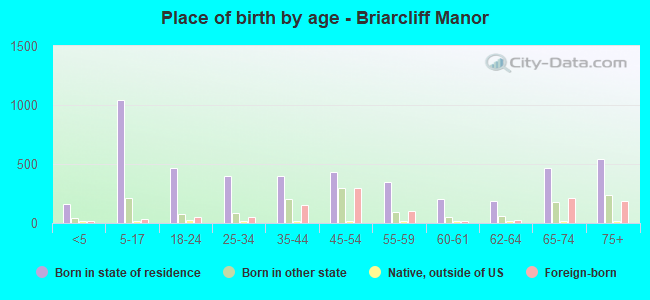
Median age by race in Briarcliff Manor
52.0 Median age for White residents48.0 53.6 53.1 Median age for Black or African American residents58.2 27.5 -641,441,440.8 Median age for American Indian / Alaska Native residents-664,804,468.6 -554,999,999.4 47.7 Median age for Asian residents39.3 49.7 -487,992,314.6 Median age for Native Hawaiian / Pacific Islander residents-477,502,295.2 -666,666,666.0 48.4 Median age for Other race residents38.7 47.8 27.0 Median age for Two or more races residents43.2 22.7 51.2 Median age for White alone residents47.2 53.5 30.9 Median age for Hispanic or Latino residents37.0 27.6
Owner/renter occupied households by race in Briarcliff Manor
House owners and renters - White residents 1,854 84.0% Owner occupied353 16.0% Renter occupiedHouse owners and renters - Black or African American residents 18 38.5% Owner occupied29 61.5% Renter occupiedHouse owners and renters - Asian residents 131 83.1% Owner occupied27 16.9% Renter occupiedHouse owners and renters - Other race residents 16 38.1% Owner occupied27 61.9% Renter occupiedHouse owners and renters - Two or more races residents 172 85.4% Owner occupied29 14.6% Renter occupiedHouse owners and renters - White alone residents 1,877 82.9% Owner occupied388 17.1% Renter occupiedHouse owners and renters - Hispanic or Latino residents 141 84.7% Owner occupied26 15.3% Renter occupied
Language usage in Briarcliff Manor
English speakers - Total 84.5% of residents of Briarcliff Manor speak English at home.
3.2% of residents speak Spanish at home 166 73.5% Speak English very well60 26.5% Speak English less than very well12.0% of residents speak other language at home 696 81.3% Speak English very well160 18.7% Speak English less than very well
English speakers - Born in the United States 95.9% of residents of Briarcliff Manor speak English at home.
2.0% of residents speak Spanish at home 29 100.0% Speak English very well3.5% of residents speak other language at home 45 86.5% Speak English very well7 13.5% Speak English less than very well
English speakers - Native, born elsewhere 68.9% of residents of Briarcliff Manor speak English at home.
18.0% of residents speak Spanish at home 10 90.9% Speak English very well1 9.1% Speak English less than very well
English speakers - Foreign-born 44.8% of residents of Briarcliff Manor speak English at home.
10.8% of residents speak Spanish at home 85 69.7% Speak English very well37 30.3% Speak English less than very well46.3% of residents speak other language at home 382 73.0% Speak English very well141 27.0% Speak English less than very well
White (Caucasian) - Speak only English Native:
96.1% (4,498)Foreign-born:
54.2% (252)
White (Caucasian) - Speak another language Native:
5.1% (238)Foreign-born:
51.7% (240)
Black or African American - Speak only English Native:
83.5% (66)Foreign-born:
65.6% (19)
Black or African American - Speak another language Native:
14.5% (11)Foreign-born:
34.4% (10)
Asian - Speak only English Native:
84.2% (160)Foreign-born:
47.6% (162)
Asian - Speak another language Native:
15.5% (29)Foreign-born:
54.5% (185)
Other race - Speak another language Native:
35.9% (56)Foreign-born:
96.8% (75)
Two or more races - Speak only English Native:
92.4% (850)Foreign-born:
44.6% (42)
Two or more races - Speak another language Native:
9.0% (83)Foreign-born:
52.2% (49)
White alone - Speak only English Native:
94.7% (4,559)Foreign-born:
47.1% (246)
White alone - Speak another language Native:
5.5% (263)Foreign-born:
54.3% (283)
Hispanic or Latino - Speak only English Native:
84.3% (480)Foreign-born:
9.3% (11)
Hispanic or Latino - Speak another language Native:
8.4% (48)Foreign-born:
91.1% (112)
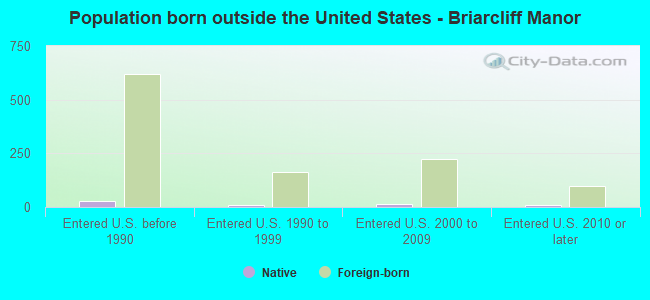
Foreign-born residents in Briarcliff Manor 1,116 residents are foreign born (6.1% Europe , 5.8% Asia , 2.7% Latin America ).
This city:
15.2%New York:
22.6%
Marital status for residents in Briarcliff Manor Marital status - White (Caucasian) population 15 years and over
Males 29.5% Never married65.0% Now married0.8% Separated2.7% Widowed2.0% DivorcedFemales 17.9% Never married62.7% Now married1.3% Separated8.3% Widowed9.8% DivorcedWomen who gave birth in the past 12 months Now married:
100.0% (11)Unmarried:
0.0% (0)
Women who did not give birth in the past 12 months Now married:
54.0% (485)Unmarried:
46.0% (413)
Marital status - Black or African American population 15 years and over
Males 60.0% Never married40.0% Now married0.0% Separated0.0% Widowed0.0% DivorcedFemales 62.3% Never married26.1% Now married4.3% Separated0.0% Widowed7.2% DivorcedWomen who did not give birth in the past 12 months Now married:
0.0% (0)Unmarried:
100.0% (42)
Marital status - Asian population 15 years and over
Males 25.6% Never married74.4% Now married0.0% Separated0.0% Widowed0.0% DivorcedFemales 14.2% Never married75.8% Now married0.0% Separated0.0% Widowed10.0% DivorcedWomen who did not give birth in the past 12 months Now married:
73.9% (83)Unmarried:
26.1% (29)
Marital status - Other race population 15 years and over
Males 29.9% Never married70.1% Now married0.0% Separated0.0% Widowed0.0% DivorcedFemales 25.0% Never married63.0% Now married0.0% Separated9.0% Widowed3.0% DivorcedWomen who did not give birth in the past 12 months Now married:
47.9% (26)Unmarried:
52.1% (28)
Marital status - Two or more races population 15 years and over
Males 16.6% Never married77.7% Now married2.9% Separated0.0% Widowed2.9% DivorcedFemales 56.6% Never married37.1% Now married0.0% Separated0.0% Widowed6.3% DivorcedWomen who gave birth in the past 12 months Now married:
100.0% (29)Unmarried:
0.0% (0)
Women who did not give birth in the past 12 months Now married:
14.3% (20)Unmarried:
85.7% (122)
Marital status - White alone, not Hispanic / Latino population 15 years and over
Males 30.2% Never married64.1% Now married0.9% Separated2.8% Widowed2.0% DivorcedFemales 17.8% Never married62.7% Now married1.3% Separated8.4% Widowed9.9% DivorcedWomen who gave birth in the past 12 months Now married:
100.0% (11)Unmarried:
0.0% (0)
Women who did not give birth in the past 12 months Now married:
54.2% (510)Unmarried:
45.8% (431)
Marital status - Hispanic or Latino population 15 years and over
Males 13.7% Never married86.3% Now married0.0% Separated0.0% Widowed0.0% DivorcedFemales 34.1% Never married54.3% Now married0.0% Separated7.0% Widowed4.7% DivorcedWomen who did not give birth in the past 12 months Now married:
43.1% (31)Unmarried:
56.9% (41)
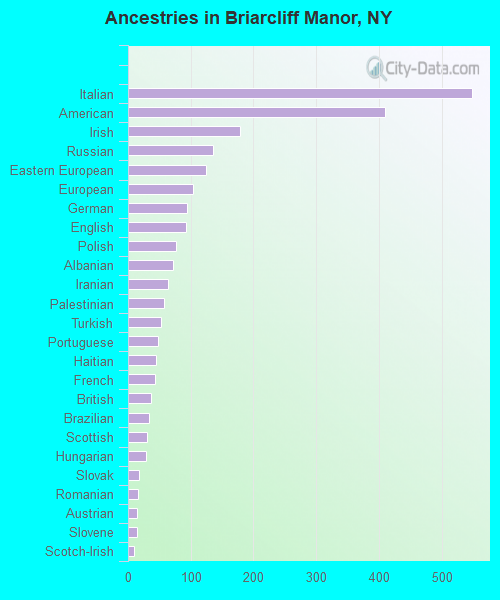
Ancestries in Briarcliff Manor
548 16.2% Italian409 12.1% American178 5.2% Irish135 4.0% Russian125 3.7% Eastern European103 3.0% European94 2.8% German92 2.7% English77 2.3% Polish72 2.1% Albanian63 1.9% Iranian58 1.7% Palestinian52 1.5% Turkish48 1.4% Portuguese44 1.3% Haitian43 1.3% French36 1.1% British34 1.0% Brazilian30 0.9% Scottish28 0.8% Hungarian18 0.5% Slovak16 0.5% Romanian15 0.4% Austrian15 0.4% Slovene9 0.3% Scotch-Irish8 0.2% Belgian8 0.2% Guyanese8 0.2% Yugoslavian7 0.2% Armenian7 0.2% Danish7 0.2% Jamaican6 0.2% Greek6 0.2% Serbian2 0.06% West Indian
Children Nativity (place of birth) in Briarcliff Manor
Children under 6 years - Living with two parents Both parents native 275 100.0% NativeBoth parents foreign-born 65 100.0% NativeOne native, one foreign-born parent 43 100.0% NativeChildren under 6 years - Living with one parent Native parent 5 100.0% NativeChildren 6 to 17 years - Living with two parents Both parents native 593 100.0% NativeBoth parents foreign-born 155 88.6% Native20 11.4% Foreign-bornOne native, one foreign-born parent 100 100.0% NativeChildren 6 to 17 years - Living with one parent Native parent 210 100.0% NativeForeign-born parent 17 51.2% Native16 48.8% Foreign-born