Races in Dobbs Ferry, New York (NY) Detailed Stats
Data:
Races - White alone (%)
Races - White alone (% change since 2000)
Races - Black alone (%)
Races - Black alone (% change since 2000)
Races - American Indian alone (%)
Races - American Indian alone (% change since 2000)
Races - Asian alone (%)
Races - Asian alone (% change since 2000)
Races - Hispanic (%)
Races - Hispanic (% change since 2000)
Races - Native Hawaiian and Other Pacific Islander alone (%)
Races - Native Hawaiian and Other Pacific Islander alone (% change since 2000)
Races - Two or more races(%)
Races - Two or more races(% change since 2000)
Races - Other race alone (%)
Races - Other race alone (% change since 2000)
Racial diversity
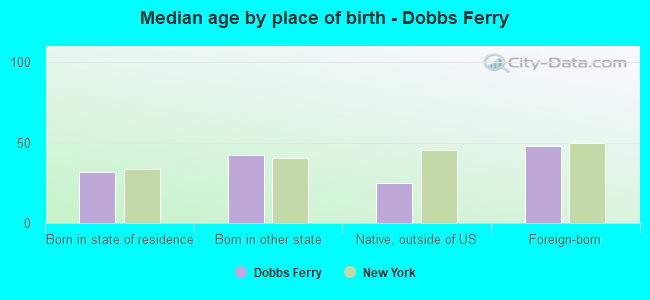
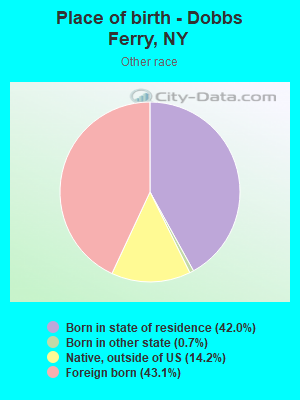
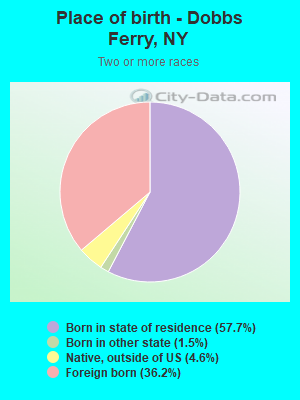
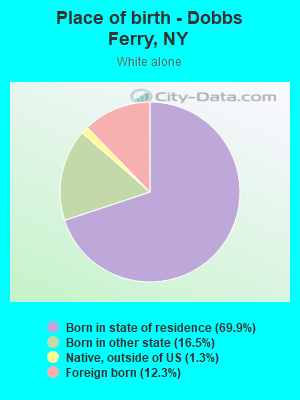
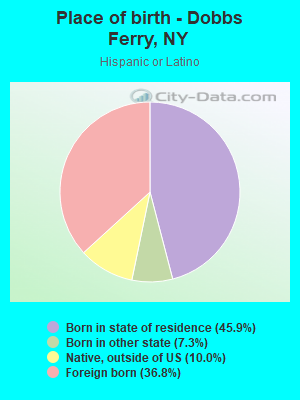
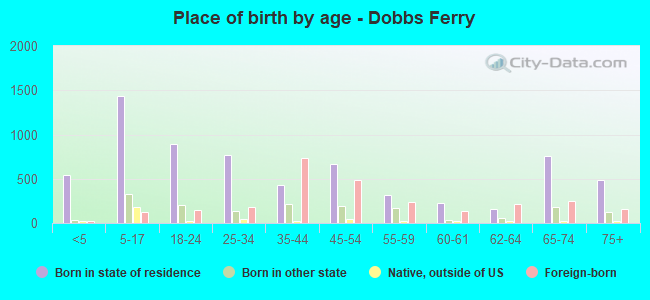
Place of birth - Born in state of residence (%)
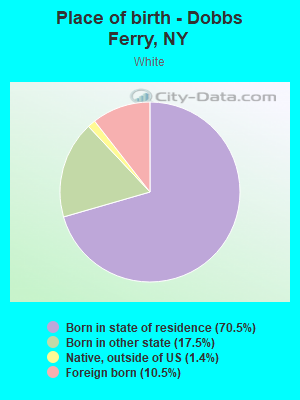
Place of birth - Born in state of residence (%) - White
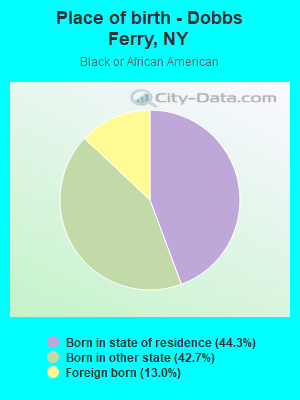
Place of birth - Born in state of residence (%) - Black or African American
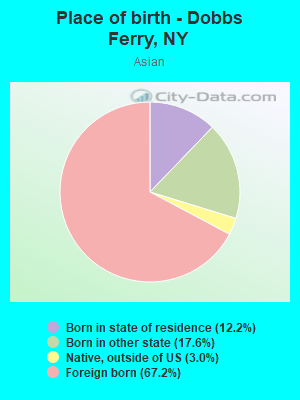
Place of birth - Born in state of residence (%) - Asian
Place of birth - Born in state of residence (%) - Hispanic or Latino
Place of birth - Born in state of residence (%) - American Indian and Alaska Native
Place of birth - Born in state of residence (%) - Multirace
Place of birth - Born in state of residence (%) - Other Race
Place of birth - Born in other state (%)
Place of birth - Born in other state (%) - White
Place of birth - Born in other state (%) - Black or African American
Place of birth - Born in other state (%) - Asian
Place of birth - Born in other state (%) - Hispanic or Latino
Place of birth - Born in other state (%) - American Indian and Alaska Native
Place of birth - Born in other state (%) - Multirace
Place of birth - Born in other state (%) - Other Race
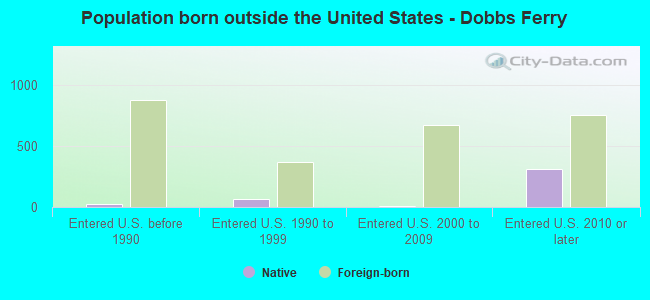
Place of birth - Native, outside of US (%)
Place of birth - Native, outside of US (%) - White
Place of birth - Native, outside of US (%) - Black or African American
Place of birth - Native, outside of US (%) - Asian
Place of birth - Native, outside of US (%) - Hispanic or Latino
Place of birth - Native, outside of US (%) - American Indian and Alaska Native
Place of birth - Native, outside of US (%) - Multirace
Place of birth - Native, outside of US (%) - Other Race
Place of birth - Foreign born (%)
Place of birth - Foreign born (%) - White
Place of birth - Foreign born (%) - Black or African American
Place of birth - Foreign born (%) - Asian
Place of birth - Foreign born (%) - Hispanic or Latino
Place of birth - Foreign born (%) - American Indian and Alaska Native
Place of birth - Foreign born (%) - Multirace
Place of birth - Foreign born (%) - Other Race
Residents speaking English at home (%)
Residents speaking English at home - Born in the United States (%)
Residents speaking English at home - Native, born elsewhere (%)
Residents speaking English at home - Foreign born (%)
Residents speaking Spanish at home (%)
Residents speaking Spanish at home - Born in the United States (%)
Residents speaking Spanish at home - Native, born elsewhere (%)
Residents speaking Spanish at home - Foreign born (%)
Residents speaking other language at home (%)
Residents speaking other language at home - Born in the United States (%)
Residents speaking other language at home - Native, born elsewhere (%)
Residents speaking other language at home - Foreign born (%)
Marital status - Never married (%)
Marital status - Now married (%)
Marital status - Separated (%)
Marital status - Widowed (%)
Marital status - Divorced (%)
Ancestries Reported - Arab (%)
Ancestries Reported - Czech (%)
Ancestries Reported - Danish (%)
Ancestries Reported - Dutch (%)
Ancestries Reported - English (%)
Ancestries Reported - French (%)
Ancestries Reported - French Canadian (%)
Ancestries Reported - German (%)
Ancestries Reported - Greek (%)
Ancestries Reported - Hungarian (%)
Ancestries Reported - Irish (%)
Ancestries Reported - Italian (%)
Ancestries Reported - Lithuanian (%)
Ancestries Reported - Norwegian (%)
Ancestries Reported - Polish (%)
Ancestries Reported - Portuguese (%)
Ancestries Reported - Russian (%)
Ancestries Reported - Scotch-Irish (%)
Ancestries Reported - Scottish (%)
Ancestries Reported - Slovak (%)
Ancestries Reported - Subsaharan African (%)
Ancestries Reported - Swedish (%)
Ancestries Reported - Swiss (%)
Ancestries Reported - Ukrainian (%)
Ancestries Reported - United States (%)
Ancestries Reported - Welsh (%)
Ancestries Reported - West Indian (%)
Ancestries Reported - Other (%)
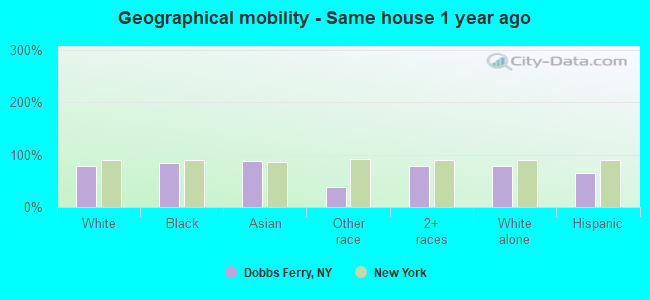
Geographical mobility - Same house 1 year ago (%)
Geographical mobility - Same house 1 year ago (%) - White
Geographical mobility - Same house 1 year ago (%) - Black or African American
Geographical mobility - Same house 1 year ago (%) - Asian
Geographical mobility - Same house 1 year ago (%) - Hispanic or Latino
Geographical mobility - Same house 1 year ago (%) - American Indian and Alaska Native
Geographical mobility - Same house 1 year ago (%) - Multirace
Geographical mobility - Same house 1 year ago (%) - Other Race
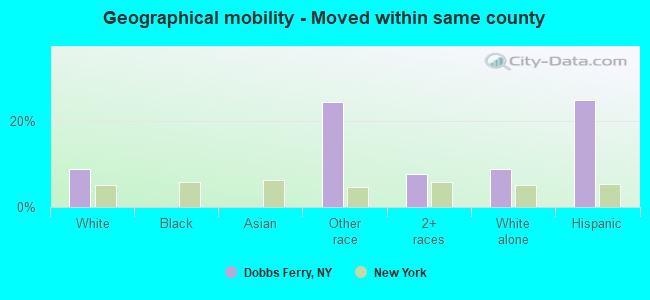
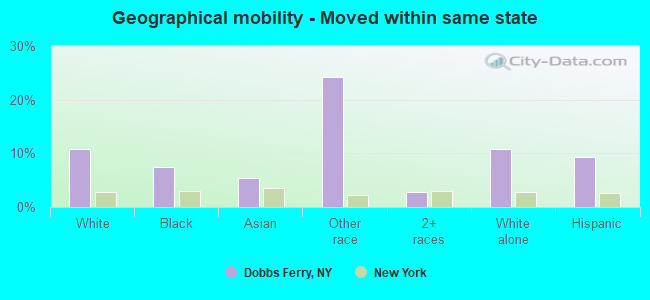
Geographical mobility - Moved within same county (%)
Geographical mobility - Moved within same county (%) - White
Geographical mobility - Moved within same county (%) - Black or African American
Geographical mobility - Moved within same county (%) - Asian
Geographical mobility - Moved within same county (%) - Hispanic or Latino
Geographical mobility - Moved within same county (%) - American Indian and Alaska Native
Geographical mobility - Moved within same county (%) - Multirace
Geographical mobility - Moved within same county (%) - Other Race
Geographical mobility - Moved from different county within same state (%)
Geographical mobility - Moved from different county within same state (%) - White
Geographical mobility - Moved from different county within same state (%) - Black or African American
Geographical mobility - Moved from different county within same state (%) - Asian
Geographical mobility - Moved from different county within same state (%) - Hispanic or Latino
Geographical mobility - Moved from different county within same state (%) - American Indian and Alaska Native
Geographical mobility - Moved from different county within same state (%) - Multirace
Geographical mobility - Moved from different county within same state (%) - Other Race
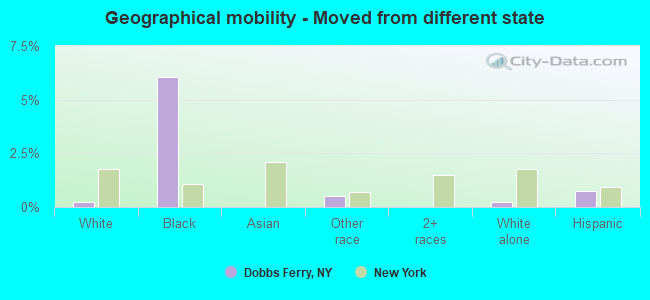
Geographical mobility - Moved from different state (%)
Geographical mobility - Moved from different state (%) - White
Geographical mobility - Moved from different state (%) - Black or African American
Geographical mobility - Moved from different state (%) - Asian
Geographical mobility - Moved from different state (%) - Hispanic or Latino
Geographical mobility - Moved from different state (%) - American Indian and Alaska Native
Geographical mobility - Moved from different state (%) - Multirace
Geographical mobility - Moved from different state (%) - Other Race
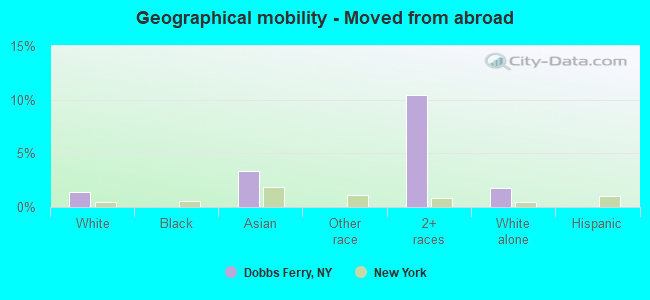
Geographical mobility - Moved from abroad (%)
Geographical mobility - Moved from abroad (%) - White
Geographical mobility - Moved from abroad (%) - Black or African American
Geographical mobility - Moved from abroad (%) - Asian
Geographical mobility - Moved from abroad (%) - Hispanic or Latino
Geographical mobility - Moved from abroad (%) - American Indian and Alaska Native
Geographical mobility - Moved from abroad (%) - Multirace
Geographical mobility - Moved from abroad (%) - Other Race
Place of birth for the foreign-born population - Ireland (%)
Place of birth for the foreign-born population - Denmark (%)
Place of birth for the foreign-born population - Norway (%)
Place of birth for the foreign-born population - Sweden (%)
Place of birth for the foreign-born population - United Kingdom (%)
Place of birth for the foreign-born population - England (%)
Place of birth for the foreign-born population - Scotland (%)
Place of birth for the foreign-born population - Other Northern Europe (%)
Place of birth for the foreign-born population - Austria (%)
Place of birth for the foreign-born population - Belgium (%)
Place of birth for the foreign-born population - France (%)
Place of birth for the foreign-born population - Germany (%)
Place of birth for the foreign-born population - Netherlands (%)
Place of birth for the foreign-born population - Switzerland (%)
Place of birth for the foreign-born population - Other Western Europe (%)
Place of birth for the foreign-born population - Greece (%)
Place of birth for the foreign-born population - Italy (%)
Place of birth for the foreign-born population - Portugal (%)
Place of birth for the foreign-born population - Spain (%)
Place of birth for the foreign-born population - Other Southern Europe (%)
Place of birth for the foreign-born population - Albania (%)
Place of birth for the foreign-born population - Belarus (%)
Place of birth for the foreign-born population - Bosnia and Herzegovina (%)
Place of birth for the foreign-born population - Bulgaria (%)
Place of birth for the foreign-born population - Croatia (%)
Place of birth for the foreign-born population - Czechoslovakia (%)
Place of birth for the foreign-born population - Hungary (%)
Place of birth for the foreign-born population - Latvia (%)
Place of birth for the foreign-born population - Lithuania (%)
Place of birth for the foreign-born population - North Macedonia (Macedonia) (%)
Place of birth for the foreign-born population - Moldova (%)
Place of birth for the foreign-born population - Poland (%)
Place of birth for the foreign-born population - Romania (%)
Place of birth for the foreign-born population - Russia (%)
Place of birth for the foreign-born population - Serbia (%)
Place of birth for the foreign-born population - Ukraine (%)
Place of birth for the foreign-born population - Other Eastern Europe (%)
Place of birth for the foreign-born population - China (%)
Place of birth for the foreign-born population - Hong Kong (%)
Place of birth for the foreign-born population - Taiwan (%)
Place of birth for the foreign-born population - Japan (%)
Place of birth for the foreign-born population - Korea (%)
Place of birth for the foreign-born population - Other Eastern Asia (%)
Place of birth for the foreign-born population - Afghanistan (%)
Place of birth for the foreign-born population - Bangladesh (%)
Place of birth for the foreign-born population - India (%)
Place of birth for the foreign-born population - Iran (%)
Place of birth for the foreign-born population - Kazakhstan (%)
Place of birth for the foreign-born population - Nepal (%)
Place of birth for the foreign-born population - Pakistan (%)
Place of birth for the foreign-born population - Sri Lanka (%)
Place of birth for the foreign-born population - Uzbekistan (%)
Place of birth for the foreign-born population - Other South Central Asia (%)
Place of birth for the foreign-born population - Burma (%)
Place of birth for the foreign-born population - Cambodia (%)
Place of birth for the foreign-born population - Indonesia (%)
Place of birth for the foreign-born population - Laos (%)
Place of birth for the foreign-born population - Malaysia (%)
Place of birth for the foreign-born population - Philippines (%)
Place of birth for the foreign-born population - Singapore (%)
Place of birth for the foreign-born population - Thailand (%)
Place of birth for the foreign-born population - Vietnam (%)
Place of birth for the foreign-born population - Other South Eastern Asia (%)
Place of birth for the foreign-born population - Armenia (%)
Place of birth for the foreign-born population - Iraq (%)
Place of birth for the foreign-born population - Israel (%)
Place of birth for the foreign-born population - Jordan (%)
Place of birth for the foreign-born population - Kuwait (%)
Place of birth for the foreign-born population - Lebanon (%)
Place of birth for the foreign-born population - Saudi Arabia (%)
Place of birth for the foreign-born population - Syria (%)
Place of birth for the foreign-born population - Turkey (%)
Place of birth for the foreign-born population - Yemen (%)
Place of birth for the foreign-born population - Other Western Asia (%)
Place of birth for the foreign-born population - Eritrea (%)
Place of birth for the foreign-born population - Ethiopia (%)
Place of birth for the foreign-born population - Kenya (%)
Place of birth for the foreign-born population - Somalia (%)
Place of birth for the foreign-born population - Uganda (%)
Place of birth for the foreign-born population - Zimbabwe (%)
Place of birth for the foreign-born population - Other Eastern Africa (%)
Place of birth for the foreign-born population - Cameroon (%)
Place of birth for the foreign-born population - Congo (%)
Place of birth for the foreign-born population - Democratic Republic of Congo (Zaire) (%)
Place of birth for the foreign-born population - Other Middle Africa (%)
Place of birth for the foreign-born population - Egypt (%)
Place of birth for the foreign-born population - Morocco (%)
Place of birth for the foreign-born population - Sudan (%)
Place of birth for the foreign-born population - Other Northern Africa (%)
Place of birth for the foreign-born population - South Africa (%)
Place of birth for the foreign-born population - Other Southern Africa (%)
Place of birth for the foreign-born population - Cabo Verde (%)
Place of birth for the foreign-born population - Ghana (%)
Place of birth for the foreign-born population - Liberia (%)
Place of birth for the foreign-born population - Nigeria (%)
Place of birth for the foreign-born population - Senegal (%)
Place of birth for the foreign-born population - Sierra Leone (%)
Place of birth for the foreign-born population - Other Western Africa (%)
Place of birth for the foreign-born population - Australia (%)
Place of birth for the foreign-born population - New Zealand (%)
Place of birth for the foreign-born population - Fiji (%)
Place of birth for the foreign-born population - Micronesia (%)
Place of birth for the foreign-born population - Bahamas (%)
Place of birth for the foreign-born population - Barbados (%)
Place of birth for the foreign-born population - Cuba (%)
Place of birth for the foreign-born population - Dominica (%)
Place of birth for the foreign-born population - Dominican Republic (%)
Place of birth for the foreign-born population - Grenada (%)
Place of birth for the foreign-born population - Haiti (%)
Place of birth for the foreign-born population - Jamaica (%)
Place of birth for the foreign-born population - St. Vincent and the Grenadines (%)
Place of birth for the foreign-born population - Trinidad and Tobago (%)
Place of birth for the foreign-born population - West Indies (%)
Place of birth for the foreign-born population - Other Caribbean (%)
Place of birth for the foreign-born population - Belize (%)
Place of birth for the foreign-born population - Costa Rica (%)
Place of birth for the foreign-born population - El Salvador (%)
Place of birth for the foreign-born population - Guatemala (%)
Place of birth for the foreign-born population - Honduras (%)
Place of birth for the foreign-born population - Mexico (%)
Place of birth for the foreign-born population - Nicaragua (%)
Place of birth for the foreign-born population - Panama (%)
Place of birth for the foreign-born population - Other Central America (%)
Place of birth for the foreign-born population - Argentina (%)
Place of birth for the foreign-born population - Bolivia (%)
Place of birth for the foreign-born population - Brazil (%)
Place of birth for the foreign-born population - Chile (%)
Place of birth for the foreign-born population - Colombia (%)
Place of birth for the foreign-born population - Ecuador (%)
Place of birth for the foreign-born population - Guyana (%)
Place of birth for the foreign-born population - Peru (%)
Place of birth for the foreign-born population - Uruguay (%)
Place of birth for the foreign-born population - Venezuela (%)
Place of birth for the foreign-born population - Other South America (%)
Place of birth for the foreign-born population - Canada (%)
Place of birth for the foreign-born population - Other Northern America (%)
Place of birth for the foreign-born population - Other (%)
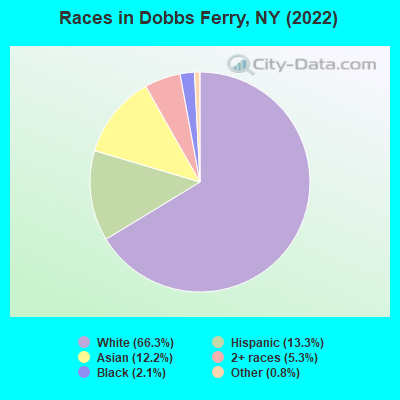
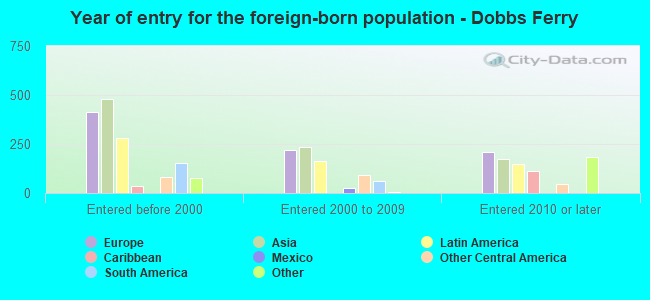
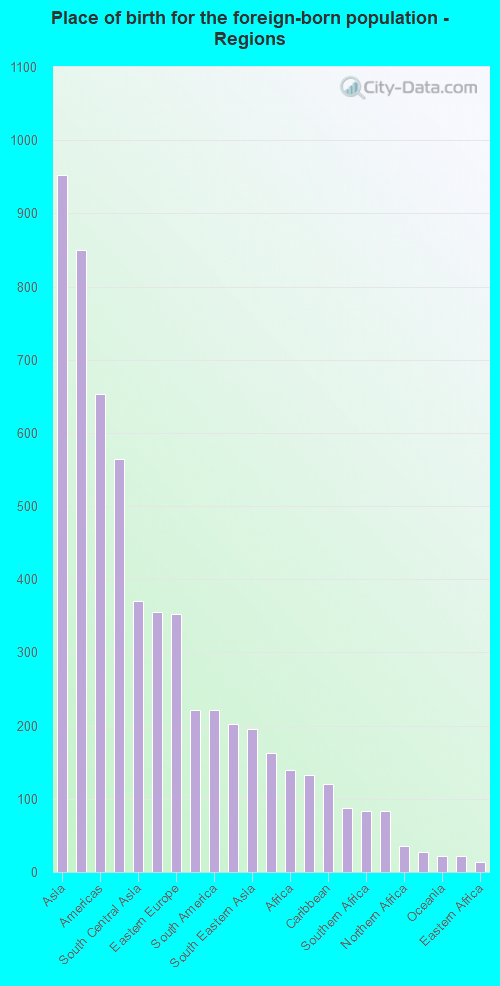
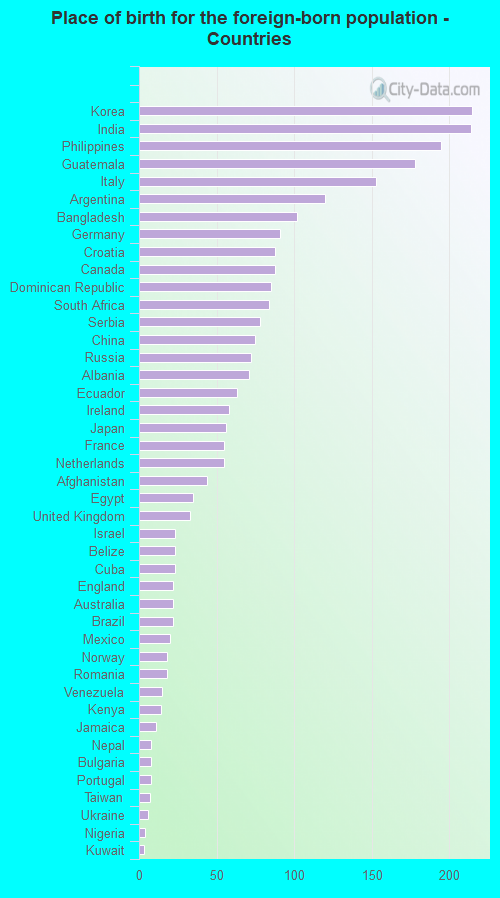
According to 2022 data, the most numerous races in Dobbs Ferry, NY are White alone (7,523 residents), Hispanic (1,514 residents), and Black alone (238 residents). 68.9% of Dobbs Ferry residents speak English at home. 23.1% of Dobbs Ferry, NY residents are foreign-born (8.4% born in Asia, 7.5% born in Europe, 5.0% born in Latin America), which is 4.7% greater than the foreign-born rate of 22.0% across the entire state of New York.
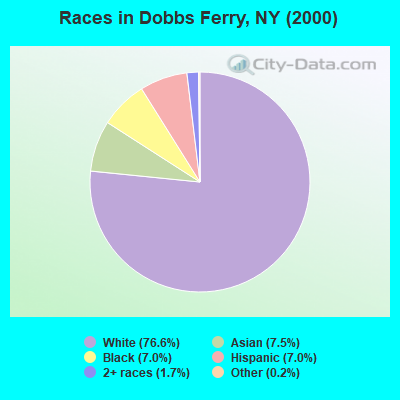
Race distribution in Dobbs Ferry
2000 2022
11,760,981 62.0% White alone 2,867,583 15.1% Hispanic 2,812,623 14.8% Black alone 1,035,926 5.5% Asian alone 366,116 1.9% Two or more races 75,499 0.4% Other race alone 52,499 0.3% American Indian alone 5,230 0.03% Native Hawaiian and Other
10,408,933 52.9% White alone 3,867,299 19.7% Hispanic 2,633,840 13.4% Black alone 1,776,286 9.0% Asian alone 732,670 3.7% Two or more races 216,110 1.1% Other race alone 35,082 0.2% American Indian alone 6,931 0.04% Native Hawaiian and Other
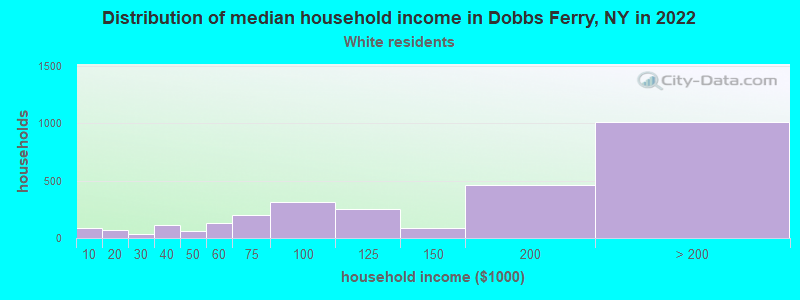
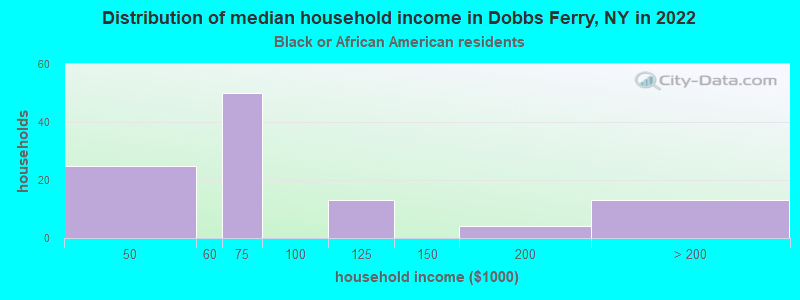
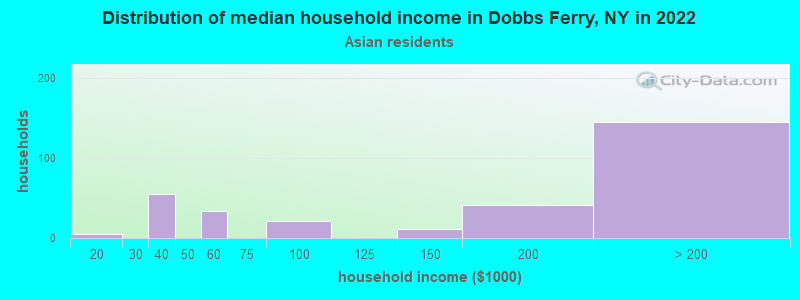
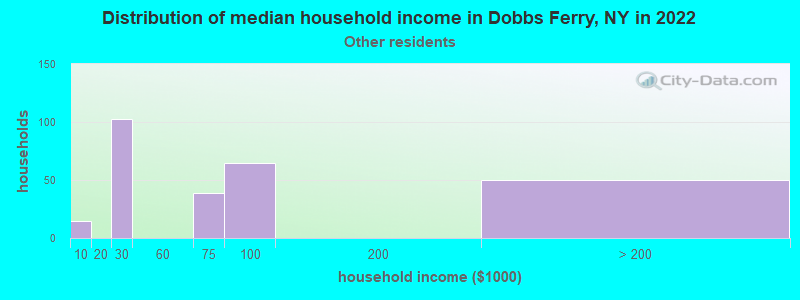
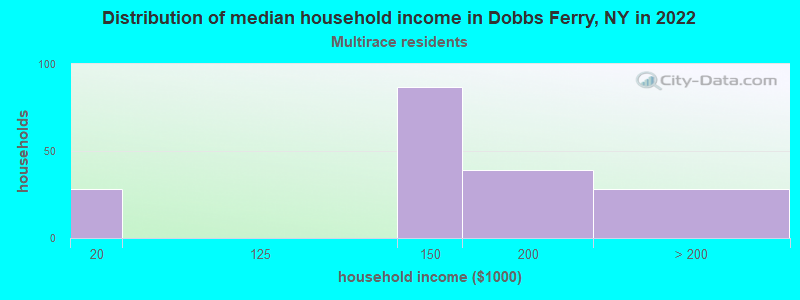
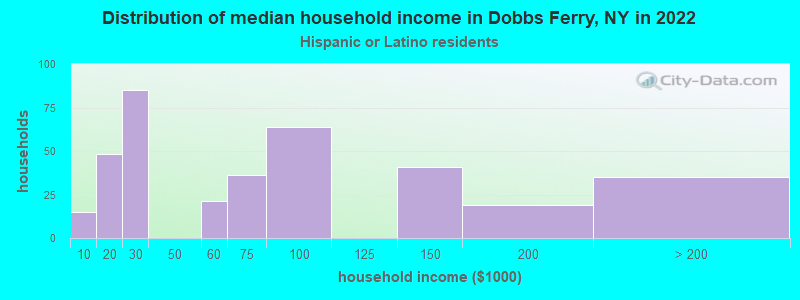
Income and house value in Dobbs Ferry Median household income in 2022 $156,919 White non-Hispanic householders$57,732 Black householders$155,482 Asian householders$115,267 Two or more races householders$64,660 Hispanic or Latino race householdersMedian 2022 house value $764,027 White Non-Hispanic householders $779,438 Asian householders$754,920 Some other race householders$653,112 Two or more races householders$831,043 Hispanic or Latino householders
Median age by race in Dobbs Ferry
45.2 Median age for White residents43.9 45.5 22.4 Median age for Black or African American residents19.2 30.3 -641,441,440.8 Median age for American Indian / Alaska Native residents-664,804,468.6 -554,999,999.4 41.7 Median age for Asian residents39.2 46.0 -487,992,314.6 Median age for Native Hawaiian / Pacific Islander residents-477,502,295.2 -666,666,666.0 23.7 Median age for Other race residents16.3 28.4 26.2 Median age for Two or more races residents18.5 48.8 45.1 Median age for White alone residents43.9 45.8 29.4 Median age for Hispanic or Latino residents20.8 35.3
Owner/renter occupied households by race in Dobbs Ferry
House owners and renters - White residents 1,920 69.2% Owner occupied854 30.8% Renter occupiedHouse owners and renters - Black or African American residents 15 13.8% Owner occupied95 86.2% Renter occupiedHouse owners and renters - Asian residents 278 81.1% Owner occupied65 18.9% Renter occupiedHouse owners and renters - Other race residents 48 18.2% Owner occupied216 81.8% Renter occupiedHouse owners and renters - Two or more races residents 118 64.3% Owner occupied65 35.7% Renter occupiedHouse owners and renters - White alone residents 1,974 69.9% Owner occupied849 30.1% Renter occupiedHouse owners and renters - Hispanic or Latino residents 32 8.7% Owner occupied337 91.3% Renter occupied
Language usage in Dobbs Ferry
English speakers - Total 68.9% of residents of Dobbs Ferry speak English at home.
9.4% of residents speak Spanish at home 853 83.9% Speak English very well164 16.1% Speak English less than very well20.9% of residents speak other language at home 1,530 67.8% Speak English very well727 32.2% Speak English less than very well
English speakers - Born in the United States 86.7% of residents of Dobbs Ferry speak English at home.
3.5% of residents speak Spanish at home 44 74.6% Speak English very well15 25.4% Speak English less than very well9.3% of residents speak other language at home 156 100.0% Speak English very well
English speakers - Native, born elsewhere 31.7% of residents of Dobbs Ferry speak English at home.
52.3% of residents speak Spanish at home 146 91.2% Speak English very well14 8.8% Speak English less than very well18.6% of residents speak other language at home 57 100.0% Speak English very well
English speakers - Foreign-born 17.9% of residents of Dobbs Ferry speak English at home.
19.1% of residents speak Spanish at home 389 76.7% Speak English very well118 23.3% Speak English less than very well61.5% of residents speak other language at home 995 61.0% Speak English very well636 39.0% Speak English less than very well
White (Caucasian) - Speak only English Native:
91.7% (5,894)Foreign-born:
40.6% (320)
White (Caucasian) - Speak another language Native:
8.4% (538)Foreign-born:
60.7% (479)
Black or African American - Speak only English Native:
94.9% (214)Foreign-born:
87.9% (31)
Black or African American - Speak another language Native:
5.7% (13)Foreign-born:
14.5% (5)
Asian - Speak only English Native:
72.2% (291)Foreign-born:
3.5% (32)
Asian - Speak another language Native:
27.6% (111)Foreign-born:
95.6% (879)
Other race - Speak another language Native:
61.8% (235)Foreign-born:
96.8% (348)
Two or more races - Speak only English Native:
65.8% (370)Foreign-born:
14.9% (65)
Two or more races - Speak another language Native:
34.5% (194)Foreign-born:
84.8% (368)
White alone - Speak only English Native:
91.1% (5,741)Foreign-born:
35.1% (324)
White alone - Speak another language Native:
8.7% (549)Foreign-born:
64.1% (591)
Hispanic or Latino - Speak only English Native:
51.7% (448)Foreign-born:
10.9% (61)
Hispanic or Latino - Speak another language Native:
45.7% (396)Foreign-born:
89.9% (503)
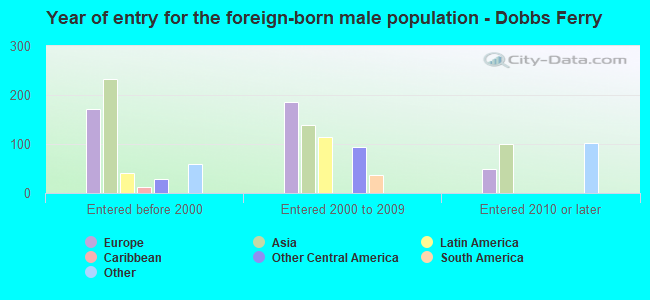
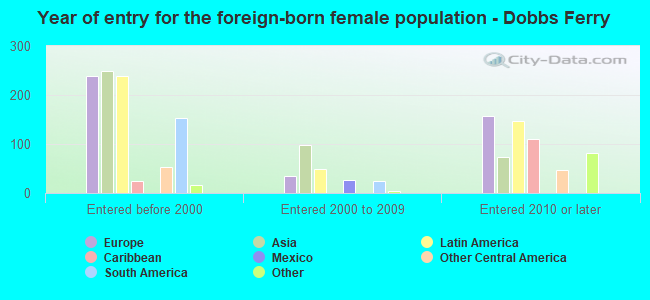
Foreign-born residents in Dobbs Ferry 2,620 residents are foreign born (8.4% Asia , 7.5% Europe , 5.0% Latin America ).
This city:
23.1%New York:
22.6%
Marital status for residents in Dobbs Ferry Marital status - White (Caucasian) population 15 years and over
Males 34.7% Never married58.4% Now married0.4% Separated2.7% Widowed3.9% DivorcedFemales 31.2% Never married50.4% Now married2.4% Separated5.2% Widowed10.7% DivorcedWomen who gave birth in the past 12 months Now married:
100.0% (68)Unmarried:
0.0% (0)
Women who did not give birth in the past 12 months Now married:
43.0% (649)Unmarried:
57.0% (859)
Marital status - Black or African American population 15 years and over
Males 57.4% Never married17.6% Now married0.0% Separated9.3% Widowed15.7% DivorcedFemales 59.4% Never married0.7% Now married0.0% Separated28.0% Widowed11.9% DivorcedWomen who did not give birth in the past 12 months Now married:
1.0% (1)Unmarried:
99.0% (99)
Marital status - Asian population 15 years and over
Males 15.6% Never married79.2% Now married0.0% Separated0.0% Widowed5.2% DivorcedFemales 21.4% Never married75.4% Now married0.0% Separated1.4% Widowed1.8% DivorcedWomen who did not give birth in the past 12 months Now married:
70.1% (266)Unmarried:
29.9% (114)
Marital status - Other race population 15 years and over
Males 40.3% Never married48.1% Now married11.6% Separated0.0% Widowed0.0% DivorcedFemales 17.5% Never married78.7% Now married0.0% Separated0.0% Widowed3.8% DivorcedWomen who did not give birth in the past 12 months Now married:
79.8% (206)Unmarried:
20.2% (52)
Marital status - Two or more races population 15 years and over
Males 78.5% Never married21.5% Now married0.0% Separated0.0% Widowed0.0% DivorcedFemales 31.1% Never married53.3% Now married6.6% Separated7.9% Widowed1.1% DivorcedWomen who did not give birth in the past 12 months Now married:
35.3% (99)Unmarried:
64.7% (181)
Marital status - White alone, not Hispanic / Latino population 15 years and over
Males 33.4% Never married60.2% Now married0.4% Separated2.9% Widowed3.2% DivorcedFemales 29.2% Never married51.4% Now married2.6% Separated5.4% Widowed11.4% DivorcedWomen who gave birth in the past 12 months Now married:
100.0% (73)Unmarried:
0.0% (0)
Women who did not give birth in the past 12 months Now married:
45.0% (650)Unmarried:
55.0% (795)
Marital status - Hispanic or Latino population 15 years and over
Males 57.3% Never married30.7% Now married6.2% Separated0.0% Widowed5.8% DivorcedFemales 31.6% Never married62.1% Now married3.3% Separated0.7% Widowed2.3% DivorcedWomen who did not give birth in the past 12 months Now married:
54.8% (273)Unmarried:
45.2% (225)
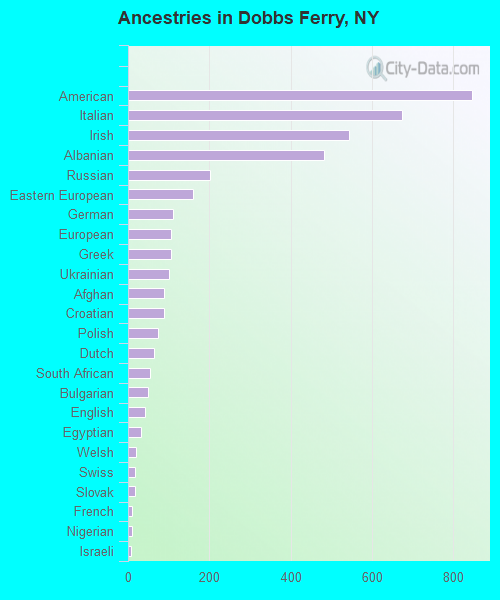
Ancestries in Dobbs Ferry
846 14.6% American673 11.6% Italian545 9.4% Irish483 8.3% Albanian202 3.5% Russian161 2.8% Eastern European110 1.9% German106 1.8% European105 1.8% Greek100 1.7% Ukrainian89 1.5% Afghan88 1.5% Croatian73 1.3% Polish63 1.1% Dutch55 0.9% South African48 0.8% Bulgarian41 0.7% English32 0.6% Egyptian20 0.3% Welsh17 0.3% Swiss16 0.3% Slovak9 0.2% French9 0.2% Nigerian8 0.1% Israeli7 0.1% Lithuanian6 0.1% Portuguese5 0.09% Haitian4 0.07% Ghanaian1 0.02% Serbian
Children Nativity (place of birth) in Dobbs Ferry
Children under 6 years - Living with two parents Both parents native 199 100.0% NativeBoth parents foreign-born 301 100.0% NativeOne native, one foreign-born parent 108 100.0% NativeChildren under 6 years - Living with one parent Native parent 6 100.0% NativeForeign-born parent 64 100.0% NativeChildren 6 to 17 years - Living with two parents Both parents native 652 99.4% Native4 0.6% Foreign-bornBoth parents foreign-born 532 97.8% Native12 2.2% Foreign-bornOne native, one foreign-born parent 211 91.9% Native19 8.1% Foreign-bornChildren 6 to 17 years - Living with one parent Native parent 172 100.0% NativeForeign-born parent 96 59.1% Native67 40.9% Foreign-born
Grandparents responsible for own grandchildren in Dobbs Ferry
Grandparents (30 to 59 years) Asian 2 100.0% Responsible for grandchildren
Grandparents (60 years and over) Asian 64 100.0% Not responsible for grandchildren