Races in Glen Cove, New York (NY) Detailed Stats
Data:
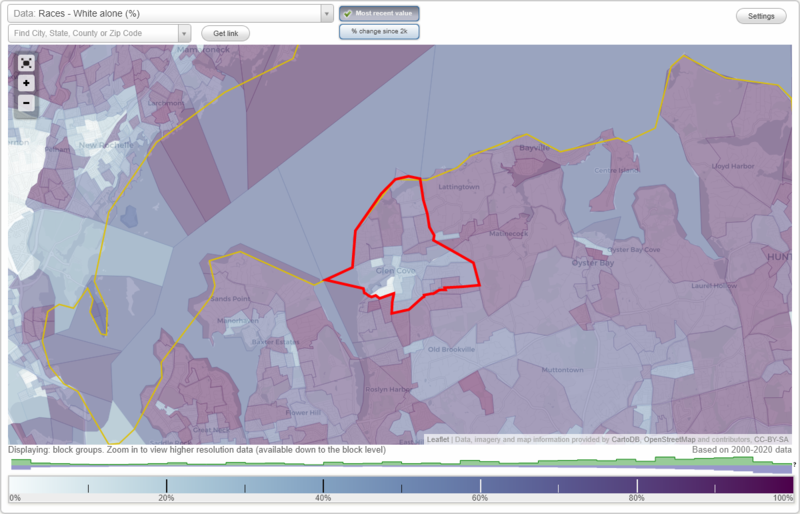
Races - White alone (%)
Races - White alone (% change since 2000)
Races - Black alone (%)
Races - Black alone (% change since 2000)
Races - American Indian alone (%)
Races - American Indian alone (% change since 2000)
Races - Asian alone (%)
Races - Asian alone (% change since 2000)
Races - Hispanic (%)
Races - Hispanic (% change since 2000)
Races - Native Hawaiian and Other Pacific Islander alone (%)
Races - Native Hawaiian and Other Pacific Islander alone (% change since 2000)
Races - Two or more races(%)
Races - Two or more races(% change since 2000)
Races - Other race alone (%)
Races - Other race alone (% change since 2000)
Racial diversity
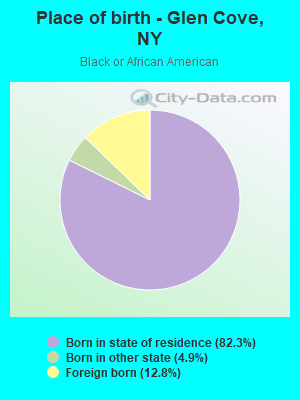
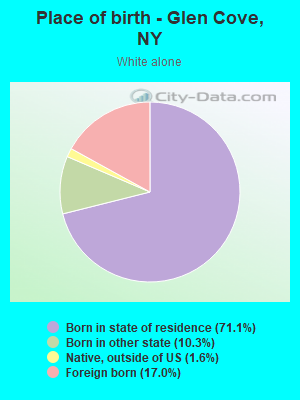
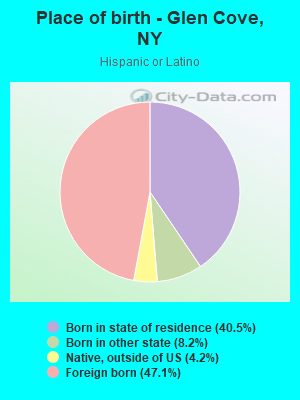
Place of birth - Born in state of residence (%)
Place of birth - Born in state of residence (%) - White
Place of birth - Born in state of residence (%) - Black or African American
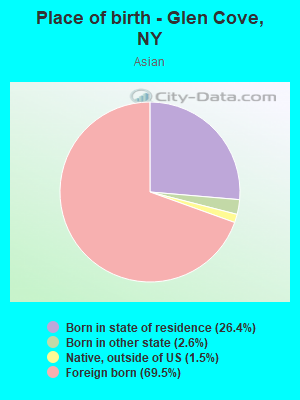
Place of birth - Born in state of residence (%) - Asian
Place of birth - Born in state of residence (%) - Hispanic or Latino
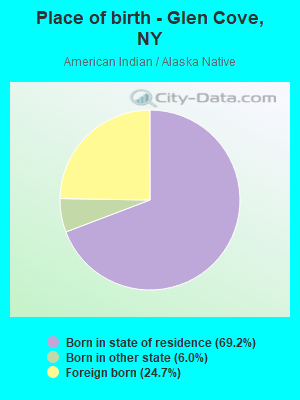
Place of birth - Born in state of residence (%) - American Indian and Alaska Native
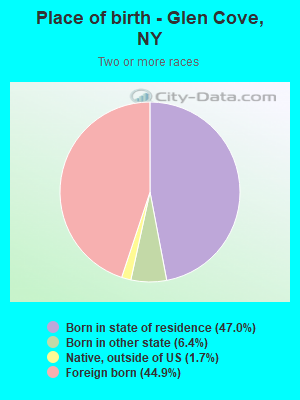
Place of birth - Born in state of residence (%) - Multirace
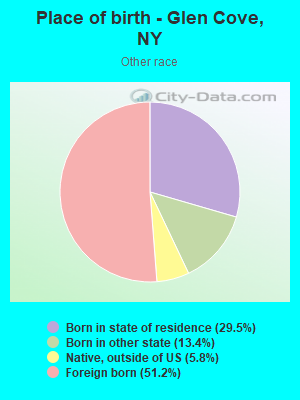
Place of birth - Born in state of residence (%) - Other Race
Place of birth - Born in other state (%)
Place of birth - Born in other state (%) - White
Place of birth - Born in other state (%) - Black or African American
Place of birth - Born in other state (%) - Asian
Place of birth - Born in other state (%) - Hispanic or Latino
Place of birth - Born in other state (%) - American Indian and Alaska Native
Place of birth - Born in other state (%) - Multirace
Place of birth - Born in other state (%) - Other Race
Place of birth - Native, outside of US (%)
Place of birth - Native, outside of US (%) - White
Place of birth - Native, outside of US (%) - Black or African American
Place of birth - Native, outside of US (%) - Asian
Place of birth - Native, outside of US (%) - Hispanic or Latino
Place of birth - Native, outside of US (%) - American Indian and Alaska Native
Place of birth - Native, outside of US (%) - Multirace
Place of birth - Native, outside of US (%) - Other Race
Place of birth - Foreign born (%)
Place of birth - Foreign born (%) - White
Place of birth - Foreign born (%) - Black or African American
Place of birth - Foreign born (%) - Asian
Place of birth - Foreign born (%) - Hispanic or Latino
Place of birth - Foreign born (%) - American Indian and Alaska Native
Place of birth - Foreign born (%) - Multirace
Place of birth - Foreign born (%) - Other Race
Residents speaking English at home (%)
Residents speaking English at home - Born in the United States (%)
Residents speaking English at home - Native, born elsewhere (%)
Residents speaking English at home - Foreign born (%)
Residents speaking Spanish at home (%)
Residents speaking Spanish at home - Born in the United States (%)
Residents speaking Spanish at home - Native, born elsewhere (%)
Residents speaking Spanish at home - Foreign born (%)
Residents speaking other language at home (%)
Residents speaking other language at home - Born in the United States (%)
Residents speaking other language at home - Native, born elsewhere (%)
Residents speaking other language at home - Foreign born (%)
Marital status - Never married (%)
Marital status - Now married (%)
Marital status - Separated (%)
Marital status - Widowed (%)
Marital status - Divorced (%)
Ancestries Reported - Arab (%)
Ancestries Reported - Czech (%)
Ancestries Reported - Danish (%)
Ancestries Reported - Dutch (%)
Ancestries Reported - English (%)
Ancestries Reported - French (%)
Ancestries Reported - French Canadian (%)
Ancestries Reported - German (%)
Ancestries Reported - Greek (%)
Ancestries Reported - Hungarian (%)
Ancestries Reported - Irish (%)
Ancestries Reported - Italian (%)
Ancestries Reported - Lithuanian (%)
Ancestries Reported - Norwegian (%)
Ancestries Reported - Polish (%)
Ancestries Reported - Portuguese (%)
Ancestries Reported - Russian (%)
Ancestries Reported - Scotch-Irish (%)
Ancestries Reported - Scottish (%)
Ancestries Reported - Slovak (%)
Ancestries Reported - Subsaharan African (%)
Ancestries Reported - Swedish (%)
Ancestries Reported - Swiss (%)
Ancestries Reported - Ukrainian (%)
Ancestries Reported - United States (%)
Ancestries Reported - Welsh (%)
Ancestries Reported - West Indian (%)
Ancestries Reported - Other (%)
Geographical mobility - Same house 1 year ago (%)
Geographical mobility - Same house 1 year ago (%) - White
Geographical mobility - Same house 1 year ago (%) - Black or African American
Geographical mobility - Same house 1 year ago (%) - Asian
Geographical mobility - Same house 1 year ago (%) - Hispanic or Latino
Geographical mobility - Same house 1 year ago (%) - American Indian and Alaska Native
Geographical mobility - Same house 1 year ago (%) - Multirace
Geographical mobility - Same house 1 year ago (%) - Other Race
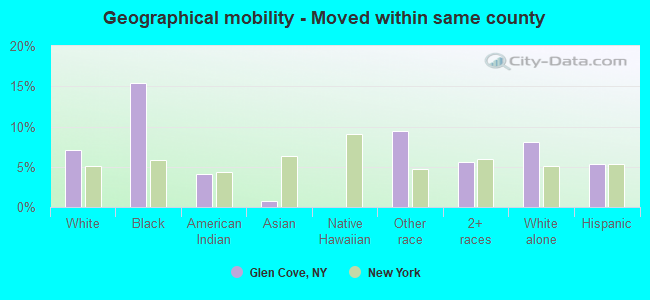
Geographical mobility - Moved within same county (%)
Geographical mobility - Moved within same county (%) - White
Geographical mobility - Moved within same county (%) - Black or African American
Geographical mobility - Moved within same county (%) - Asian
Geographical mobility - Moved within same county (%) - Hispanic or Latino
Geographical mobility - Moved within same county (%) - American Indian and Alaska Native
Geographical mobility - Moved within same county (%) - Multirace
Geographical mobility - Moved within same county (%) - Other Race
Geographical mobility - Moved from different county within same state (%)
Geographical mobility - Moved from different county within same state (%) - White
Geographical mobility - Moved from different county within same state (%) - Black or African American
Geographical mobility - Moved from different county within same state (%) - Asian
Geographical mobility - Moved from different county within same state (%) - Hispanic or Latino
Geographical mobility - Moved from different county within same state (%) - American Indian and Alaska Native
Geographical mobility - Moved from different county within same state (%) - Multirace
Geographical mobility - Moved from different county within same state (%) - Other Race
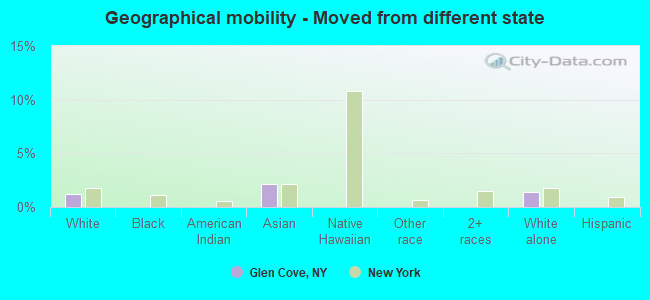
Geographical mobility - Moved from different state (%)
Geographical mobility - Moved from different state (%) - White
Geographical mobility - Moved from different state (%) - Black or African American
Geographical mobility - Moved from different state (%) - Asian
Geographical mobility - Moved from different state (%) - Hispanic or Latino
Geographical mobility - Moved from different state (%) - American Indian and Alaska Native
Geographical mobility - Moved from different state (%) - Multirace
Geographical mobility - Moved from different state (%) - Other Race
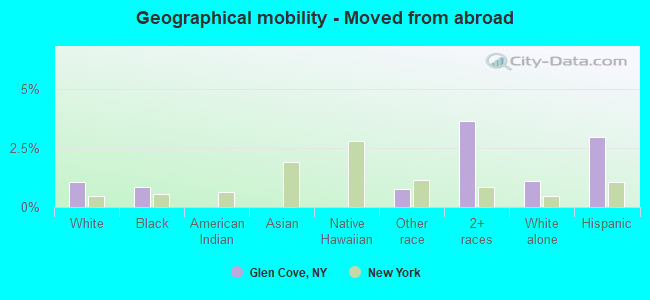
Geographical mobility - Moved from abroad (%)
Geographical mobility - Moved from abroad (%) - White
Geographical mobility - Moved from abroad (%) - Black or African American
Geographical mobility - Moved from abroad (%) - Asian
Geographical mobility - Moved from abroad (%) - Hispanic or Latino
Geographical mobility - Moved from abroad (%) - American Indian and Alaska Native
Geographical mobility - Moved from abroad (%) - Multirace
Geographical mobility - Moved from abroad (%) - Other Race
Place of birth for the foreign-born population - Ireland (%)
Place of birth for the foreign-born population - Denmark (%)
Place of birth for the foreign-born population - Norway (%)
Place of birth for the foreign-born population - Sweden (%)
Place of birth for the foreign-born population - United Kingdom (%)
Place of birth for the foreign-born population - England (%)
Place of birth for the foreign-born population - Scotland (%)
Place of birth for the foreign-born population - Other Northern Europe (%)
Place of birth for the foreign-born population - Austria (%)
Place of birth for the foreign-born population - Belgium (%)
Place of birth for the foreign-born population - France (%)
Place of birth for the foreign-born population - Germany (%)
Place of birth for the foreign-born population - Netherlands (%)
Place of birth for the foreign-born population - Switzerland (%)
Place of birth for the foreign-born population - Other Western Europe (%)
Place of birth for the foreign-born population - Greece (%)
Place of birth for the foreign-born population - Italy (%)
Place of birth for the foreign-born population - Portugal (%)
Place of birth for the foreign-born population - Spain (%)
Place of birth for the foreign-born population - Other Southern Europe (%)
Place of birth for the foreign-born population - Albania (%)
Place of birth for the foreign-born population - Belarus (%)
Place of birth for the foreign-born population - Bosnia and Herzegovina (%)
Place of birth for the foreign-born population - Bulgaria (%)
Place of birth for the foreign-born population - Croatia (%)
Place of birth for the foreign-born population - Czechoslovakia (%)
Place of birth for the foreign-born population - Hungary (%)
Place of birth for the foreign-born population - Latvia (%)
Place of birth for the foreign-born population - Lithuania (%)
Place of birth for the foreign-born population - North Macedonia (Macedonia) (%)
Place of birth for the foreign-born population - Moldova (%)
Place of birth for the foreign-born population - Poland (%)
Place of birth for the foreign-born population - Romania (%)
Place of birth for the foreign-born population - Russia (%)
Place of birth for the foreign-born population - Serbia (%)
Place of birth for the foreign-born population - Ukraine (%)
Place of birth for the foreign-born population - Other Eastern Europe (%)
Place of birth for the foreign-born population - China (%)
Place of birth for the foreign-born population - Hong Kong (%)
Place of birth for the foreign-born population - Taiwan (%)
Place of birth for the foreign-born population - Japan (%)
Place of birth for the foreign-born population - Korea (%)
Place of birth for the foreign-born population - Other Eastern Asia (%)
Place of birth for the foreign-born population - Afghanistan (%)
Place of birth for the foreign-born population - Bangladesh (%)
Place of birth for the foreign-born population - India (%)
Place of birth for the foreign-born population - Iran (%)
Place of birth for the foreign-born population - Kazakhstan (%)
Place of birth for the foreign-born population - Nepal (%)
Place of birth for the foreign-born population - Pakistan (%)
Place of birth for the foreign-born population - Sri Lanka (%)
Place of birth for the foreign-born population - Uzbekistan (%)
Place of birth for the foreign-born population - Other South Central Asia (%)
Place of birth for the foreign-born population - Burma (%)
Place of birth for the foreign-born population - Cambodia (%)
Place of birth for the foreign-born population - Indonesia (%)
Place of birth for the foreign-born population - Laos (%)
Place of birth for the foreign-born population - Malaysia (%)
Place of birth for the foreign-born population - Philippines (%)
Place of birth for the foreign-born population - Singapore (%)
Place of birth for the foreign-born population - Thailand (%)
Place of birth for the foreign-born population - Vietnam (%)
Place of birth for the foreign-born population - Other South Eastern Asia (%)
Place of birth for the foreign-born population - Armenia (%)
Place of birth for the foreign-born population - Iraq (%)
Place of birth for the foreign-born population - Israel (%)
Place of birth for the foreign-born population - Jordan (%)
Place of birth for the foreign-born population - Kuwait (%)
Place of birth for the foreign-born population - Lebanon (%)
Place of birth for the foreign-born population - Saudi Arabia (%)
Place of birth for the foreign-born population - Syria (%)
Place of birth for the foreign-born population - Turkey (%)
Place of birth for the foreign-born population - Yemen (%)
Place of birth for the foreign-born population - Other Western Asia (%)
Place of birth for the foreign-born population - Eritrea (%)
Place of birth for the foreign-born population - Ethiopia (%)
Place of birth for the foreign-born population - Kenya (%)
Place of birth for the foreign-born population - Somalia (%)
Place of birth for the foreign-born population - Uganda (%)
Place of birth for the foreign-born population - Zimbabwe (%)
Place of birth for the foreign-born population - Other Eastern Africa (%)
Place of birth for the foreign-born population - Cameroon (%)
Place of birth for the foreign-born population - Congo (%)
Place of birth for the foreign-born population - Democratic Republic of Congo (Zaire) (%)
Place of birth for the foreign-born population - Other Middle Africa (%)
Place of birth for the foreign-born population - Egypt (%)
Place of birth for the foreign-born population - Morocco (%)
Place of birth for the foreign-born population - Sudan (%)
Place of birth for the foreign-born population - Other Northern Africa (%)
Place of birth for the foreign-born population - South Africa (%)
Place of birth for the foreign-born population - Other Southern Africa (%)
Place of birth for the foreign-born population - Cabo Verde (%)
Place of birth for the foreign-born population - Ghana (%)
Place of birth for the foreign-born population - Liberia (%)
Place of birth for the foreign-born population - Nigeria (%)
Place of birth for the foreign-born population - Senegal (%)
Place of birth for the foreign-born population - Sierra Leone (%)
Place of birth for the foreign-born population - Other Western Africa (%)
Place of birth for the foreign-born population - Australia (%)
Place of birth for the foreign-born population - New Zealand (%)
Place of birth for the foreign-born population - Fiji (%)
Place of birth for the foreign-born population - Micronesia (%)
Place of birth for the foreign-born population - Bahamas (%)
Place of birth for the foreign-born population - Barbados (%)
Place of birth for the foreign-born population - Cuba (%)
Place of birth for the foreign-born population - Dominica (%)
Place of birth for the foreign-born population - Dominican Republic (%)
Place of birth for the foreign-born population - Grenada (%)
Place of birth for the foreign-born population - Haiti (%)
Place of birth for the foreign-born population - Jamaica (%)
Place of birth for the foreign-born population - St. Vincent and the Grenadines (%)
Place of birth for the foreign-born population - Trinidad and Tobago (%)
Place of birth for the foreign-born population - West Indies (%)
Place of birth for the foreign-born population - Other Caribbean (%)
Place of birth for the foreign-born population - Belize (%)
Place of birth for the foreign-born population - Costa Rica (%)
Place of birth for the foreign-born population - El Salvador (%)
Place of birth for the foreign-born population - Guatemala (%)
Place of birth for the foreign-born population - Honduras (%)
Place of birth for the foreign-born population - Mexico (%)
Place of birth for the foreign-born population - Nicaragua (%)
Place of birth for the foreign-born population - Panama (%)
Place of birth for the foreign-born population - Other Central America (%)
Place of birth for the foreign-born population - Argentina (%)
Place of birth for the foreign-born population - Bolivia (%)
Place of birth for the foreign-born population - Brazil (%)
Place of birth for the foreign-born population - Chile (%)
Place of birth for the foreign-born population - Colombia (%)
Place of birth for the foreign-born population - Ecuador (%)
Place of birth for the foreign-born population - Guyana (%)
Place of birth for the foreign-born population - Peru (%)
Place of birth for the foreign-born population - Uruguay (%)
Place of birth for the foreign-born population - Venezuela (%)
Place of birth for the foreign-born population - Other South America (%)
Place of birth for the foreign-born population - Canada (%)
Place of birth for the foreign-born population - Other Northern America (%)
Place of birth for the foreign-born population - Other (%)
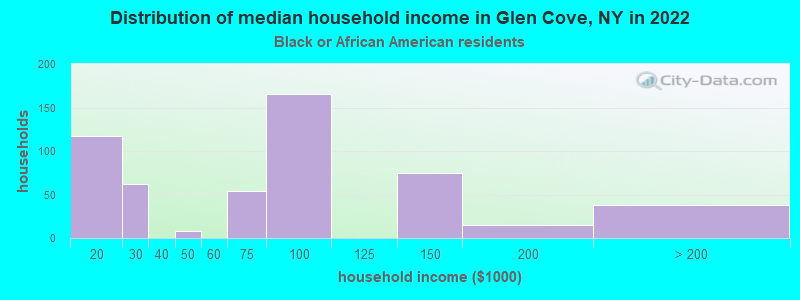
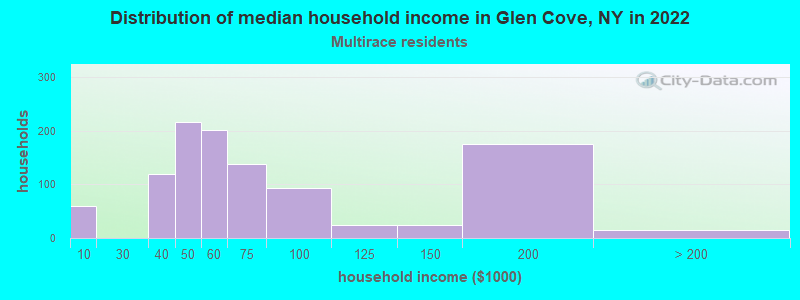
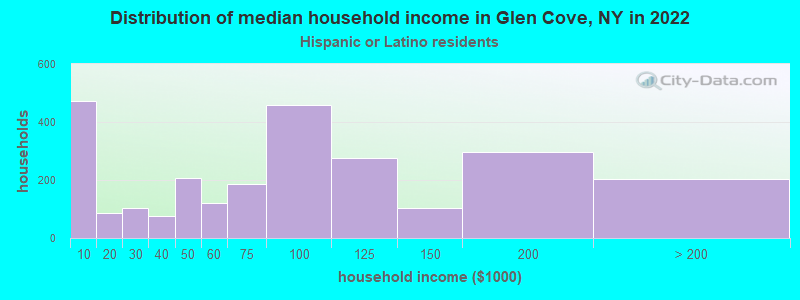
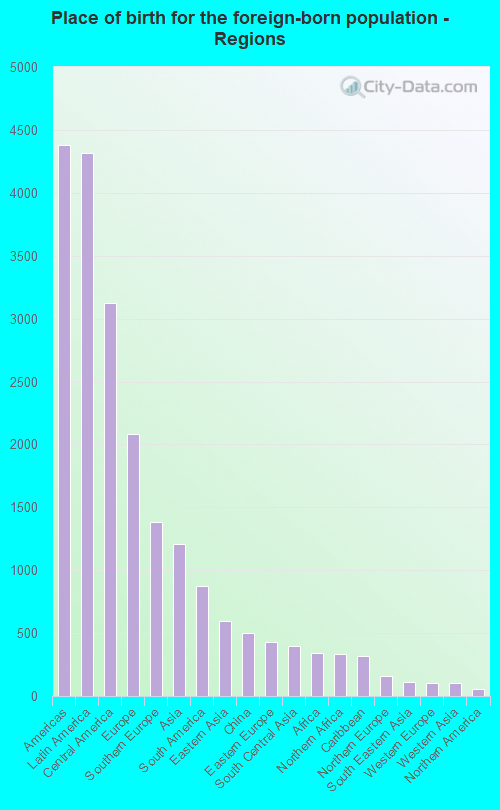
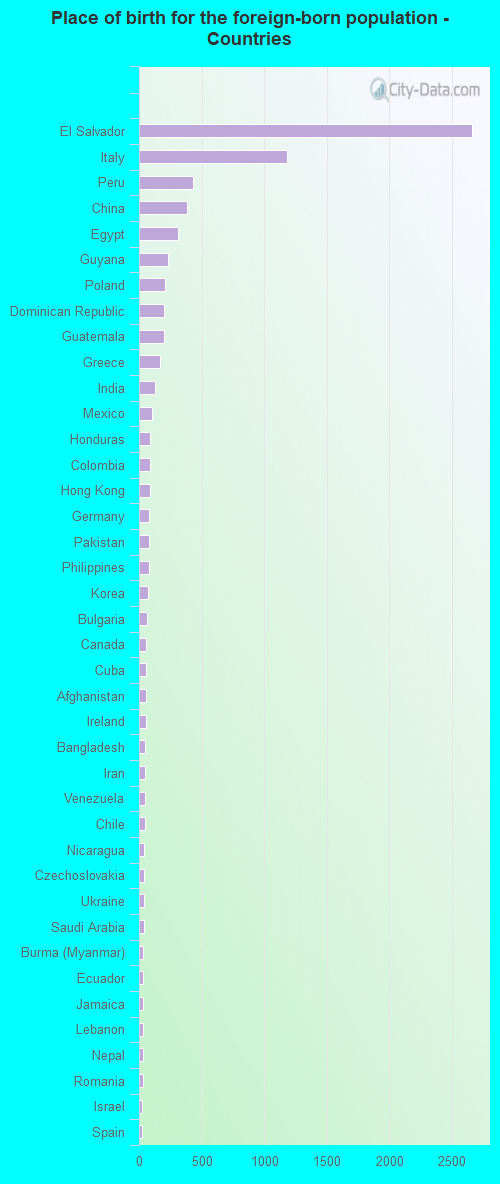
According to 2022 data, the most numerous races in Glen Cove, NY are White alone (15,481 residents), Hispanic (8,305 residents), and Black alone (1,348 residents). 60.0% of Glen Cove residents speak English at home. 28.6% of Glen Cove, NY residents are foreign-born (15.5% born in Latin America, 7.5% born in Europe, 4.3% born in Asia), which is 23.0% greater than the foreign-born rate of 22.0% across the entire state of New York.
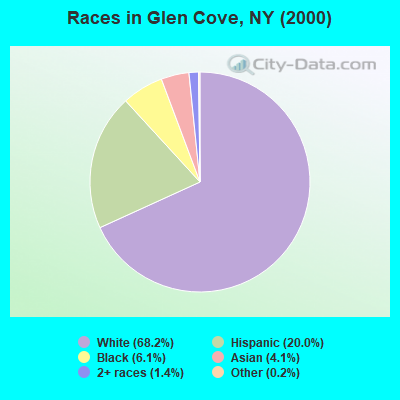
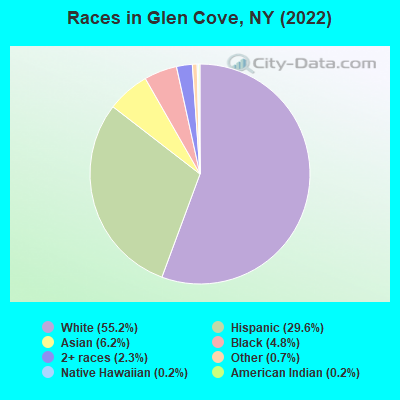
Race distribution in Glen Cove
2000 2022
11,760,981 62.0% White alone 2,867,583 15.1% Hispanic 2,812,623 14.8% Black alone 1,035,926 5.5% Asian alone 366,116 1.9% Two or more races 75,499 0.4% Other race alone 52,499 0.3% American Indian alone 5,230 0.03% Native Hawaiian and Other
10,408,933 52.9% White alone 3,867,299 19.7% Hispanic 2,633,840 13.4% Black alone 1,776,286 9.0% Asian alone 732,670 3.7% Two or more races 216,110 1.1% Other race alone 35,082 0.2% American Indian alone 6,931 0.04% Native Hawaiian and Other
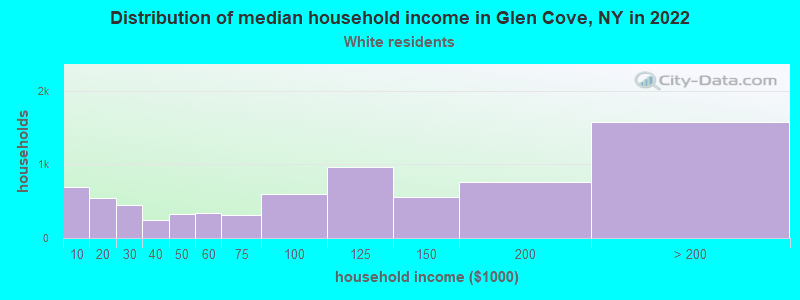
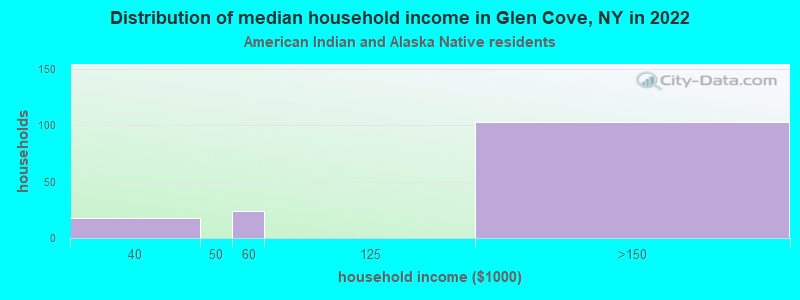
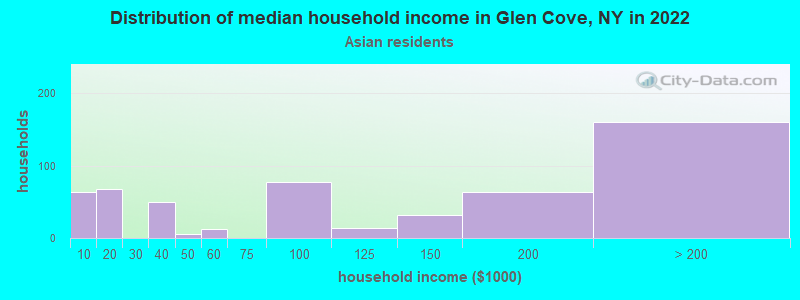
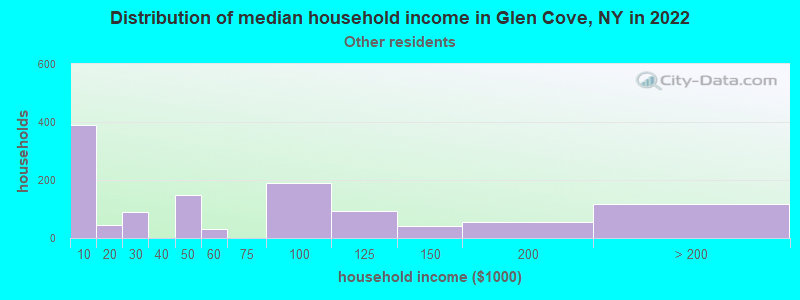
Income and house value in Glen Cove Median household income in 2022 $102,496 White non-Hispanic householders$87,210 Black householders$165,808 American Indian and Alaska Native householders$97,349 Asian householders$43,971 Some other race householders$55,298 Two or more races householders$74,787 Hispanic or Latino race householdersMedian 2022 house value $660,564 White Non-Hispanic householders$521,602 Black or African American householders $658,593 Asian householders$576,792 Some other race householders$576,299 Two or more races householders$580,981 Hispanic or Latino householders
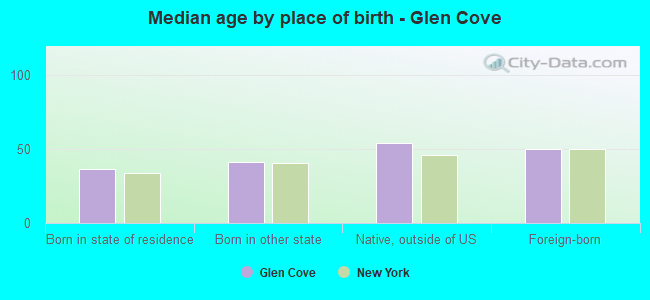
Median age by race in Glen Cove
50.2 Median age for White residents46.4 52.6 35.9 Median age for Black or African American residents35.1 37.4 59.8 Median age for American Indian / Alaska Native residents49.4 58.3 41.5 Median age for Asian residents37.6 42.0 -487,992,314.6 Median age for Native Hawaiian / Pacific Islander residents-477,502,295.2 -497,387,669.3 35.9 Median age for Other race residents22.1 43.3 33.8 Median age for Two or more races residents36.0 33.8 51.9 Median age for White alone residents48.9 54.8 34.9 Median age for Hispanic or Latino residents33.1 35.5
Owner/renter occupied households by race in Glen Cove
House owners and renters - White residents 4,761 64.0% Owner occupied2,682 36.0% Renter occupiedHouse owners and renters - Black or African American residents 62 13.5% Owner occupied399 86.5% Renter occupiedHouse owners and renters - American Indian / Alaska Native residents 14 11.2% Owner occupied112 88.8% Renter occupiedHouse owners and renters - Asian residents 355 67.5% Owner occupied171 32.5% Renter occupiedHouse owners and renters - Other race residents 350 29.7% Owner occupied828 70.3% Renter occupiedHouse owners and renters - Two or more races residents 396 36.4% Owner occupied691 63.6% Renter occupiedHouse owners and renters - White alone residents 4,611 65.8% Owner occupied2,393 34.2% Renter occupiedHouse owners and renters - Hispanic or Latino residents 743 28.4% Owner occupied1,870 71.6% Renter occupied
Language usage in Glen Cove
English speakers - Total 60.0% of residents of Glen Cove speak English at home.
25.1% of residents speak Spanish at home 3,447 51.4% Speak English very well3,265 48.6% Speak English less than very well14.9% of residents speak other language at home 2,641 66.1% Speak English very well1,353 33.9% Speak English less than very well
English speakers - Born in the United States 77.3% of residents of Glen Cove speak English at home.
14.1% of residents speak Spanish at home 69 19.4% Speak English very well286 80.6% Speak English less than very well4.1% of residents speak other language at home 93 90.3% Speak English very well10 9.7% Speak English less than very well
English speakers - Native, born elsewhere 33.8% of residents of Glen Cove speak English at home.
52.9% of residents speak Spanish at home 247 76.2% Speak English very well77 23.8% Speak English less than very well12.9% of residents speak other language at home 15 19.0% Speak English very well64 81.0% Speak English less than very well
English speakers - Foreign-born 15.5% of residents of Glen Cove speak English at home.
46.8% of residents speak Spanish at home 1,203 31.1% Speak English very well2,664 68.9% Speak English less than very well36.1% of residents speak other language at home 1,848 61.9% Speak English very well1,139 38.1% Speak English less than very well
White (Caucasian) - Speak only English Native:
88.7% (11,823)Foreign-born:
26.1% (778)
White (Caucasian) - Speak another language Native:
10.2% (1,358)Foreign-born:
73.1% (2,177)
Black or African American - Speak only English Native:
90.6% (1,240)Foreign-born:
27.3% (57)
Black or African American - Speak another language Native:
9.3% (128)Foreign-born:
73.5% (152)
American Indian / Alaska Native - Speak another language Native:
80.2% (189)Foreign-born:
100.0% (60)
Asian - Speak only English Native:
70.2% (332)Foreign-born:
15.9% (195)
Asian - Speak another language Native:
31.2% (148)Foreign-born:
83.1% (1,018)
Other race - Speak another language Native:
74.7% (1,060)Foreign-born:
100.0% (1,678)
Two or more races - Speak only English Native:
49.1% (889)Foreign-born:
15.7% (278)
Two or more races - Speak another language Native:
54.9% (994)Foreign-born:
84.7% (1,499)
White alone - Speak only English Native:
92.8% (11,500)Foreign-born:
29.7% (787)
White alone - Speak another language Native:
7.0% (873)Foreign-born:
70.4% (1,866)
Hispanic or Latino - Speak only English Native:
27.4% (1,011)Foreign-born:
1.0% (38)
Hispanic or Latino - Speak another language Native:
73.1% (2,698)Foreign-born:
99.0% (3,880)
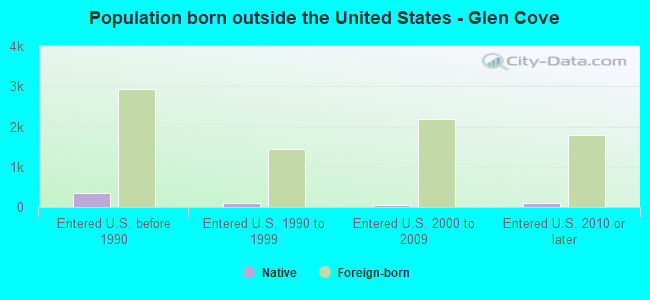
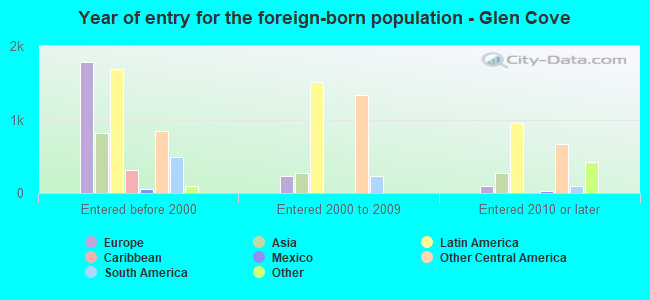
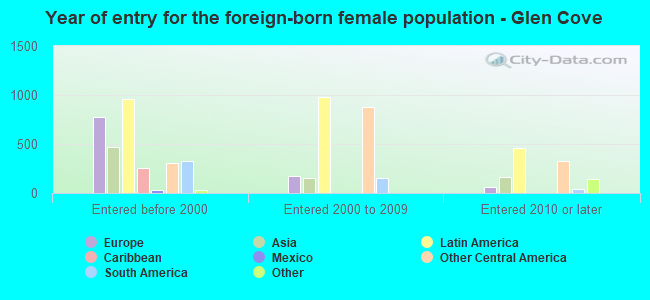
Foreign-born residents in Glen Cove 8,004 residents are foreign born (15.5% Latin America , 7.5% Europe , 4.3% Asia ).
This city:
28.6%New York:
22.6%
Marital status for residents in Glen Cove Marital status - White (Caucasian) population 15 years and over
Males 39.7% Never married50.7% Now married2.0% Separated2.7% Widowed4.9% DivorcedFemales 26.3% Never married45.7% Now married0.6% Separated11.0% Widowed16.4% DivorcedWomen who gave birth in the past 12 months Now married:
100.0% (34)Unmarried:
0.0% (0)
Women who did not give birth in the past 12 months Now married:
36.6% (1,204)Unmarried:
63.4% (2,089)
Marital status - Black or African American population 15 years and over
Males 34.1% Never married53.0% Now married0.0% Separated0.5% Widowed12.4% DivorcedFemales 46.0% Never married40.5% Now married4.5% Separated5.5% Widowed3.5% DivorcedWomen who gave birth in the past 12 months Now married:
100.0% (15)Unmarried:
0.0% (0)
Women who did not give birth in the past 12 months Now married:
43.8% (177)Unmarried:
56.2% (227)
Marital status - American Indian / Alaska Native population 15 years and over
Males 58.1% Never married0.0% Now married10.8% Separated0.0% Widowed31.1% DivorcedFemales 41.3% Never married17.4% Now married0.0% Separated0.0% Widowed41.3% DivorcedWomen who did not give birth in the past 12 months Now married:
20.9% (27)Unmarried:
79.1% (103)
Marital status - Asian population 15 years and over
Males 42.5% Never married55.3% Now married0.0% Separated1.2% Widowed1.0% DivorcedFemales 31.4% Never married55.2% Now married0.0% Separated9.2% Widowed4.2% DivorcedWomen who gave birth in the past 12 months Now married:
100.0% (10)Unmarried:
0.0% (0)
Women who did not give birth in the past 12 months Now married:
41.9% (188)Unmarried:
58.1% (261)
Marital status - Other race population 15 years and over
Males 43.1% Never married52.1% Now married0.0% Separated4.1% Widowed0.6% DivorcedFemales 66.2% Never married21.4% Now married2.3% Separated3.5% Widowed6.5% DivorcedWomen who did not give birth in the past 12 months Now married:
14.5% (175)Unmarried:
85.5% (1,032)
Marital status - Two or more races population 15 years and over
Males 46.3% Never married50.4% Now married0.0% Separated1.9% Widowed1.4% DivorcedFemales 35.4% Never married29.5% Now married3.0% Separated14.1% Widowed18.0% DivorcedWomen who did not give birth in the past 12 months Now married:
30.1% (284)Unmarried:
69.9% (661)
Marital status - White alone, not Hispanic / Latino population 15 years and over
Males 38.3% Never married52.1% Now married2.1% Separated2.7% Widowed4.8% DivorcedFemales 23.7% Never married47.7% Now married0.7% Separated10.9% Widowed17.0% DivorcedWomen who gave birth in the past 12 months Now married:
100.0% (36)Unmarried:
0.0% (0)
Women who did not give birth in the past 12 months Now married:
38.8% (1,096)Unmarried:
61.2% (1,726)
Marital status - Hispanic or Latino population 15 years and over
Males 48.3% Never married45.9% Now married0.7% Separated3.0% Widowed2.1% DivorcedFemales 50.0% Never married27.8% Now married1.9% Separated8.8% Widowed11.5% DivorcedWomen who did not give birth in the past 12 months Now married:
26.2% (665)Unmarried:
73.8% (1,872)
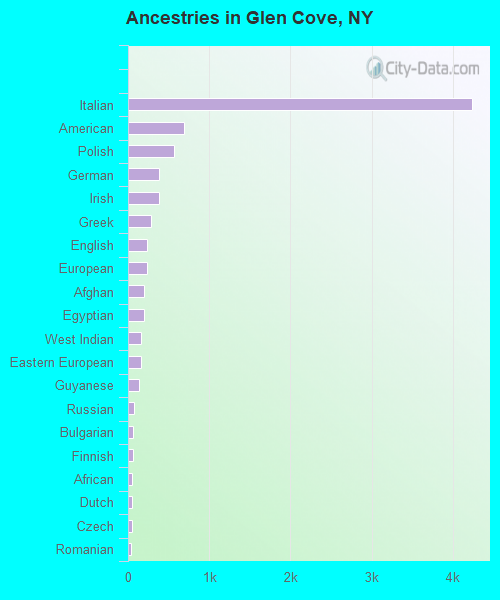
Ancestries in Glen Cove
4,232 25.5% Italian685 4.1% American571 3.4% Polish385 2.3% German381 2.3% Irish289 1.7% Greek235 1.4% English233 1.4% European194 1.2% Afghan192 1.2% Egyptian163 1.0% West Indian156 0.9% Eastern European134 0.8% Guyanese72 0.4% Russian66 0.4% Bulgarian65 0.4% Finnish54 0.3% African50 0.3% Dutch46 0.3% Czech39 0.2% Romanian29 0.2% Hungarian27 0.2% Jamaican25 0.2% Norwegian23 0.1% Austrian20 0.1% Portuguese18 0.1% Iraqi18 0.1% Canadian18 0.1% Trinidadian and Tobagonian17 0.1% Jordanian17 0.1% Ghanaian16 0.10% Lithuanian14 0.08% Syrian14 0.08% Czechoslovakian13 0.08% Iranian13 0.08% Scottish13 0.08% Ukrainian12 0.07% Israeli12 0.07% Northern European9 0.05% French9 0.05% Danish8 0.05% Cypriot8 0.05% Serbian7 0.04% Palestinian7 0.04% Scandinavian6 0.04% Lebanese6 0.04% Slovak6 0.04% Haitian5 0.03% Macedonian
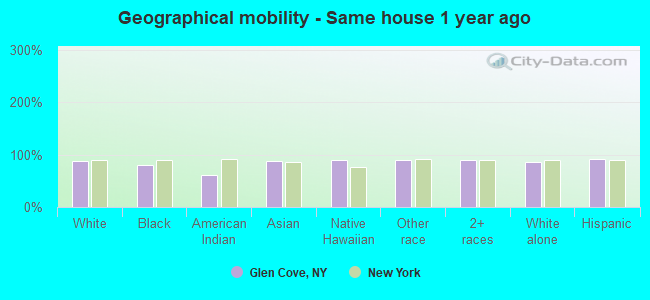
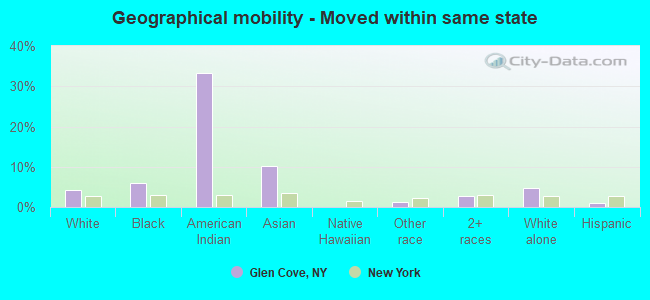
Geographical mobility in Glen Cove Same house 1 year ago 15,044 87.3% White (Caucasian)1,291 80.5% Black or African American205 60.4% American Indian / Alaska Native1,531 87.9% Asian59 89.7% Native Hawaiian / Pacific Islander2,886 89.3% Other race3,541 89.4% Two or more races13,266 85.8% White alone, not Hispanic / Latino7,586 91.9% Hispanic or LatinoMoved within same county 1,217 7.1% White / Caucasian248 15.4% Black or African American14 4.2% American Indian / Alaska Native13 0.8% Asian306 9.5% Other race220 5.5% Two or more races1,242 8.0% White alone, not Hispanic / Latino437 5.3% Hispanic or LatinoMoved within same state 736 4.3% White / Caucasian94 5.9% Black or African American113 33.2% American Indian / Alaska Native177 10.2% Asian43 1.3% Other race103 2.6% Two or more races749 4.8% White alone, not Hispanic / Latino92 1.1% Hispanic or LatinoMoved from different state 211 1.2% White / Caucasian37 2.2% Asian214 1.4% White alone, not Hispanic / LatinoMoved from abroad 180 1.0% White13 0.8% Black or African American24 0.7% Other race144 3.6% Two or more races168 1.1% White alone, not Hispanic / Latino244 3.0% Hispanic or Latino
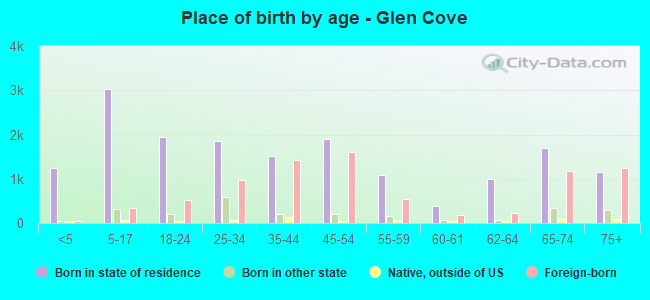
Children Nativity (place of birth) in Glen Cove
Children under 6 years - Living with two parents Both parents native 393 100.0% NativeBoth parents foreign-born 289 100.0% NativeOne native, one foreign-born parent 177 100.0% NativeChildren under 6 years - Living with one parent Native parent 215 100.0% NativeForeign-born parent 272 100.0% NativeChildren 6 to 17 years - Living with two parents Both parents native 746 100.0% NativeBoth parents foreign-born 456 74.7% Native155 25.3% Foreign-bornOne native, one foreign-born parent 341 100.0% NativeChildren 6 to 17 years - Living with one parent Native parent 868 100.0% NativeForeign-born parent 837 54.9% Native688 45.1% Foreign-born
Grandparents responsible for own grandchildren in Glen Cove
Grandparents (30 to 59 years) White / Caucasian 35 72.0% Responsible for grandchildren14 28.0% Not responsible for grandchildrenOther race 9 100.0% Not responsible for grandchildrenTwo or more races 9 100.0% Not responsible for grandchildrenHispanic or Latino 42 58.4% Responsible for grandchildren30 41.6% Not responsible for grandchildrenGrandparents (60 years and over) White / Caucasian 29 27.6% Responsible for grandchildren75 72.4% Not responsible for grandchildrenTwo or more races 37 100.0% Not responsible for grandchildrenHispanic or Latino 41 100.0% Not responsible for grandchildren