Races in Grand Island, New York (NY) Detailed Stats
Ancestries, Foreign-born residents, place of birth
4.2% of Grand Island, NY residents are foreign-born (1.7% born in Europe, 1.3% born in North America, 0.9% born in Asia), which is 423.9% less than the foreign-born rate of 22.0% across the entire state of New York.
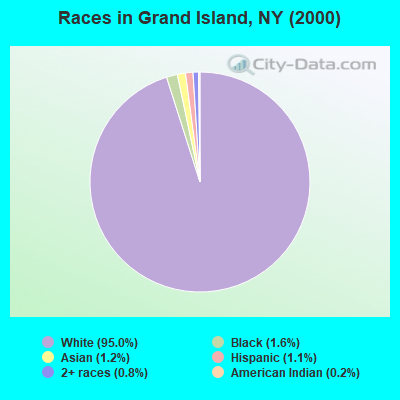
Race distribution in Grand Island

- 17,69395.0%White alone
- 3071.6%Black alone
- 2181.2%Asian alone
- 2031.1%Hispanic
- 1490.8%Two or more races
- 410.2%American Indian alone
- 100.05%Other race alone
2000
2022
-
- 11,760,98162.0%White alone
- 2,867,58315.1%Hispanic
- 2,812,62314.8%Black alone
- 1,035,9265.5%Asian alone
- 366,1161.9%Two or more races
- 75,4990.4%Other race alone
- 52,4990.3%American Indian alone
- 5,2300.03%Native Hawaiian and Other
Pacific Islander alone

-
- 10,408,93352.9%White alone
- 3,867,29919.7%Hispanic
- 2,633,84013.4%Black alone
- 1,776,2869.0%Asian alone
- 732,6703.7%Two or more races
- 216,1101.1%Other race alone
- 35,0820.2%American Indian alone
- 6,9310.04%Native Hawaiian and Other
Pacific Islander alone

Income and house value in Grand Island
- Median household income in 2022
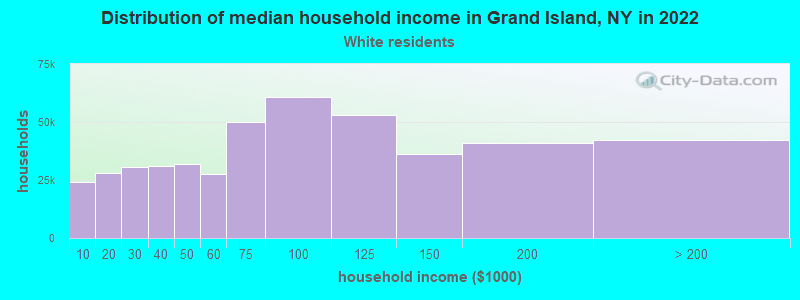
- $108,666White non-Hispanic householders
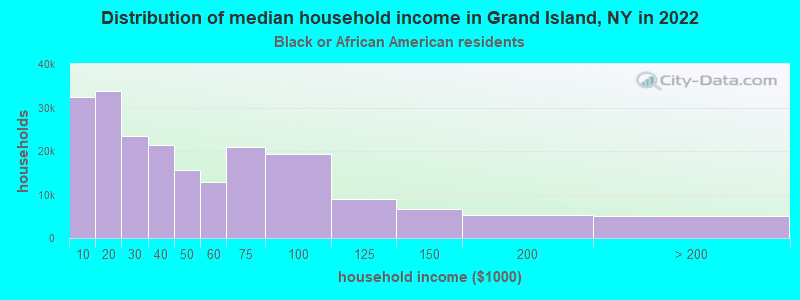
- $147,736Black householders
- $131,329American Indian and Alaska Native householders
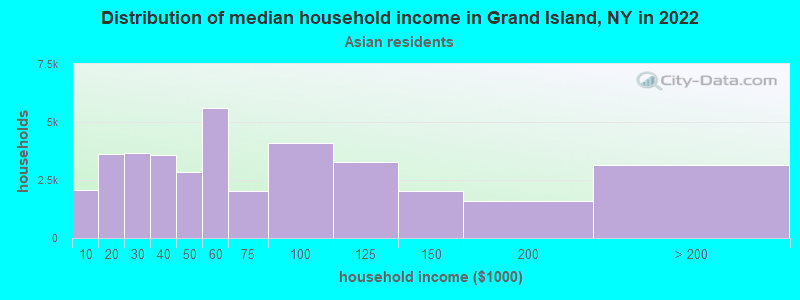
- $160,604Asian householders
- $197,489Two or more races householders
- $135,005Hispanic or Latino race householders
- Median 2022 house value
- $301,311White Non-Hispanic householders
- $451,200Black or African American householders
- $166,258American Indian or Alaska Native householders
- $365,001Asian householders
- $140,680Two or more races householders
- $252,201Hispanic or Latino householders
Household income for White non-Hispanic householders
Household income for Black householders
Household income for American Indian and Alaska Native householders

Household income for Asian householders
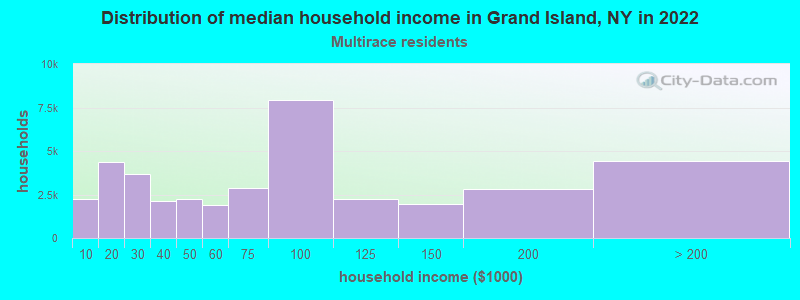
Household income for Two or more races householders
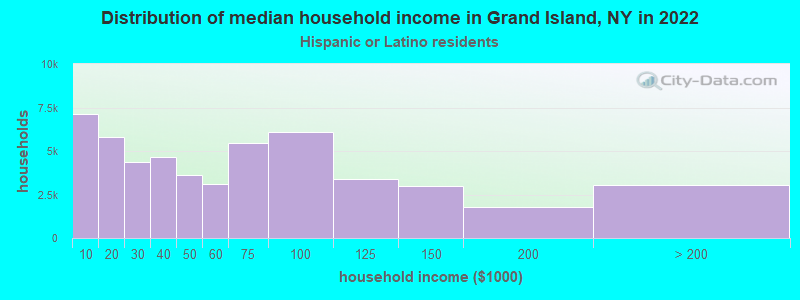
Household income for Hispanic or Latino race householders
Foreign-born residents in Grand Island
782 residents are foreign born (1.7% Europe, 1.3% North America, 0.9% Asia).
| This city: | 4.2% |
| New York: | 20.4% |
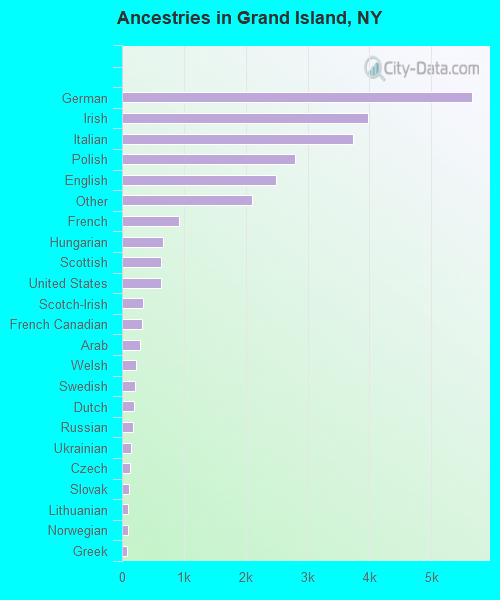
Ancestries in Grand Island

- 5,65021.7%German
- 3,98115.3%Irish
- 3,73414.3%Italian
- 2,80410.8%Polish
- 2,4929.6%English
- 2,0958.0%Other
- 9233.5%French
- 6602.5%Hungarian
- 6372.4%Scottish
- 6302.4%United States
- 3351.3%Scotch-Irish
- 3161.2%French Canadian
- 2851.1%Arab
- 2280.9%Welsh
- 2090.8%Swedish
- 2010.8%Dutch
- 1800.7%Russian
- 1420.5%Ukrainian
- 1250.5%Czech
- 1180.5%Slovak
- 970.4%Lithuanian
- 900.3%Norwegian
- 780.3%Greek
- 320.1%Danish
- 190.07%Subsaharan African
- 130.05%Swiss
Zip codes: 14072.