Races in Hampton Bays, New York (NY) Detailed Stats
Data:
Races - White alone (%)
Races - White alone (% change since 2000)
Races - Black alone (%)
Races - Black alone (% change since 2000)
Races - American Indian alone (%)
Races - American Indian alone (% change since 2000)
Races - Asian alone (%)
Races - Asian alone (% change since 2000)
Races - Hispanic (%)
Races - Hispanic (% change since 2000)
Races - Native Hawaiian and Other Pacific Islander alone (%)
Races - Native Hawaiian and Other Pacific Islander alone (% change since 2000)
Races - Two or more races(%)
Races - Two or more races(% change since 2000)
Races - Other race alone (%)
Races - Other race alone (% change since 2000)
Racial diversity
Place of birth - Born in state of residence (%)
Place of birth - Born in state of residence (%) - White
Place of birth - Born in state of residence (%) - Black or African American
Place of birth - Born in state of residence (%) - Asian
Place of birth - Born in state of residence (%) - Hispanic or Latino
Place of birth - Born in state of residence (%) - American Indian and Alaska Native
Place of birth - Born in state of residence (%) - Multirace
Place of birth - Born in state of residence (%) - Other Race
Place of birth - Born in other state (%)
Place of birth - Born in other state (%) - White
Place of birth - Born in other state (%) - Black or African American
Place of birth - Born in other state (%) - Asian
Place of birth - Born in other state (%) - Hispanic or Latino
Place of birth - Born in other state (%) - American Indian and Alaska Native
Place of birth - Born in other state (%) - Multirace
Place of birth - Born in other state (%) - Other Race
Place of birth - Native, outside of US (%)
Place of birth - Native, outside of US (%) - White
Place of birth - Native, outside of US (%) - Black or African American
Place of birth - Native, outside of US (%) - Asian
Place of birth - Native, outside of US (%) - Hispanic or Latino
Place of birth - Native, outside of US (%) - American Indian and Alaska Native
Place of birth - Native, outside of US (%) - Multirace
Place of birth - Native, outside of US (%) - Other Race
Place of birth - Foreign born (%)
Place of birth - Foreign born (%) - White
Place of birth - Foreign born (%) - Black or African American
Place of birth - Foreign born (%) - Asian
Place of birth - Foreign born (%) - Hispanic or Latino
Place of birth - Foreign born (%) - American Indian and Alaska Native
Place of birth - Foreign born (%) - Multirace
Place of birth - Foreign born (%) - Other Race
Residents speaking English at home (%)
Residents speaking English at home - Born in the United States (%)
Residents speaking English at home - Native, born elsewhere (%)
Residents speaking English at home - Foreign born (%)
Residents speaking Spanish at home (%)
Residents speaking Spanish at home - Born in the United States (%)
Residents speaking Spanish at home - Native, born elsewhere (%)
Residents speaking Spanish at home - Foreign born (%)
Residents speaking other language at home (%)
Residents speaking other language at home - Born in the United States (%)
Residents speaking other language at home - Native, born elsewhere (%)
Residents speaking other language at home - Foreign born (%)
Marital status - Never married (%)
Marital status - Now married (%)
Marital status - Separated (%)
Marital status - Widowed (%)
Marital status - Divorced (%)
Ancestries Reported - Arab (%)
Ancestries Reported - Czech (%)
Ancestries Reported - Danish (%)
Ancestries Reported - Dutch (%)
Ancestries Reported - English (%)
Ancestries Reported - French (%)
Ancestries Reported - French Canadian (%)
Ancestries Reported - German (%)
Ancestries Reported - Greek (%)
Ancestries Reported - Hungarian (%)
Ancestries Reported - Irish (%)
Ancestries Reported - Italian (%)
Ancestries Reported - Lithuanian (%)
Ancestries Reported - Norwegian (%)
Ancestries Reported - Polish (%)
Ancestries Reported - Portuguese (%)
Ancestries Reported - Russian (%)
Ancestries Reported - Scotch-Irish (%)
Ancestries Reported - Scottish (%)
Ancestries Reported - Slovak (%)
Ancestries Reported - Subsaharan African (%)
Ancestries Reported - Swedish (%)
Ancestries Reported - Swiss (%)
Ancestries Reported - Ukrainian (%)
Ancestries Reported - United States (%)
Ancestries Reported - Welsh (%)
Ancestries Reported - West Indian (%)
Ancestries Reported - Other (%)
Geographical mobility - Same house 1 year ago (%)
Geographical mobility - Same house 1 year ago (%) - White
Geographical mobility - Same house 1 year ago (%) - Black or African American
Geographical mobility - Same house 1 year ago (%) - Asian
Geographical mobility - Same house 1 year ago (%) - Hispanic or Latino
Geographical mobility - Same house 1 year ago (%) - American Indian and Alaska Native
Geographical mobility - Same house 1 year ago (%) - Multirace
Geographical mobility - Same house 1 year ago (%) - Other Race
Geographical mobility - Moved within same county (%)
Geographical mobility - Moved within same county (%) - White
Geographical mobility - Moved within same county (%) - Black or African American
Geographical mobility - Moved within same county (%) - Asian
Geographical mobility - Moved within same county (%) - Hispanic or Latino
Geographical mobility - Moved within same county (%) - American Indian and Alaska Native
Geographical mobility - Moved within same county (%) - Multirace
Geographical mobility - Moved within same county (%) - Other Race
Geographical mobility - Moved from different county within same state (%)
Geographical mobility - Moved from different county within same state (%) - White
Geographical mobility - Moved from different county within same state (%) - Black or African American
Geographical mobility - Moved from different county within same state (%) - Asian
Geographical mobility - Moved from different county within same state (%) - Hispanic or Latino
Geographical mobility - Moved from different county within same state (%) - American Indian and Alaska Native
Geographical mobility - Moved from different county within same state (%) - Multirace
Geographical mobility - Moved from different county within same state (%) - Other Race
Geographical mobility - Moved from different state (%)
Geographical mobility - Moved from different state (%) - White
Geographical mobility - Moved from different state (%) - Black or African American
Geographical mobility - Moved from different state (%) - Asian
Geographical mobility - Moved from different state (%) - Hispanic or Latino
Geographical mobility - Moved from different state (%) - American Indian and Alaska Native
Geographical mobility - Moved from different state (%) - Multirace
Geographical mobility - Moved from different state (%) - Other Race
Geographical mobility - Moved from abroad (%)
Geographical mobility - Moved from abroad (%) - White
Geographical mobility - Moved from abroad (%) - Black or African American
Geographical mobility - Moved from abroad (%) - Asian
Geographical mobility - Moved from abroad (%) - Hispanic or Latino
Geographical mobility - Moved from abroad (%) - American Indian and Alaska Native
Geographical mobility - Moved from abroad (%) - Multirace
Geographical mobility - Moved from abroad (%) - Other Race
Place of birth for the foreign-born population - Ireland (%)
Place of birth for the foreign-born population - Denmark (%)
Place of birth for the foreign-born population - Norway (%)
Place of birth for the foreign-born population - Sweden (%)
Place of birth for the foreign-born population - United Kingdom (%)
Place of birth for the foreign-born population - England (%)
Place of birth for the foreign-born population - Scotland (%)
Place of birth for the foreign-born population - Other Northern Europe (%)
Place of birth for the foreign-born population - Austria (%)
Place of birth for the foreign-born population - Belgium (%)
Place of birth for the foreign-born population - France (%)
Place of birth for the foreign-born population - Germany (%)
Place of birth for the foreign-born population - Netherlands (%)
Place of birth for the foreign-born population - Switzerland (%)
Place of birth for the foreign-born population - Other Western Europe (%)
Place of birth for the foreign-born population - Greece (%)
Place of birth for the foreign-born population - Italy (%)
Place of birth for the foreign-born population - Portugal (%)
Place of birth for the foreign-born population - Spain (%)
Place of birth for the foreign-born population - Other Southern Europe (%)
Place of birth for the foreign-born population - Albania (%)
Place of birth for the foreign-born population - Belarus (%)
Place of birth for the foreign-born population - Bosnia and Herzegovina (%)
Place of birth for the foreign-born population - Bulgaria (%)
Place of birth for the foreign-born population - Croatia (%)
Place of birth for the foreign-born population - Czechoslovakia (%)
Place of birth for the foreign-born population - Hungary (%)
Place of birth for the foreign-born population - Latvia (%)
Place of birth for the foreign-born population - Lithuania (%)
Place of birth for the foreign-born population - North Macedonia (Macedonia) (%)
Place of birth for the foreign-born population - Moldova (%)
Place of birth for the foreign-born population - Poland (%)
Place of birth for the foreign-born population - Romania (%)
Place of birth for the foreign-born population - Russia (%)
Place of birth for the foreign-born population - Serbia (%)
Place of birth for the foreign-born population - Ukraine (%)
Place of birth for the foreign-born population - Other Eastern Europe (%)
Place of birth for the foreign-born population - China (%)
Place of birth for the foreign-born population - Hong Kong (%)
Place of birth for the foreign-born population - Taiwan (%)
Place of birth for the foreign-born population - Japan (%)
Place of birth for the foreign-born population - Korea (%)
Place of birth for the foreign-born population - Other Eastern Asia (%)
Place of birth for the foreign-born population - Afghanistan (%)
Place of birth for the foreign-born population - Bangladesh (%)
Place of birth for the foreign-born population - India (%)
Place of birth for the foreign-born population - Iran (%)
Place of birth for the foreign-born population - Kazakhstan (%)
Place of birth for the foreign-born population - Nepal (%)
Place of birth for the foreign-born population - Pakistan (%)
Place of birth for the foreign-born population - Sri Lanka (%)
Place of birth for the foreign-born population - Uzbekistan (%)
Place of birth for the foreign-born population - Other South Central Asia (%)
Place of birth for the foreign-born population - Burma (%)
Place of birth for the foreign-born population - Cambodia (%)
Place of birth for the foreign-born population - Indonesia (%)
Place of birth for the foreign-born population - Laos (%)
Place of birth for the foreign-born population - Malaysia (%)
Place of birth for the foreign-born population - Philippines (%)
Place of birth for the foreign-born population - Singapore (%)
Place of birth for the foreign-born population - Thailand (%)
Place of birth for the foreign-born population - Vietnam (%)
Place of birth for the foreign-born population - Other South Eastern Asia (%)
Place of birth for the foreign-born population - Armenia (%)
Place of birth for the foreign-born population - Iraq (%)
Place of birth for the foreign-born population - Israel (%)
Place of birth for the foreign-born population - Jordan (%)
Place of birth for the foreign-born population - Kuwait (%)
Place of birth for the foreign-born population - Lebanon (%)
Place of birth for the foreign-born population - Saudi Arabia (%)
Place of birth for the foreign-born population - Syria (%)
Place of birth for the foreign-born population - Turkey (%)
Place of birth for the foreign-born population - Yemen (%)
Place of birth for the foreign-born population - Other Western Asia (%)
Place of birth for the foreign-born population - Eritrea (%)
Place of birth for the foreign-born population - Ethiopia (%)
Place of birth for the foreign-born population - Kenya (%)
Place of birth for the foreign-born population - Somalia (%)
Place of birth for the foreign-born population - Uganda (%)
Place of birth for the foreign-born population - Zimbabwe (%)
Place of birth for the foreign-born population - Other Eastern Africa (%)
Place of birth for the foreign-born population - Cameroon (%)
Place of birth for the foreign-born population - Congo (%)
Place of birth for the foreign-born population - Democratic Republic of Congo (Zaire) (%)
Place of birth for the foreign-born population - Other Middle Africa (%)
Place of birth for the foreign-born population - Egypt (%)
Place of birth for the foreign-born population - Morocco (%)
Place of birth for the foreign-born population - Sudan (%)
Place of birth for the foreign-born population - Other Northern Africa (%)
Place of birth for the foreign-born population - South Africa (%)
Place of birth for the foreign-born population - Other Southern Africa (%)
Place of birth for the foreign-born population - Cabo Verde (%)
Place of birth for the foreign-born population - Ghana (%)
Place of birth for the foreign-born population - Liberia (%)
Place of birth for the foreign-born population - Nigeria (%)
Place of birth for the foreign-born population - Senegal (%)
Place of birth for the foreign-born population - Sierra Leone (%)
Place of birth for the foreign-born population - Other Western Africa (%)
Place of birth for the foreign-born population - Australia (%)
Place of birth for the foreign-born population - New Zealand (%)
Place of birth for the foreign-born population - Fiji (%)
Place of birth for the foreign-born population - Micronesia (%)
Place of birth for the foreign-born population - Bahamas (%)
Place of birth for the foreign-born population - Barbados (%)
Place of birth for the foreign-born population - Cuba (%)
Place of birth for the foreign-born population - Dominica (%)
Place of birth for the foreign-born population - Dominican Republic (%)
Place of birth for the foreign-born population - Grenada (%)
Place of birth for the foreign-born population - Haiti (%)
Place of birth for the foreign-born population - Jamaica (%)
Place of birth for the foreign-born population - St. Vincent and the Grenadines (%)
Place of birth for the foreign-born population - Trinidad and Tobago (%)
Place of birth for the foreign-born population - West Indies (%)
Place of birth for the foreign-born population - Other Caribbean (%)
Place of birth for the foreign-born population - Belize (%)
Place of birth for the foreign-born population - Costa Rica (%)
Place of birth for the foreign-born population - El Salvador (%)
Place of birth for the foreign-born population - Guatemala (%)
Place of birth for the foreign-born population - Honduras (%)
Place of birth for the foreign-born population - Mexico (%)
Place of birth for the foreign-born population - Nicaragua (%)
Place of birth for the foreign-born population - Panama (%)
Place of birth for the foreign-born population - Other Central America (%)
Place of birth for the foreign-born population - Argentina (%)
Place of birth for the foreign-born population - Bolivia (%)
Place of birth for the foreign-born population - Brazil (%)
Place of birth for the foreign-born population - Chile (%)
Place of birth for the foreign-born population - Colombia (%)
Place of birth for the foreign-born population - Ecuador (%)
Place of birth for the foreign-born population - Guyana (%)
Place of birth for the foreign-born population - Peru (%)
Place of birth for the foreign-born population - Uruguay (%)
Place of birth for the foreign-born population - Venezuela (%)
Place of birth for the foreign-born population - Other South America (%)
Place of birth for the foreign-born population - Canada (%)
Place of birth for the foreign-born population - Other Northern America (%)
Place of birth for the foreign-born population - Other (%)
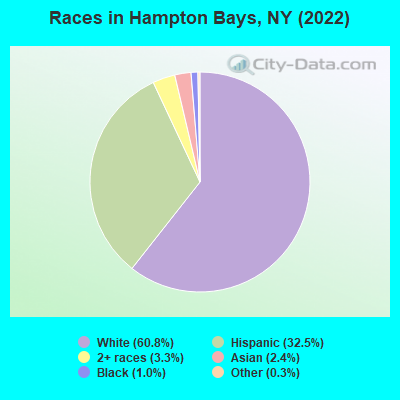
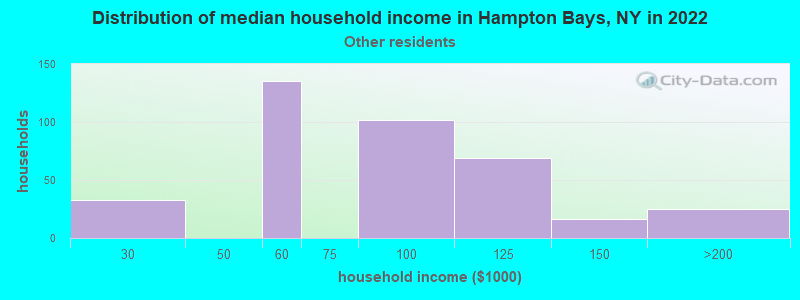
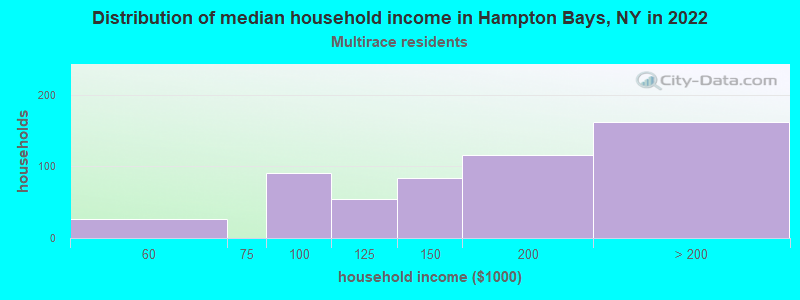
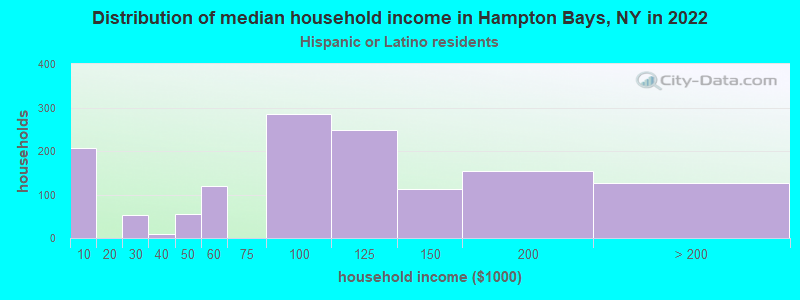
According to 2022 data, the most numerous races in Hampton Bays, NY are White alone (10,299 residents), Hispanic (5,514 residents), and Black alone (165 residents). 63.1% of Hampton Bays residents speak English at home. 27.7% of Hampton Bays, NY residents are foreign-born (24.0% born in Latin America), which is 20.7% greater than the foreign-born rate of 22.0% across the entire state of New York.
Race distribution in Hampton Bays
2000 2022
11,760,981 62.0% White alone 2,867,583 15.1% Hispanic 2,812,623 14.8% Black alone 1,035,926 5.5% Asian alone 366,116 1.9% Two or more races 75,499 0.4% Other race alone 52,499 0.3% American Indian alone 5,230 0.03% Native Hawaiian and Other
10,408,933 52.9% White alone 3,867,299 19.7% Hispanic 2,633,840 13.4% Black alone 1,776,286 9.0% Asian alone 732,670 3.7% Two or more races 216,110 1.1% Other race alone 35,082 0.2% American Indian alone 6,931 0.04% Native Hawaiian and Other
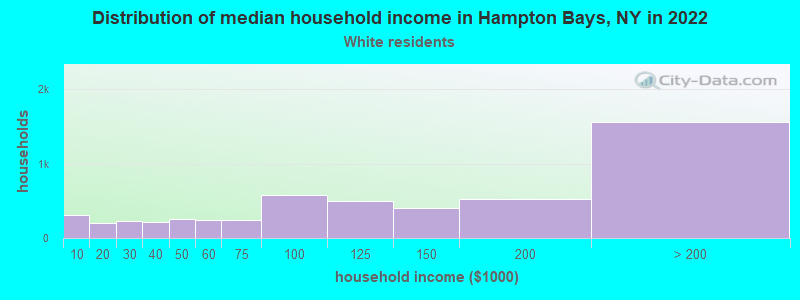
Income and house value in Hampton Bays Median household income in 2022 $127,578 White non-Hispanic householders$112,656 Asian householders$81,462 Some other race householders$150,369 Two or more races householders$88,638 Hispanic or Latino race householdersMedian 2022 house value $721,376 White Non-Hispanic householders$915,451 Black or African American householders over $1,000,000 Asian householders$762,876 Some other race householders$522,417 Two or more races householders$782,813 Hispanic or Latino householders
Median age by race in Hampton Bays
49.7 Median age for White residents45.2 52.7 41.0 Median age for Black or African American residents41.1 28.6 39.2 Median age for American Indian / Alaska Native residents53.0 14.6 24.5 Median age for Asian residents24.2 35.7 -742,816,091.2 Median age for Native Hawaiian / Pacific Islander residents-831,187,409.8 -771,300,447.7 29.8 Median age for Other race residents27.4 36.6 42.0 Median age for Two or more races residents41.1 44.0 50.8 Median age for White alone residents46.8 57.2 39.1 Median age for Hispanic or Latino residents34.6 39.8
Owner/renter occupied households by race in Hampton Bays
House owners and renters - White residents 4,272 81.3% Owner occupied982 18.7% Renter occupiedHouse owners and renters - Black or African American residents 37 100.0% Renter occupiedHouse owners and renters - American Indian / Alaska Native residents 54 100.0% Renter occupiedHouse owners and renters - Asian residents 70 100.0% Owner occupiedHouse owners and renters - Other race residents 166 42.7% Owner occupied223 57.3% Renter occupiedHouse owners and renters - Two or more races residents 389 75.6% Owner occupied125 24.4% Renter occupiedHouse owners and renters - White alone residents 4,006 84.7% Owner occupied724 15.3% Renter occupiedHouse owners and renters - Hispanic or Latino residents 707 53.1% Owner occupied624 46.9% Renter occupied
Language usage in Hampton Bays
English speakers - Total 63.1% of residents of Hampton Bays speak English at home.
31.2% of residents speak Spanish at home 1,768 35.3% Speak English very well3,239 64.7% Speak English less than very well7.5% of residents speak other language at home 876 72.4% Speak English very well334 27.6% Speak English less than very well
English speakers - Born in the United States 95.8% of residents of Hampton Bays speak English at home.
3.1% of residents speak Spanish at home 45 100.0% Speak English very well1.3% of residents speak other language at home 19 100.0% Speak English very well
English speakers - Native, born elsewhere 28.6% of residents of Hampton Bays speak English at home.
54.1% of residents speak Spanish at home 64 88.9% Speak English very well8 11.1% Speak English less than very well19.5% of residents speak other language at home 26 100.0% Speak English very well
English speakers - Foreign-born 5.8% of residents of Hampton Bays speak English at home.
83.1% of residents speak Spanish at home 908 22.0% Speak English very well3,227 78.0% Speak English less than very well15.6% of residents speak other language at home 455 58.7% Speak English very well320 41.3% Speak English less than very well
White (Caucasian) - Speak only English Native:
93.2% (9,012)Foreign-born:
7.6% (114)
White (Caucasian) - Speak another language Native:
6.3% (613)Foreign-born:
85.7% (1,289)
Black or African American - Speak only English Native:
53.3% (37)Foreign-born:
16.2% (17)
Black or African American - Speak another language Native:
58.7% (41)Foreign-born:
76.2% (80)
American Indian / Alaska Native - Speak another language Native:
100.0% (12)Foreign-born:
100.0% (126)
Asian - Speak only English Native:
4.9% (2)Foreign-born:
3.7% (8)
Asian - Speak another language Native:
100.0% (43)Foreign-born:
100.0% (219)
Other race - Speak only English Native:
12.8% (47)Foreign-born:
1.0% (13)
Other race - Speak another language Native:
84.1% (306)Foreign-born:
100.0% (1,348)
Two or more races - Speak only English Native:
74.1% (619)Foreign-born:
9.4% (158)
Two or more races - Speak another language Native:
26.2% (219)Foreign-born:
91.0% (1,541)
White alone - Speak only English Native:
95.1% (9,014)Foreign-born:
25.1% (124)
White alone - Speak another language Native:
5.0% (472)Foreign-born:
74.9% (371)
Hispanic or Latino - Speak only English Native:
30.6% (337)Foreign-born:
3.2% (133)
Hispanic or Latino - Speak another language Native:
68.2% (751)Foreign-born:
97.2% (4,069)
Foreign-born residents in Hampton Bays 4,700 residents are foreign born (24.0% Latin America ).
This city:
27.7%New York:
22.6%
Marital status for residents in Hampton Bays Marital status - White (Caucasian) population 15 years and over
Males 34.5% Never married57.5% Now married0.4% Separated2.0% Widowed5.6% DivorcedFemales 23.3% Never married50.8% Now married2.2% Separated9.1% Widowed14.5% DivorcedWomen who gave birth in the past 12 months Now married:
60.0% (42)Unmarried:
40.0% (28)
Women who did not give birth in the past 12 months Now married:
48.9% (1,038)Unmarried:
51.1% (1,085)
Marital status - Black or African American population 15 years and over
Males 34.8% Never married52.7% Now married0.0% Separated0.0% Widowed12.5% DivorcedFemales 1.8% Never married98.2% Now married0.0% Separated0.0% Widowed0.0% DivorcedWomen who did not give birth in the past 12 months Now married:
100.0% (54)Unmarried:
0.0% (0)
Marital status - American Indian / Alaska Native population 15 years and over
Males 63.4% Never married36.6% Now married0.0% Separated0.0% Widowed0.0% DivorcedFemales 100.0% Never married0.0% Now married0.0% Separated0.0% Widowed0.0% DivorcedWomen who gave birth in the past 12 months Now married:
0.0% (0)Unmarried:
100.0% (17)
Women who did not give birth in the past 12 months Now married:
0.0% (0)Unmarried:
100.0% (11)
Marital status - Asian population 15 years and over
Males 36.5% Never married63.5% Now married0.0% Separated0.0% Widowed0.0% DivorcedFemales 12.8% Never married87.2% Now married0.0% Separated0.0% Widowed0.0% DivorcedWomen who gave birth in the past 12 months Now married:
100.0% (77)Unmarried:
0.0% (0)
Women who did not give birth in the past 12 months Now married:
53.3% (25)Unmarried:
46.7% (22)
Marital status - Other race population 15 years and over
Males 47.6% Never married42.2% Now married0.0% Separated0.0% Widowed10.2% DivorcedFemales 35.9% Never married41.3% Now married6.0% Separated3.1% Widowed13.8% DivorcedWomen who did not give birth in the past 12 months Now married:
33.4% (178)Unmarried:
66.6% (354)
Marital status - Two or more races population 15 years and over
Males 43.0% Never married48.2% Now married2.0% Separated0.0% Widowed6.8% DivorcedFemales 36.0% Never married47.9% Now married4.8% Separated2.0% Widowed9.2% DivorcedWomen who gave birth in the past 12 months Now married:
40.5% (22)Unmarried:
59.5% (32)
Women who did not give birth in the past 12 months Now married:
31.7% (186)Unmarried:
68.3% (401)
Marital status - White alone, not Hispanic / Latino population 15 years and over
Males 32.4% Never married58.7% Now married0.4% Separated2.4% Widowed6.1% DivorcedFemales 18.2% Never married56.2% Now married1.7% Separated11.3% Widowed12.6% DivorcedWomen who gave birth in the past 12 months Now married:
66.7% (45)Unmarried:
33.3% (23)
Women who did not give birth in the past 12 months Now married:
62.8% (977)Unmarried:
37.2% (579)
Marital status - Hispanic or Latino population 15 years and over
Males 44.0% Never married49.5% Now married0.0% Separated0.0% Widowed6.6% DivorcedFemales 39.6% Never married37.9% Now married3.5% Separated0.8% Widowed18.2% DivorcedWomen who gave birth in the past 12 months Now married:
26.3% (15)Unmarried:
73.7% (43)
Women who did not give birth in the past 12 months Now married:
26.8% (397)Unmarried:
73.2% (1,084)
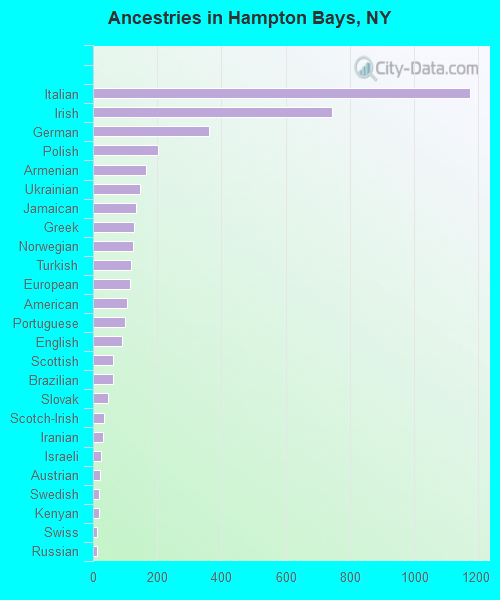
Ancestries in Hampton Bays
1,174 16.1% Italian744 10.2% Irish360 4.9% German203 2.8% Polish164 2.2% Armenian146 2.0% Ukrainian135 1.8% Jamaican128 1.8% Greek123 1.7% Norwegian118 1.6% Turkish115 1.6% European106 1.5% American101 1.4% Portuguese91 1.2% English63 0.9% Scottish61 0.8% Brazilian48 0.7% Slovak34 0.5% Scotch-Irish30 0.4% Iranian24 0.3% Israeli22 0.3% Austrian20 0.3% Swedish18 0.2% Kenyan14 0.2% Swiss13 0.2% Russian12 0.2% Celtic10 0.1% Icelander9 0.1% Eastern European9 0.1% Romanian8 0.1% Croatian7 0.10% Danish1 0.01% Haitian
Geographical mobility in Hampton Bays Same house 1 year ago 10,862 91.6% White (Caucasian)168 99.2% Black or African American111 100.0% American Indian / Alaska Native315 94.2% Asian1,722 88.6% Other race1,802 70.8% Two or more races9,449 91.9% White alone, not Hispanic / Latino4,522 82.9% Hispanic or LatinoMoved within same county 540 4.6% White / Caucasian216 11.1% Other race598 23.5% Two or more races392 3.8% White alone, not Hispanic / Latino841 15.4% Hispanic or LatinoMoved within same state 216 1.8% White / Caucasian14 4.3% Asian226 2.2% White alone, not Hispanic / LatinoMoved from different state 162 1.4% White / Caucasian6 1.9% Asian171 1.7% White alone, not Hispanic / LatinoMoved from abroad 44 0.4% White8 100.0% Native Hawaiian / Pacific Islander58 2.3% Two or more races8 0.1% White alone, not Hispanic / Latino100 1.8% Hispanic or Latino
Children Nativity (place of birth) in Hampton Bays
Children under 6 years - Living with two parents Both parents native 344 88.1% Native47 11.9% Foreign-bornBoth parents foreign-born 109 61.9% Native67 38.1% Foreign-bornOne native, one foreign-born parent 192 100.0% NativeChildren under 6 years - Living with one parent Native parent 85 98.8% Native1 1.2% Foreign-bornForeign-born parent 196 95.5% Native9 4.5% Foreign-bornChildren 6 to 17 years - Living with two parents Both parents native 623 99.9% Native0 0.1% Foreign-bornBoth parents foreign-born 217 60.1% Native144 39.9% Foreign-bornOne native, one foreign-born parent 237 100.0% NativeChildren 6 to 17 years - Living with one parent Foreign-born parent 619 64.0% Native348 36.0% Foreign-born
Grandparents responsible for own grandchildren in Hampton Bays
Grandparents (30 to 59 years) White / Caucasian 87 66.8% Responsible for grandchildren43 33.2% Not responsible for grandchildrenOther race 23 100.0% Not responsible for grandchildrenTwo or more races 174 100.0% Not responsible for grandchildrenWhite alone, not Hispanic / Latino 31 100.0% Responsible for grandchildrenHispanic or Latino 64 28.7% Responsible for grandchildren158 71.3% Not responsible for grandchildren
Grandparents (60 years and over) White / Caucasian 46 100.0% Not responsible for grandchildrenOther race 54 100.0% Not responsible for grandchildrenTwo or more races 390 100.0% Not responsible for grandchildrenWhite alone, not Hispanic / Latino 50 100.0% Not responsible for grandchildrenHispanic or Latino 312 100.0% Not responsible for grandchildren