Races in Hurricane, Utah (UT) Detailed Stats
Data:
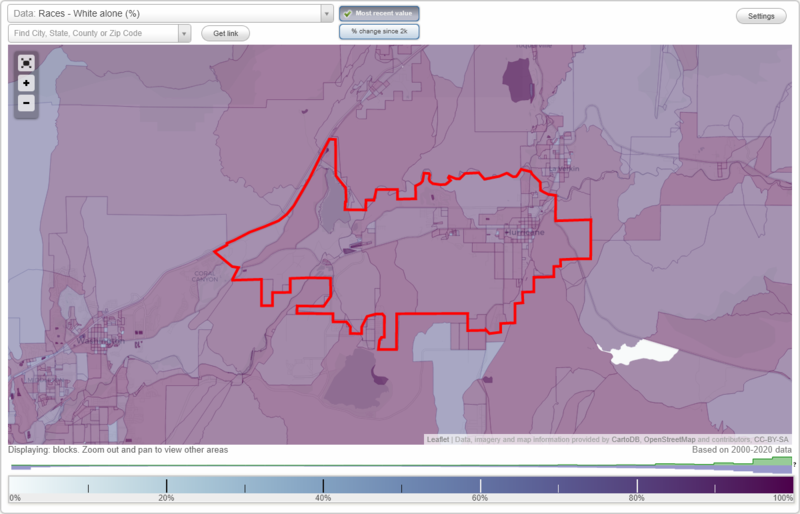
Races - White alone (%)
Races - White alone (% change since 2000)
Races - Black alone (%)
Races - Black alone (% change since 2000)
Races - American Indian alone (%)
Races - American Indian alone (% change since 2000)
Races - Asian alone (%)
Races - Asian alone (% change since 2000)
Races - Hispanic (%)
Races - Hispanic (% change since 2000)
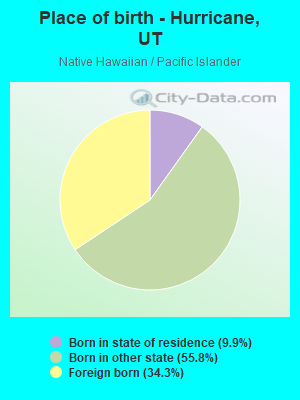
Races - Native Hawaiian and Other Pacific Islander alone (%)
Races - Native Hawaiian and Other Pacific Islander alone (% change since 2000)
Races - Two or more races(%)
Races - Two or more races(% change since 2000)
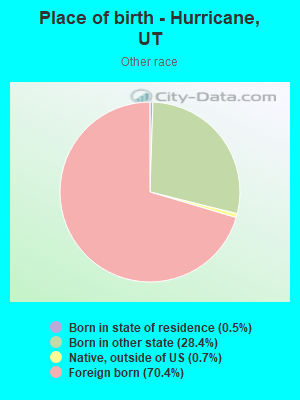
Races - Other race alone (%)
Races - Other race alone (% change since 2000)
Racial diversity
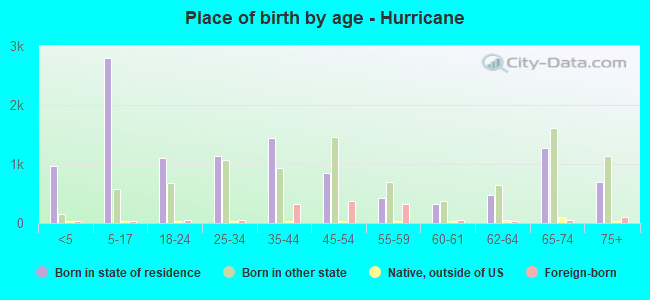
Place of birth - Born in state of residence (%)
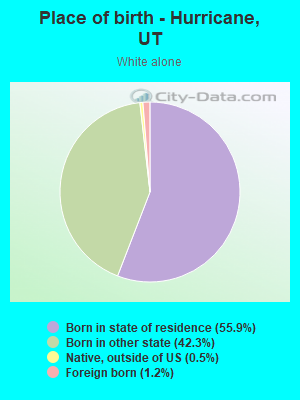
Place of birth - Born in state of residence (%) - White
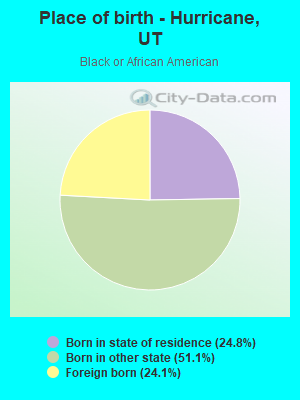
Place of birth - Born in state of residence (%) - Black or African American
Place of birth - Born in state of residence (%) - Asian
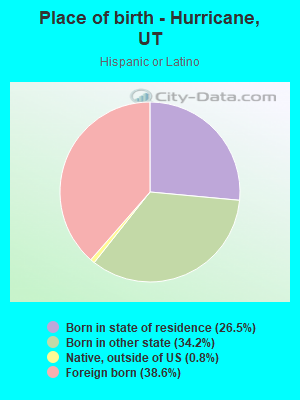
Place of birth - Born in state of residence (%) - Hispanic or Latino
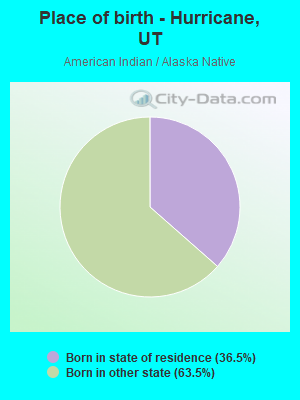
Place of birth - Born in state of residence (%) - American Indian and Alaska Native
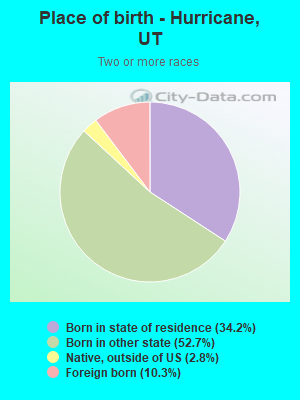
Place of birth - Born in state of residence (%) - Multirace
Place of birth - Born in state of residence (%) - Other Race
Place of birth - Born in other state (%)
Place of birth - Born in other state (%) - White
Place of birth - Born in other state (%) - Black or African American
Place of birth - Born in other state (%) - Asian
Place of birth - Born in other state (%) - Hispanic or Latino
Place of birth - Born in other state (%) - American Indian and Alaska Native
Place of birth - Born in other state (%) - Multirace
Place of birth - Born in other state (%) - Other Race
Place of birth - Native, outside of US (%)
Place of birth - Native, outside of US (%) - White
Place of birth - Native, outside of US (%) - Black or African American
Place of birth - Native, outside of US (%) - Asian
Place of birth - Native, outside of US (%) - Hispanic or Latino
Place of birth - Native, outside of US (%) - American Indian and Alaska Native
Place of birth - Native, outside of US (%) - Multirace
Place of birth - Native, outside of US (%) - Other Race
Place of birth - Foreign born (%)
Place of birth - Foreign born (%) - White
Place of birth - Foreign born (%) - Black or African American
Place of birth - Foreign born (%) - Asian
Place of birth - Foreign born (%) - Hispanic or Latino
Place of birth - Foreign born (%) - American Indian and Alaska Native
Place of birth - Foreign born (%) - Multirace
Place of birth - Foreign born (%) - Other Race
Residents speaking English at home (%)
Residents speaking English at home - Born in the United States (%)
Residents speaking English at home - Native, born elsewhere (%)
Residents speaking English at home - Foreign born (%)
Residents speaking Spanish at home (%)
Residents speaking Spanish at home - Born in the United States (%)
Residents speaking Spanish at home - Native, born elsewhere (%)
Residents speaking Spanish at home - Foreign born (%)
Residents speaking other language at home (%)
Residents speaking other language at home - Born in the United States (%)
Residents speaking other language at home - Native, born elsewhere (%)
Residents speaking other language at home - Foreign born (%)
Marital status - Never married (%)
Marital status - Now married (%)
Marital status - Separated (%)
Marital status - Widowed (%)
Marital status - Divorced (%)
Ancestries Reported - Arab (%)
Ancestries Reported - Czech (%)
Ancestries Reported - Danish (%)
Ancestries Reported - Dutch (%)
Ancestries Reported - English (%)
Ancestries Reported - French (%)
Ancestries Reported - French Canadian (%)
Ancestries Reported - German (%)
Ancestries Reported - Greek (%)
Ancestries Reported - Hungarian (%)
Ancestries Reported - Irish (%)
Ancestries Reported - Italian (%)
Ancestries Reported - Lithuanian (%)
Ancestries Reported - Norwegian (%)
Ancestries Reported - Polish (%)
Ancestries Reported - Portuguese (%)
Ancestries Reported - Russian (%)
Ancestries Reported - Scotch-Irish (%)
Ancestries Reported - Scottish (%)
Ancestries Reported - Slovak (%)
Ancestries Reported - Subsaharan African (%)
Ancestries Reported - Swedish (%)
Ancestries Reported - Swiss (%)
Ancestries Reported - Ukrainian (%)
Ancestries Reported - United States (%)
Ancestries Reported - Welsh (%)
Ancestries Reported - West Indian (%)
Ancestries Reported - Other (%)
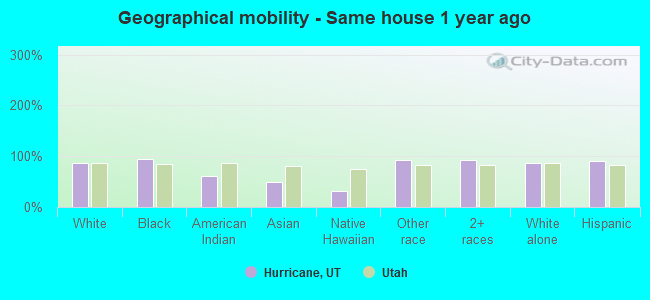
Geographical mobility - Same house 1 year ago (%)
Geographical mobility - Same house 1 year ago (%) - White
Geographical mobility - Same house 1 year ago (%) - Black or African American
Geographical mobility - Same house 1 year ago (%) - Asian
Geographical mobility - Same house 1 year ago (%) - Hispanic or Latino
Geographical mobility - Same house 1 year ago (%) - American Indian and Alaska Native
Geographical mobility - Same house 1 year ago (%) - Multirace
Geographical mobility - Same house 1 year ago (%) - Other Race
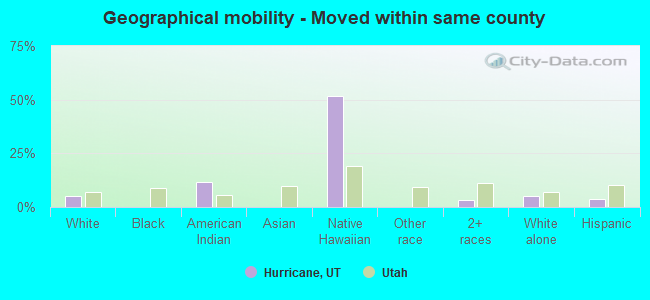
Geographical mobility - Moved within same county (%)
Geographical mobility - Moved within same county (%) - White
Geographical mobility - Moved within same county (%) - Black or African American
Geographical mobility - Moved within same county (%) - Asian
Geographical mobility - Moved within same county (%) - Hispanic or Latino
Geographical mobility - Moved within same county (%) - American Indian and Alaska Native
Geographical mobility - Moved within same county (%) - Multirace
Geographical mobility - Moved within same county (%) - Other Race
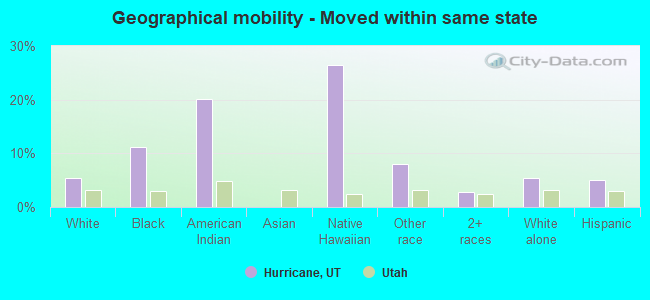
Geographical mobility - Moved from different county within same state (%)
Geographical mobility - Moved from different county within same state (%) - White
Geographical mobility - Moved from different county within same state (%) - Black or African American
Geographical mobility - Moved from different county within same state (%) - Asian
Geographical mobility - Moved from different county within same state (%) - Hispanic or Latino
Geographical mobility - Moved from different county within same state (%) - American Indian and Alaska Native
Geographical mobility - Moved from different county within same state (%) - Multirace
Geographical mobility - Moved from different county within same state (%) - Other Race
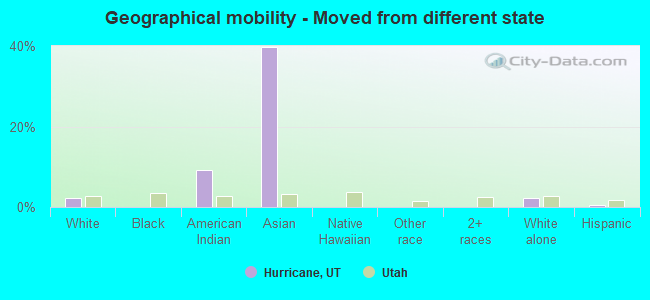
Geographical mobility - Moved from different state (%)
Geographical mobility - Moved from different state (%) - White
Geographical mobility - Moved from different state (%) - Black or African American
Geographical mobility - Moved from different state (%) - Asian
Geographical mobility - Moved from different state (%) - Hispanic or Latino
Geographical mobility - Moved from different state (%) - American Indian and Alaska Native
Geographical mobility - Moved from different state (%) - Multirace
Geographical mobility - Moved from different state (%) - Other Race
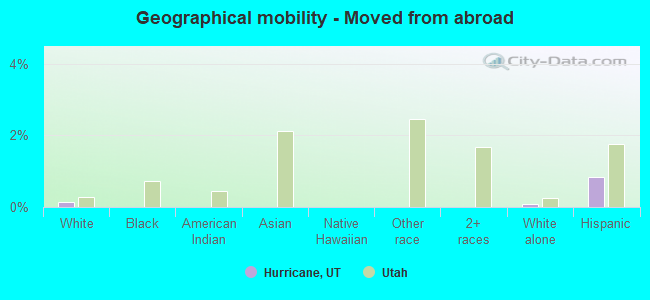
Geographical mobility - Moved from abroad (%)
Geographical mobility - Moved from abroad (%) - White
Geographical mobility - Moved from abroad (%) - Black or African American
Geographical mobility - Moved from abroad (%) - Asian
Geographical mobility - Moved from abroad (%) - Hispanic or Latino
Geographical mobility - Moved from abroad (%) - American Indian and Alaska Native
Geographical mobility - Moved from abroad (%) - Multirace
Geographical mobility - Moved from abroad (%) - Other Race
Place of birth for the foreign-born population - Ireland (%)
Place of birth for the foreign-born population - Denmark (%)
Place of birth for the foreign-born population - Norway (%)
Place of birth for the foreign-born population - Sweden (%)
Place of birth for the foreign-born population - United Kingdom (%)
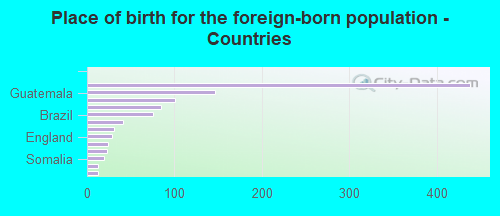
Place of birth for the foreign-born population - England (%)
Place of birth for the foreign-born population - Scotland (%)
Place of birth for the foreign-born population - Other Northern Europe (%)
Place of birth for the foreign-born population - Austria (%)
Place of birth for the foreign-born population - Belgium (%)
Place of birth for the foreign-born population - France (%)
Place of birth for the foreign-born population - Germany (%)
Place of birth for the foreign-born population - Netherlands (%)
Place of birth for the foreign-born population - Switzerland (%)
Place of birth for the foreign-born population - Other Western Europe (%)
Place of birth for the foreign-born population - Greece (%)
Place of birth for the foreign-born population - Italy (%)
Place of birth for the foreign-born population - Portugal (%)
Place of birth for the foreign-born population - Spain (%)
Place of birth for the foreign-born population - Other Southern Europe (%)
Place of birth for the foreign-born population - Albania (%)
Place of birth for the foreign-born population - Belarus (%)
Place of birth for the foreign-born population - Bosnia and Herzegovina (%)
Place of birth for the foreign-born population - Bulgaria (%)
Place of birth for the foreign-born population - Croatia (%)
Place of birth for the foreign-born population - Czechoslovakia (%)
Place of birth for the foreign-born population - Hungary (%)
Place of birth for the foreign-born population - Latvia (%)
Place of birth for the foreign-born population - Lithuania (%)
Place of birth for the foreign-born population - North Macedonia (Macedonia) (%)
Place of birth for the foreign-born population - Moldova (%)
Place of birth for the foreign-born population - Poland (%)
Place of birth for the foreign-born population - Romania (%)
Place of birth for the foreign-born population - Russia (%)
Place of birth for the foreign-born population - Serbia (%)
Place of birth for the foreign-born population - Ukraine (%)
Place of birth for the foreign-born population - Other Eastern Europe (%)
Place of birth for the foreign-born population - China (%)
Place of birth for the foreign-born population - Hong Kong (%)
Place of birth for the foreign-born population - Taiwan (%)
Place of birth for the foreign-born population - Japan (%)
Place of birth for the foreign-born population - Korea (%)
Place of birth for the foreign-born population - Other Eastern Asia (%)
Place of birth for the foreign-born population - Afghanistan (%)
Place of birth for the foreign-born population - Bangladesh (%)
Place of birth for the foreign-born population - India (%)
Place of birth for the foreign-born population - Iran (%)
Place of birth for the foreign-born population - Kazakhstan (%)
Place of birth for the foreign-born population - Nepal (%)
Place of birth for the foreign-born population - Pakistan (%)
Place of birth for the foreign-born population - Sri Lanka (%)
Place of birth for the foreign-born population - Uzbekistan (%)
Place of birth for the foreign-born population - Other South Central Asia (%)
Place of birth for the foreign-born population - Burma (%)
Place of birth for the foreign-born population - Cambodia (%)
Place of birth for the foreign-born population - Indonesia (%)
Place of birth for the foreign-born population - Laos (%)
Place of birth for the foreign-born population - Malaysia (%)
Place of birth for the foreign-born population - Philippines (%)
Place of birth for the foreign-born population - Singapore (%)
Place of birth for the foreign-born population - Thailand (%)
Place of birth for the foreign-born population - Vietnam (%)
Place of birth for the foreign-born population - Other South Eastern Asia (%)
Place of birth for the foreign-born population - Armenia (%)
Place of birth for the foreign-born population - Iraq (%)
Place of birth for the foreign-born population - Israel (%)
Place of birth for the foreign-born population - Jordan (%)
Place of birth for the foreign-born population - Kuwait (%)
Place of birth for the foreign-born population - Lebanon (%)
Place of birth for the foreign-born population - Saudi Arabia (%)
Place of birth for the foreign-born population - Syria (%)
Place of birth for the foreign-born population - Turkey (%)
Place of birth for the foreign-born population - Yemen (%)
Place of birth for the foreign-born population - Other Western Asia (%)
Place of birth for the foreign-born population - Eritrea (%)
Place of birth for the foreign-born population - Ethiopia (%)
Place of birth for the foreign-born population - Kenya (%)
Place of birth for the foreign-born population - Somalia (%)
Place of birth for the foreign-born population - Uganda (%)
Place of birth for the foreign-born population - Zimbabwe (%)
Place of birth for the foreign-born population - Other Eastern Africa (%)
Place of birth for the foreign-born population - Cameroon (%)
Place of birth for the foreign-born population - Congo (%)
Place of birth for the foreign-born population - Democratic Republic of Congo (Zaire) (%)
Place of birth for the foreign-born population - Other Middle Africa (%)
Place of birth for the foreign-born population - Egypt (%)
Place of birth for the foreign-born population - Morocco (%)
Place of birth for the foreign-born population - Sudan (%)
Place of birth for the foreign-born population - Other Northern Africa (%)
Place of birth for the foreign-born population - South Africa (%)
Place of birth for the foreign-born population - Other Southern Africa (%)
Place of birth for the foreign-born population - Cabo Verde (%)
Place of birth for the foreign-born population - Ghana (%)
Place of birth for the foreign-born population - Liberia (%)
Place of birth for the foreign-born population - Nigeria (%)
Place of birth for the foreign-born population - Senegal (%)
Place of birth for the foreign-born population - Sierra Leone (%)
Place of birth for the foreign-born population - Other Western Africa (%)
Place of birth for the foreign-born population - Australia (%)
Place of birth for the foreign-born population - New Zealand (%)
Place of birth for the foreign-born population - Fiji (%)
Place of birth for the foreign-born population - Micronesia (%)
Place of birth for the foreign-born population - Bahamas (%)
Place of birth for the foreign-born population - Barbados (%)
Place of birth for the foreign-born population - Cuba (%)
Place of birth for the foreign-born population - Dominica (%)
Place of birth for the foreign-born population - Dominican Republic (%)
Place of birth for the foreign-born population - Grenada (%)
Place of birth for the foreign-born population - Haiti (%)
Place of birth for the foreign-born population - Jamaica (%)
Place of birth for the foreign-born population - St. Vincent and the Grenadines (%)
Place of birth for the foreign-born population - Trinidad and Tobago (%)
Place of birth for the foreign-born population - West Indies (%)
Place of birth for the foreign-born population - Other Caribbean (%)
Place of birth for the foreign-born population - Belize (%)
Place of birth for the foreign-born population - Costa Rica (%)
Place of birth for the foreign-born population - El Salvador (%)
Place of birth for the foreign-born population - Guatemala (%)
Place of birth for the foreign-born population - Honduras (%)
Place of birth for the foreign-born population - Mexico (%)
Place of birth for the foreign-born population - Nicaragua (%)
Place of birth for the foreign-born population - Panama (%)
Place of birth for the foreign-born population - Other Central America (%)
Place of birth for the foreign-born population - Argentina (%)
Place of birth for the foreign-born population - Bolivia (%)
Place of birth for the foreign-born population - Brazil (%)
Place of birth for the foreign-born population - Chile (%)
Place of birth for the foreign-born population - Colombia (%)
Place of birth for the foreign-born population - Ecuador (%)
Place of birth for the foreign-born population - Guyana (%)
Place of birth for the foreign-born population - Peru (%)
Place of birth for the foreign-born population - Uruguay (%)
Place of birth for the foreign-born population - Venezuela (%)
Place of birth for the foreign-born population - Other South America (%)
Place of birth for the foreign-born population - Canada (%)
Place of birth for the foreign-born population - Other Northern America (%)
Place of birth for the foreign-born population - Other (%)
Latest news about races in Hurricane, UT collected exclusively by city-data.com from local newspapers, TV, and radio stations
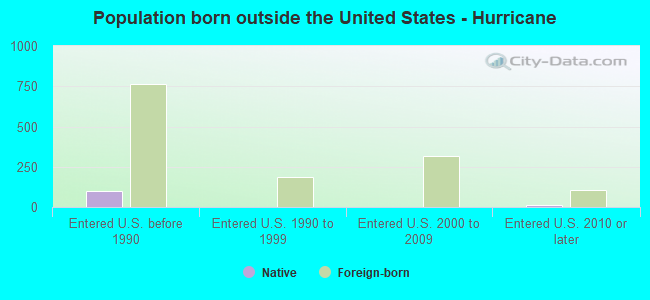
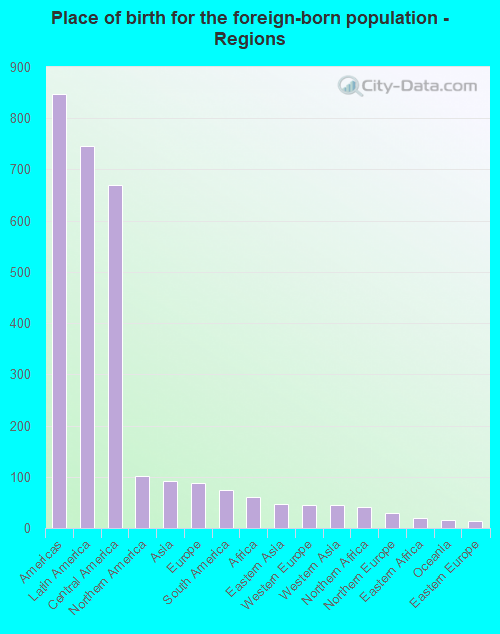
According to 2022 data, the most numerous races in Hurricane, UT are White alone (19,350 residents), Hispanic (1,973 residents), and Two or more races (387 residents). 90.0% of Hurricane residents speak English at home. 5.0% of Hurricane, UT residents are foreign-born (3.4% born in Latin America), which is 61.1% less than the foreign-born rate of 8.0% across the entire state of Utah.
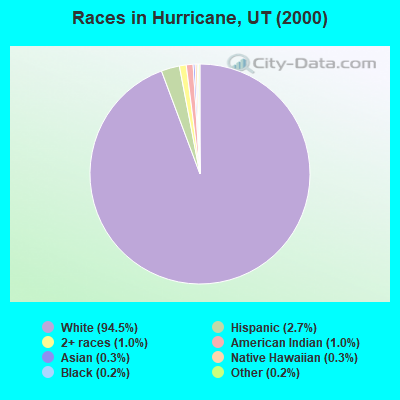
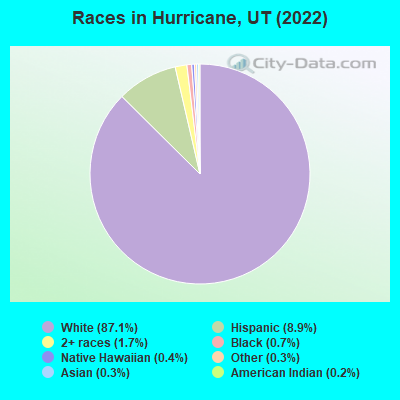
Race distribution in Hurricane
2000 2022
1,904,265 85.3% White alone 201,559 9.0% Hispanic 36,483 1.6% Asian alone 31,308 1.4% Two or more races 26,663 1.2% American Indian alone 14,806 0.7% Native Hawaiian and Other 16,137 0.7% Black alone 1,948 0.09% Other race alone
2,557,466 75.6% White alone 512,086 15.1% Hispanic 119,308 3.5% Two or more races 82,388 2.4% Asian alone 36,978 1.1% Native Hawaiian and Other 34,873 1.0% Black alone 22,803 0.7% American Indian alone 14,898 0.4% Other race alone
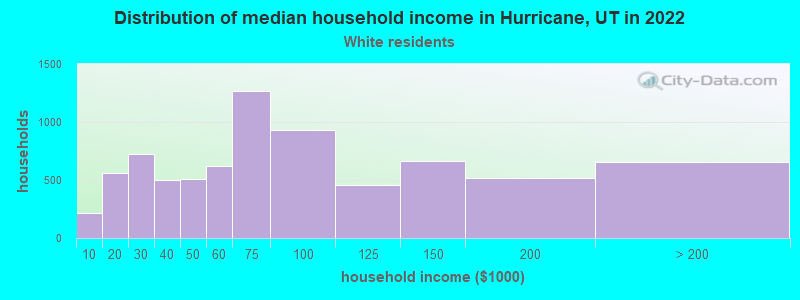
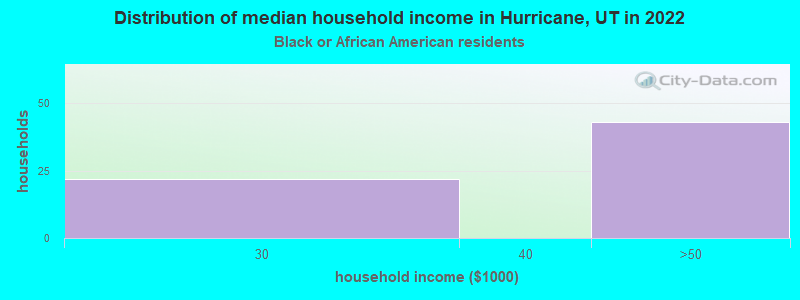
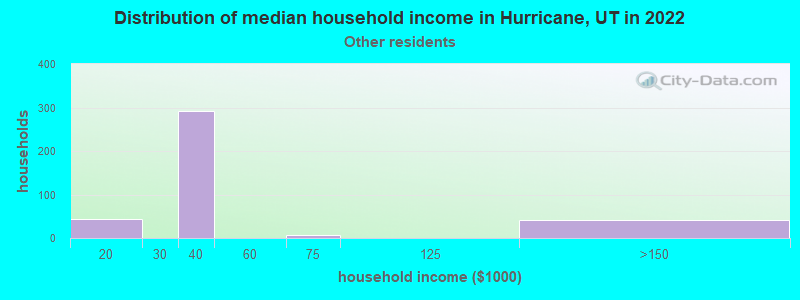
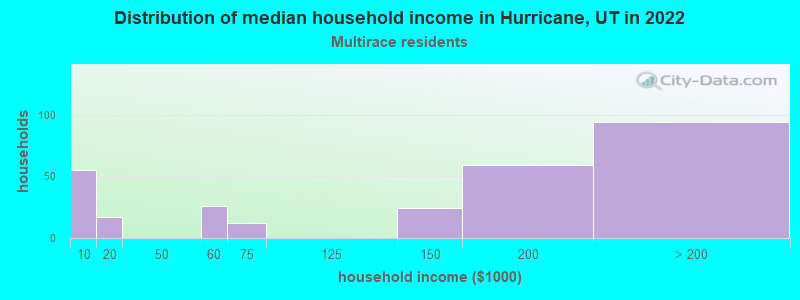
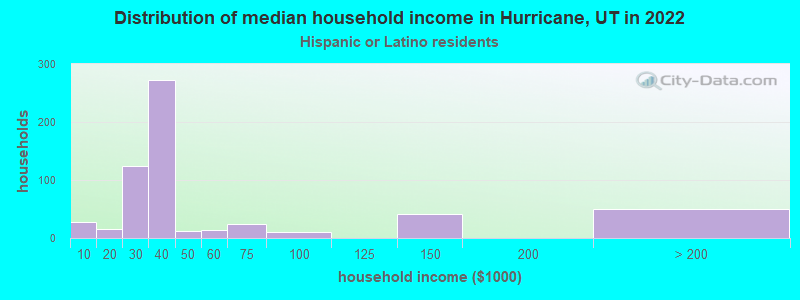
Income and house value in Hurricane Median household income in 2022 $67,091 White non-Hispanic householders$37,395 Some other race householders$32,698 Hispanic or Latino race householdersMedian 2022 house value $544,419 White Non-Hispanic householders$604,666 Some other race householders$674,147 Two or more races householders$406,775 Hispanic or Latino householders
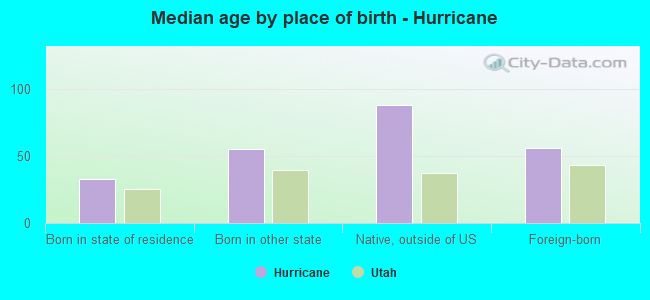
Median age by race in Hurricane
43.5 Median age for White residents43.7 43.5 23.9 Median age for Black or African American residents23.1 -686,357,242.6 43.1 Median age for American Indian / Alaska Native residents42.4 -1,193,333,332.1 -559,633,027.0 Median age for Asian residents-456,303,170.5 -551,051,050.5 101.1 Median age for Native Hawaiian / Pacific Islander residents94.2 -668,354,429.7 63.2 Median age for Other race residents58.9 72.9 40.8 Median age for Two or more races residents40.8 43.7 45.0 Median age for White alone residents44.9 44.7 29.8 Median age for Hispanic or Latino residents29.6 32.1
Owner/renter occupied households by race in Hurricane
House owners and renters - White residents 5,860 76.4% Owner occupied1,814 23.6% Renter occupiedHouse owners and renters - Black or African American residents 23 37.3% Owner occupied39 62.7% Renter occupiedHouse owners and renters - Native Hawaiian / Pacific Islander residents 28 100.0% Owner occupiedHouse owners and renters - Other race residents 572 94.0% Owner occupied37 6.0% Renter occupiedHouse owners and renters - Two or more races residents 318 82.3% Owner occupied68 17.7% Renter occupiedHouse owners and renters - White alone residents 5,870 77.3% Owner occupied1,726 22.7% Renter occupiedHouse owners and renters - Hispanic or Latino residents 533 77.0% Owner occupied159 23.0% Renter occupied
Language usage in Hurricane
English speakers - Total 90.0% of residents of Hurricane speak English at home.
7.5% of residents speak Spanish at home 1,177 74.4% Speak English very well405 25.6% Speak English less than very well2.3% of residents speak other language at home 379 79.1% Speak English very well100 20.9% Speak English less than very well
English speakers - Born in the United States 95.9% of residents of Hurricane speak English at home.
4.4% of residents speak Spanish at home 336 84.0% Speak English very well64 16.0% Speak English less than very well0.3% of residents speak other language at home 11 35.5% Speak English very well20 64.5% Speak English less than very well
English speakers - Native, born elsewhere 40.4% of residents of Hurricane speak English at home.
87.2% of residents speak other language at home 95 100.0% Speak English very well
English speakers - Foreign-born 21.5% of residents of Hurricane speak English at home.
55.2% of residents speak Spanish at home 333 47.2% Speak English very well373 52.8% Speak English less than very well17.1% of residents speak other language at home 172 78.5% Speak English very well47 21.5% Speak English less than very well
White (Caucasian) - Speak only English Native:
97.5% (17,947)Foreign-born:
78.5% (253)
White (Caucasian) - Speak another language Native:
2.7% (501)Foreign-born:
35.4% (114)
Native Hawaiian / Pacific Islander - Speak only English Native:
54.1% (30)Foreign-born:
74.0% (13)
Other race - Speak another language Native:
90.4% (232)Foreign-born:
92.6% (751)
Two or more races - Speak another language Native:
23.9% (163)Foreign-born:
100.0% (77)
White alone - Speak only English Native:
97.6% (17,689)Foreign-born:
100.0% (240)
White alone - Speak another language Native:
2.4% (433)Foreign-born:
7.9% (19)
Hispanic or Latino - Speak only English Native:
51.9% (536)Foreign-born:
0.4% (3)
Hispanic or Latino - Speak another language Native:
47.8% (494)Foreign-born:
91.3% (700)
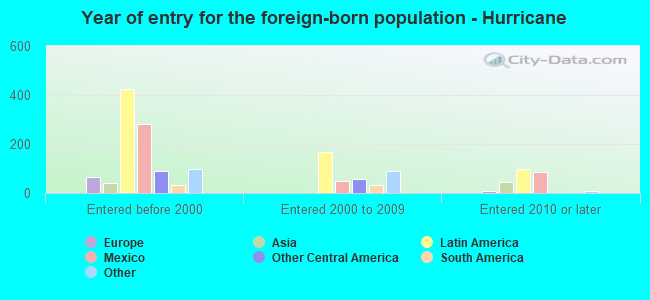
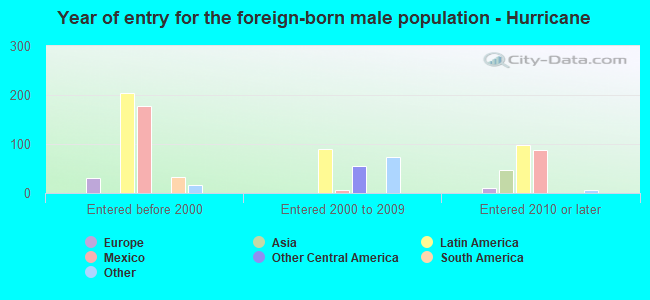
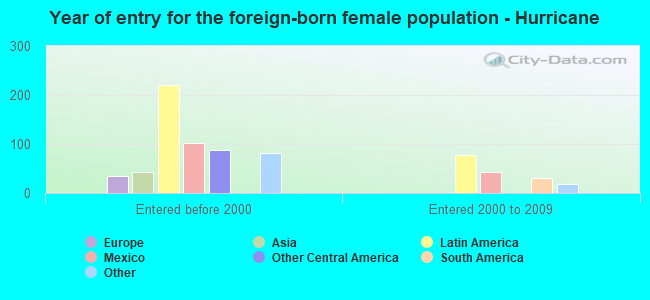
Foreign-born residents in Hurricane 1,104 residents are foreign born (3.4% Latin America ).
Marital status for residents in Hurricane Marital status - White (Caucasian) population 15 years and over
Males 24.1% Never married59.6% Now married1.1% Separated1.9% Widowed13.3% DivorcedFemales 14.2% Never married66.4% Now married0.5% Separated6.1% Widowed12.8% DivorcedWomen who gave birth in the past 12 months Now married:
100.0% (135)Unmarried:
0.0% (0)
Women who did not give birth in the past 12 months Now married:
59.7% (2,150)Unmarried:
40.3% (1,451)
Marital status - Black or African American population 15 years and over
Males 31.0% Never married43.9% Now married25.2% Separated0.0% Widowed0.0% DivorcedFemales 0.0% Never married0.0% Now married0.0% Separated0.0% Widowed100.0% DivorcedMarital status - American Indian / Alaska Native population 15 years and over
Males 67.9% Never married32.1% Now married0.0% Separated0.0% Widowed0.0% DivorcedFemales 0.0% Never married0.0% Now married0.0% Separated100.0% Widowed0.0% DivorcedMarital status - Native Hawaiian / Pacific Islander population 15 years and over
Males 15.6% Never married26.7% Now married0.0% Separated0.0% Widowed57.8% DivorcedFemales 0.0% Never married100.0% Now married0.0% Separated0.0% Widowed0.0% DivorcedMarital status - Other race population 15 years and over
Males 30.3% Never married64.6% Now married5.1% Separated0.0% Widowed0.0% DivorcedFemales 37.3% Never married41.6% Now married21.1% Separated0.0% Widowed0.0% DivorcedWomen who did not give birth in the past 12 months Now married:
11.0% (21)Unmarried:
89.0% (166)
Marital status - Two or more races population 15 years and over
Males 36.7% Never married49.2% Now married0.0% Separated0.0% Widowed14.1% DivorcedFemales 40.4% Never married38.5% Now married21.1% Separated0.0% Widowed0.0% DivorcedWomen who gave birth in the past 12 months Now married:
100.0% (7)Unmarried:
0.0% (0)
Women who did not give birth in the past 12 months Now married:
26.7% (21)Unmarried:
73.3% (58)
Marital status - White alone, not Hispanic / Latino population 15 years and over
Males 24.4% Never married58.5% Now married1.1% Separated2.0% Widowed13.9% DivorcedFemales 14.1% Never married66.3% Now married0.5% Separated6.3% Widowed12.8% DivorcedWomen who gave birth in the past 12 months Now married:
100.0% (125)Unmarried:
0.0% (0)
Women who did not give birth in the past 12 months Now married:
59.5% (2,158)Unmarried:
40.5% (1,471)
Marital status - Hispanic or Latino population 15 years and over
Males 21.8% Never married75.3% Now married2.0% Separated0.0% Widowed0.8% DivorcedFemales 31.1% Never married50.2% Now married13.0% Separated0.0% Widowed5.7% DivorcedWomen who gave birth in the past 12 months Now married:
100.0% (14)Unmarried:
0.0% (0)
Women who did not give birth in the past 12 months Now married:
31.9% (89)Unmarried:
68.1% (191)
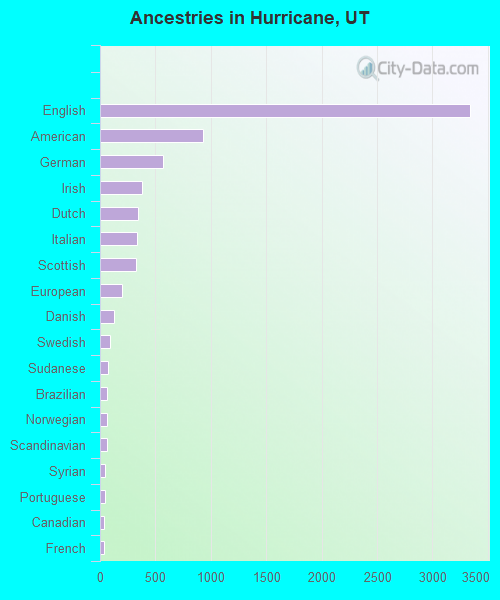
Ancestries in Hurricane
3,343 35.7% English929 9.9% American565 6.0% German381 4.1% Irish343 3.7% Dutch331 3.5% Italian326 3.5% Scottish203 2.2% European124 1.3% Danish89 0.9% Swedish74 0.8% Sudanese66 0.7% Brazilian65 0.7% Norwegian61 0.7% Scandinavian49 0.5% Syrian45 0.5% Portuguese40 0.4% Canadian33 0.4% French28 0.3% Swiss24 0.3% Turkish22 0.2% British22 0.2% Scotch-Irish17 0.2% Somali15 0.2% Slovene9 0.10% Czech8 0.09% Armenian5 0.05% Cajun
Geographical mobility in Hurricane Same house 1 year ago 16,894 86.9% White (Caucasian)206 94.8% Black or African American37 61.6% American Indian / Alaska Native25 50.2% Asian23 32.4% Native Hawaiian / Pacific Islander772 93.5% Other race686 93.3% Two or more races16,573 86.5% White alone, not Hispanic / Latino1,526 90.5% Hispanic or LatinoMoved within same county 968 5.0% White / Caucasian7 11.8% American Indian / Alaska Native37 51.9% Native Hawaiian / Pacific Islander26 3.5% Two or more races976 5.1% White alone, not Hispanic / Latino61 3.6% Hispanic or LatinoMoved within same state 1,035 5.3% White / Caucasian24 11.1% Black or African American12 20.2% American Indian / Alaska Native19 26.4% Native Hawaiian / Pacific Islander66 8.0% Other race20 2.7% Two or more races1,037 5.4% White alone, not Hispanic / Latino86 5.1% Hispanic or LatinoMoved from different state 430 2.2% White / Caucasian5 9.2% American Indian / Alaska Native19 39.8% Asian437 2.3% White alone, not Hispanic / Latino9 0.5% Hispanic or LatinoMoved from abroad 25 0.1% White16 0.1% White alone, not Hispanic / Latino14 0.8% Hispanic or Latino
Children Nativity (place of birth) in Hurricane
Children under 6 years - Living with two parents Both parents native 1,008 100.0% NativeBoth parents foreign-born 13 100.0% NativeOne native, one foreign-born parent 54 100.0% NativeChildren under 6 years - Living with one parent Native parent 363 100.0% NativeChildren 6 to 17 years - Living with two parents Both parents native 1,961 100.0% NativeBoth parents foreign-born 207 92.7% Native16 7.3% Foreign-bornOne native, one foreign-born parent 35 63.3% Native20 36.7% Foreign-bornChildren 6 to 17 years - Living with one parent Native parent 624 100.0% NativeForeign-born parent 122 54.0% Native104 46.0% Foreign-born
Grandparents responsible for own grandchildren in Hurricane
Grandparents (30 to 59 years) White / Caucasian 214 100.0% Not responsible for grandchildrenTwo or more races 7 100.0% Not responsible for grandchildrenWhite alone, not Hispanic / Latino 218 100.0% Not responsible for grandchildren
Grandparents (60 years and over) White / Caucasian 238 100.0% Not responsible for grandchildrenWhite alone, not Hispanic / Latino 238 100.0% Not responsible for grandchildren