Races in Spring Valley, New York (NY) Detailed Stats
Data:
Races - White alone (%)
Races - White alone (% change since 2000)
Races - Black alone (%)
Races - Black alone (% change since 2000)
Races - American Indian alone (%)
Races - American Indian alone (% change since 2000)
Races - Asian alone (%)
Races - Asian alone (% change since 2000)
Races - Hispanic (%)
Races - Hispanic (% change since 2000)
Races - Native Hawaiian and Other Pacific Islander alone (%)
Races - Native Hawaiian and Other Pacific Islander alone (% change since 2000)
Races - Two or more races(%)
Races - Two or more races(% change since 2000)
Races - Other race alone (%)
Races - Other race alone (% change since 2000)
Racial diversity
Place of birth - Born in state of residence (%)
Place of birth - Born in state of residence (%) - White
Place of birth - Born in state of residence (%) - Black or African American
Place of birth - Born in state of residence (%) - Asian
Place of birth - Born in state of residence (%) - Hispanic or Latino
Place of birth - Born in state of residence (%) - American Indian and Alaska Native
Place of birth - Born in state of residence (%) - Multirace
Place of birth - Born in state of residence (%) - Other Race
Place of birth - Born in other state (%)
Place of birth - Born in other state (%) - White
Place of birth - Born in other state (%) - Black or African American
Place of birth - Born in other state (%) - Asian
Place of birth - Born in other state (%) - Hispanic or Latino
Place of birth - Born in other state (%) - American Indian and Alaska Native
Place of birth - Born in other state (%) - Multirace
Place of birth - Born in other state (%) - Other Race
Place of birth - Native, outside of US (%)
Place of birth - Native, outside of US (%) - White
Place of birth - Native, outside of US (%) - Black or African American
Place of birth - Native, outside of US (%) - Asian
Place of birth - Native, outside of US (%) - Hispanic or Latino
Place of birth - Native, outside of US (%) - American Indian and Alaska Native
Place of birth - Native, outside of US (%) - Multirace
Place of birth - Native, outside of US (%) - Other Race
Place of birth - Foreign born (%)
Place of birth - Foreign born (%) - White
Place of birth - Foreign born (%) - Black or African American
Place of birth - Foreign born (%) - Asian
Place of birth - Foreign born (%) - Hispanic or Latino
Place of birth - Foreign born (%) - American Indian and Alaska Native
Place of birth - Foreign born (%) - Multirace
Place of birth - Foreign born (%) - Other Race
Residents speaking English at home (%)
Residents speaking English at home - Born in the United States (%)
Residents speaking English at home - Native, born elsewhere (%)
Residents speaking English at home - Foreign born (%)
Residents speaking Spanish at home (%)
Residents speaking Spanish at home - Born in the United States (%)
Residents speaking Spanish at home - Native, born elsewhere (%)
Residents speaking Spanish at home - Foreign born (%)
Residents speaking other language at home (%)
Residents speaking other language at home - Born in the United States (%)
Residents speaking other language at home - Native, born elsewhere (%)
Residents speaking other language at home - Foreign born (%)
Marital status - Never married (%)
Marital status - Now married (%)
Marital status - Separated (%)
Marital status - Widowed (%)
Marital status - Divorced (%)
Ancestries Reported - Arab (%)
Ancestries Reported - Czech (%)
Ancestries Reported - Danish (%)
Ancestries Reported - Dutch (%)
Ancestries Reported - English (%)
Ancestries Reported - French (%)
Ancestries Reported - French Canadian (%)
Ancestries Reported - German (%)
Ancestries Reported - Greek (%)
Ancestries Reported - Hungarian (%)
Ancestries Reported - Irish (%)
Ancestries Reported - Italian (%)
Ancestries Reported - Lithuanian (%)
Ancestries Reported - Norwegian (%)
Ancestries Reported - Polish (%)
Ancestries Reported - Portuguese (%)
Ancestries Reported - Russian (%)
Ancestries Reported - Scotch-Irish (%)
Ancestries Reported - Scottish (%)
Ancestries Reported - Slovak (%)
Ancestries Reported - Subsaharan African (%)
Ancestries Reported - Swedish (%)
Ancestries Reported - Swiss (%)
Ancestries Reported - Ukrainian (%)
Ancestries Reported - United States (%)
Ancestries Reported - Welsh (%)
Ancestries Reported - West Indian (%)
Ancestries Reported - Other (%)
Geographical mobility - Same house 1 year ago (%)
Geographical mobility - Same house 1 year ago (%) - White
Geographical mobility - Same house 1 year ago (%) - Black or African American
Geographical mobility - Same house 1 year ago (%) - Asian
Geographical mobility - Same house 1 year ago (%) - Hispanic or Latino
Geographical mobility - Same house 1 year ago (%) - American Indian and Alaska Native
Geographical mobility - Same house 1 year ago (%) - Multirace
Geographical mobility - Same house 1 year ago (%) - Other Race
Geographical mobility - Moved within same county (%)
Geographical mobility - Moved within same county (%) - White
Geographical mobility - Moved within same county (%) - Black or African American
Geographical mobility - Moved within same county (%) - Asian
Geographical mobility - Moved within same county (%) - Hispanic or Latino
Geographical mobility - Moved within same county (%) - American Indian and Alaska Native
Geographical mobility - Moved within same county (%) - Multirace
Geographical mobility - Moved within same county (%) - Other Race
Geographical mobility - Moved from different county within same state (%)
Geographical mobility - Moved from different county within same state (%) - White
Geographical mobility - Moved from different county within same state (%) - Black or African American
Geographical mobility - Moved from different county within same state (%) - Asian
Geographical mobility - Moved from different county within same state (%) - Hispanic or Latino
Geographical mobility - Moved from different county within same state (%) - American Indian and Alaska Native
Geographical mobility - Moved from different county within same state (%) - Multirace
Geographical mobility - Moved from different county within same state (%) - Other Race
Geographical mobility - Moved from different state (%)
Geographical mobility - Moved from different state (%) - White
Geographical mobility - Moved from different state (%) - Black or African American
Geographical mobility - Moved from different state (%) - Asian
Geographical mobility - Moved from different state (%) - Hispanic or Latino
Geographical mobility - Moved from different state (%) - American Indian and Alaska Native
Geographical mobility - Moved from different state (%) - Multirace
Geographical mobility - Moved from different state (%) - Other Race
Geographical mobility - Moved from abroad (%)
Geographical mobility - Moved from abroad (%) - White
Geographical mobility - Moved from abroad (%) - Black or African American
Geographical mobility - Moved from abroad (%) - Asian
Geographical mobility - Moved from abroad (%) - Hispanic or Latino
Geographical mobility - Moved from abroad (%) - American Indian and Alaska Native
Geographical mobility - Moved from abroad (%) - Multirace
Geographical mobility - Moved from abroad (%) - Other Race
Place of birth for the foreign-born population - Ireland (%)
Place of birth for the foreign-born population - Denmark (%)
Place of birth for the foreign-born population - Norway (%)
Place of birth for the foreign-born population - Sweden (%)
Place of birth for the foreign-born population - United Kingdom (%)
Place of birth for the foreign-born population - England (%)
Place of birth for the foreign-born population - Scotland (%)
Place of birth for the foreign-born population - Other Northern Europe (%)
Place of birth for the foreign-born population - Austria (%)
Place of birth for the foreign-born population - Belgium (%)
Place of birth for the foreign-born population - France (%)
Place of birth for the foreign-born population - Germany (%)
Place of birth for the foreign-born population - Netherlands (%)
Place of birth for the foreign-born population - Switzerland (%)
Place of birth for the foreign-born population - Other Western Europe (%)
Place of birth for the foreign-born population - Greece (%)
Place of birth for the foreign-born population - Italy (%)
Place of birth for the foreign-born population - Portugal (%)
Place of birth for the foreign-born population - Spain (%)
Place of birth for the foreign-born population - Other Southern Europe (%)
Place of birth for the foreign-born population - Albania (%)
Place of birth for the foreign-born population - Belarus (%)
Place of birth for the foreign-born population - Bosnia and Herzegovina (%)
Place of birth for the foreign-born population - Bulgaria (%)
Place of birth for the foreign-born population - Croatia (%)
Place of birth for the foreign-born population - Czechoslovakia (%)
Place of birth for the foreign-born population - Hungary (%)
Place of birth for the foreign-born population - Latvia (%)
Place of birth for the foreign-born population - Lithuania (%)
Place of birth for the foreign-born population - North Macedonia (Macedonia) (%)
Place of birth for the foreign-born population - Moldova (%)
Place of birth for the foreign-born population - Poland (%)
Place of birth for the foreign-born population - Romania (%)
Place of birth for the foreign-born population - Russia (%)
Place of birth for the foreign-born population - Serbia (%)
Place of birth for the foreign-born population - Ukraine (%)
Place of birth for the foreign-born population - Other Eastern Europe (%)
Place of birth for the foreign-born population - China (%)
Place of birth for the foreign-born population - Hong Kong (%)
Place of birth for the foreign-born population - Taiwan (%)
Place of birth for the foreign-born population - Japan (%)
Place of birth for the foreign-born population - Korea (%)
Place of birth for the foreign-born population - Other Eastern Asia (%)
Place of birth for the foreign-born population - Afghanistan (%)
Place of birth for the foreign-born population - Bangladesh (%)
Place of birth for the foreign-born population - India (%)
Place of birth for the foreign-born population - Iran (%)
Place of birth for the foreign-born population - Kazakhstan (%)
Place of birth for the foreign-born population - Nepal (%)
Place of birth for the foreign-born population - Pakistan (%)
Place of birth for the foreign-born population - Sri Lanka (%)
Place of birth for the foreign-born population - Uzbekistan (%)
Place of birth for the foreign-born population - Other South Central Asia (%)
Place of birth for the foreign-born population - Burma (%)
Place of birth for the foreign-born population - Cambodia (%)
Place of birth for the foreign-born population - Indonesia (%)
Place of birth for the foreign-born population - Laos (%)
Place of birth for the foreign-born population - Malaysia (%)
Place of birth for the foreign-born population - Philippines (%)
Place of birth for the foreign-born population - Singapore (%)
Place of birth for the foreign-born population - Thailand (%)
Place of birth for the foreign-born population - Vietnam (%)
Place of birth for the foreign-born population - Other South Eastern Asia (%)
Place of birth for the foreign-born population - Armenia (%)
Place of birth for the foreign-born population - Iraq (%)
Place of birth for the foreign-born population - Israel (%)
Place of birth for the foreign-born population - Jordan (%)
Place of birth for the foreign-born population - Kuwait (%)
Place of birth for the foreign-born population - Lebanon (%)
Place of birth for the foreign-born population - Saudi Arabia (%)
Place of birth for the foreign-born population - Syria (%)
Place of birth for the foreign-born population - Turkey (%)
Place of birth for the foreign-born population - Yemen (%)
Place of birth for the foreign-born population - Other Western Asia (%)
Place of birth for the foreign-born population - Eritrea (%)
Place of birth for the foreign-born population - Ethiopia (%)
Place of birth for the foreign-born population - Kenya (%)
Place of birth for the foreign-born population - Somalia (%)
Place of birth for the foreign-born population - Uganda (%)
Place of birth for the foreign-born population - Zimbabwe (%)
Place of birth for the foreign-born population - Other Eastern Africa (%)
Place of birth for the foreign-born population - Cameroon (%)
Place of birth for the foreign-born population - Congo (%)
Place of birth for the foreign-born population - Democratic Republic of Congo (Zaire) (%)
Place of birth for the foreign-born population - Other Middle Africa (%)
Place of birth for the foreign-born population - Egypt (%)
Place of birth for the foreign-born population - Morocco (%)
Place of birth for the foreign-born population - Sudan (%)
Place of birth for the foreign-born population - Other Northern Africa (%)
Place of birth for the foreign-born population - South Africa (%)
Place of birth for the foreign-born population - Other Southern Africa (%)
Place of birth for the foreign-born population - Cabo Verde (%)
Place of birth for the foreign-born population - Ghana (%)
Place of birth for the foreign-born population - Liberia (%)
Place of birth for the foreign-born population - Nigeria (%)
Place of birth for the foreign-born population - Senegal (%)
Place of birth for the foreign-born population - Sierra Leone (%)
Place of birth for the foreign-born population - Other Western Africa (%)
Place of birth for the foreign-born population - Australia (%)
Place of birth for the foreign-born population - New Zealand (%)
Place of birth for the foreign-born population - Fiji (%)
Place of birth for the foreign-born population - Micronesia (%)
Place of birth for the foreign-born population - Bahamas (%)
Place of birth for the foreign-born population - Barbados (%)
Place of birth for the foreign-born population - Cuba (%)
Place of birth for the foreign-born population - Dominica (%)
Place of birth for the foreign-born population - Dominican Republic (%)
Place of birth for the foreign-born population - Grenada (%)
Place of birth for the foreign-born population - Haiti (%)
Place of birth for the foreign-born population - Jamaica (%)
Place of birth for the foreign-born population - St. Vincent and the Grenadines (%)
Place of birth for the foreign-born population - Trinidad and Tobago (%)
Place of birth for the foreign-born population - West Indies (%)
Place of birth for the foreign-born population - Other Caribbean (%)
Place of birth for the foreign-born population - Belize (%)
Place of birth for the foreign-born population - Costa Rica (%)
Place of birth for the foreign-born population - El Salvador (%)
Place of birth for the foreign-born population - Guatemala (%)
Place of birth for the foreign-born population - Honduras (%)
Place of birth for the foreign-born population - Mexico (%)
Place of birth for the foreign-born population - Nicaragua (%)
Place of birth for the foreign-born population - Panama (%)
Place of birth for the foreign-born population - Other Central America (%)
Place of birth for the foreign-born population - Argentina (%)
Place of birth for the foreign-born population - Bolivia (%)
Place of birth for the foreign-born population - Brazil (%)
Place of birth for the foreign-born population - Chile (%)
Place of birth for the foreign-born population - Colombia (%)
Place of birth for the foreign-born population - Ecuador (%)
Place of birth for the foreign-born population - Guyana (%)
Place of birth for the foreign-born population - Peru (%)
Place of birth for the foreign-born population - Uruguay (%)
Place of birth for the foreign-born population - Venezuela (%)
Place of birth for the foreign-born population - Other South America (%)
Place of birth for the foreign-born population - Canada (%)
Place of birth for the foreign-born population - Other Northern America (%)
Place of birth for the foreign-born population - Other (%)
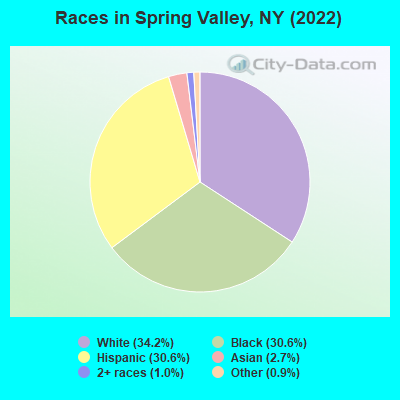
According to 2022 data, the most numerous races in Spring Valley, NY are White alone (11,333 residents), Hispanic (10,121 residents), and Black alone (10,121 residents). 27.3% of Spring Valley residents speak English at home. 35.5% of Spring Valley, NY residents are foreign-born (28.5% born in Latin America, 3.8% born in Europe), which is 38.1% greater than the foreign-born rate of 22.0% across the entire state of New York.
Race distribution in Spring Valley
2000 2022
11,760,981 62.0% White alone 2,867,583 15.1% Hispanic 2,812,623 14.8% Black alone 1,035,926 5.5% Asian alone 366,116 1.9% Two or more races 75,499 0.4% Other race alone 52,499 0.3% American Indian alone 5,230 0.03% Native Hawaiian and Other
10,408,933 52.9% White alone 3,867,299 19.7% Hispanic 2,633,840 13.4% Black alone 1,776,286 9.0% Asian alone 732,670 3.7% Two or more races 216,110 1.1% Other race alone 35,082 0.2% American Indian alone 6,931 0.04% Native Hawaiian and Other
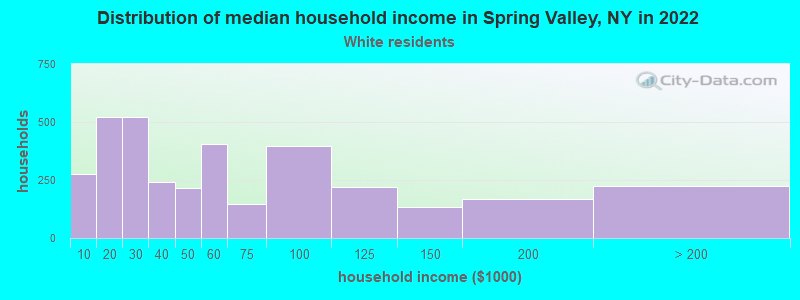
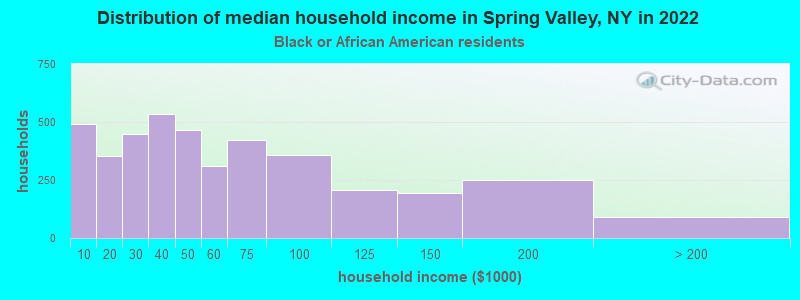
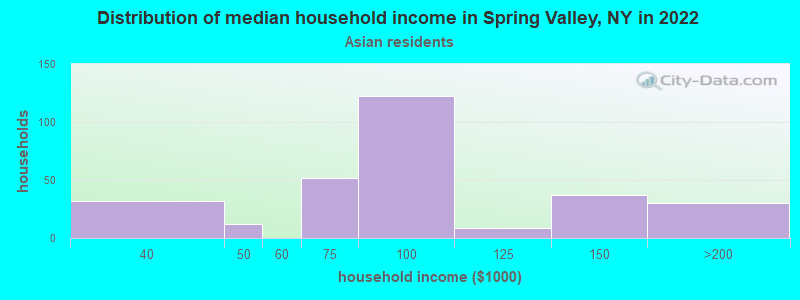
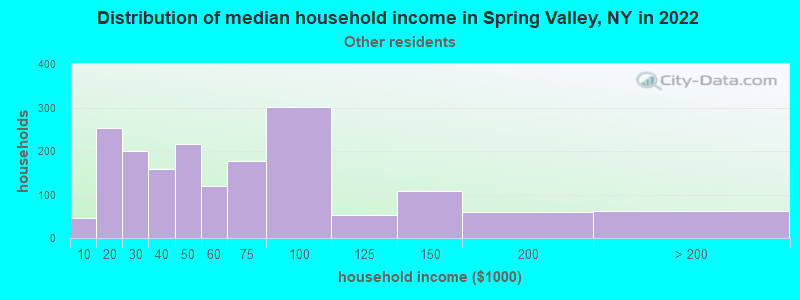
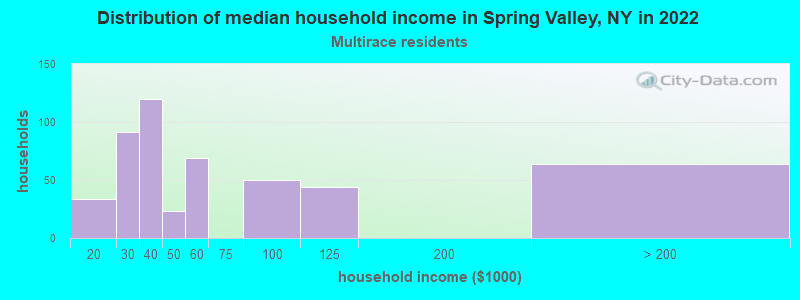
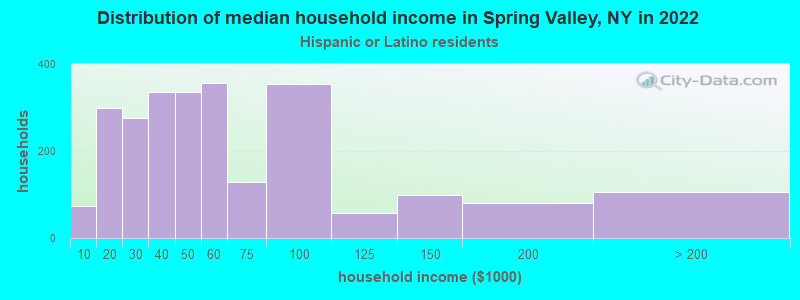
Income and house value in Spring Valley Median household income in 2022 $47,503 White non-Hispanic householders$40,215 Black householders$83,007 Asian householders$47,058 Some other race householders$35,488 Two or more races householders$47,449 Hispanic or Latino race householdersMedian 2022 house value $429,255 White Non-Hispanic householders$341,026 Black or African American householders $309,158 Asian householders$314,866 Some other race householders$234,485 Two or more races householders$331,751 Hispanic or Latino householders
Median age by race in Spring Valley
20.4 Median age for White residents21.7 20.1 33.4 Median age for Black or African American residents34.9 33.1 -666,666,666.0 Median age for American Indian / Alaska Native residents-750,656,167.2 -644,444,443.8 43.0 Median age for Asian residents40.1 45.3 -463,937,621.4 Median age for Native Hawaiian / Pacific Islander residents-649,572,648.9 -666,666,666.0 29.1 Median age for Other race residents26.8 31.6 21.8 Median age for Two or more races residents29.5 24.2 20.1 Median age for White alone residents18.4 21.3 25.7 Median age for Hispanic or Latino residents25.2 26.0
Owner/renter occupied households by race in Spring Valley
House owners and renters - White residents 1,377 39.9% Owner occupied2,078 60.1% Renter occupiedHouse owners and renters - Black or African American residents 738 22.1% Owner occupied2,597 77.9% Renter occupiedHouse owners and renters - Asian residents 88 52.0% Owner occupied81 48.0% Renter occupiedHouse owners and renters - Other race residents 137 9.4% Owner occupied1,321 90.6% Renter occupiedHouse owners and renters - Two or more races residents 45 5.7% Owner occupied734 94.3% Renter occupiedHouse owners and renters - White alone residents 1,176 39.0% Owner occupied1,842 61.0% Renter occupiedHouse owners and renters - Hispanic or Latino residents 367 13.8% Owner occupied2,297 86.2% Renter occupied
Language usage in Spring Valley
English speakers - Total 27.3% of residents of Spring Valley speak English at home.
22.9% of residents speak Spanish at home 3,396 50.3% Speak English very well3,351 49.7% Speak English less than very well49.0% of residents speak other language at home 5,628 38.9% Speak English very well8,832 61.1% Speak English less than very well
English speakers - Born in the United States 62.5% of residents of Spring Valley speak English at home.
18.4% of residents speak Spanish at home 395 93.4% Speak English very well28 6.6% Speak English less than very well15.7% of residents speak other language at home 206 57.2% Speak English very well154 42.8% Speak English less than very well
English speakers - Native, born elsewhere 11.4% of residents of Spring Valley speak English at home.
38.8% of residents speak Spanish at home 388 100.0% Speak English very well64.9% of residents speak other language at home 424 65.3% Speak English very well225 34.7% Speak English less than very well
English speakers - Foreign-born 10.0% of residents of Spring Valley speak English at home.
33.4% of residents speak Spanish at home 593 15.7% Speak English very well3,189 84.3% Speak English less than very well57.8% of residents speak other language at home 1,879 28.7% Speak English very well4,668 71.3% Speak English less than very well
White (Caucasian) - Speak only English Native:
27.4% (2,698)Foreign-born:
5.6% (85)
White (Caucasian) - Speak another language Native:
69.1% (6,797)Foreign-born:
87.6% (1,328)
Black or African American - Speak only English Native:
64.5% (2,668)Foreign-born:
13.9% (664)
Black or African American - Speak another language Native:
36.0% (1,488)Foreign-born:
87.2% (4,159)
Asian - Speak only English Native:
36.8% (48)Foreign-born:
13.4% (91)
Asian - Speak another language Native:
60.0% (78)Foreign-born:
86.4% (589)
Other race - Speak only English Native:
36.9% (804)Foreign-born:
4.0% (149)
Other race - Speak another language Native:
62.2% (1,356)Foreign-born:
95.4% (3,502)
Two or more races - Speak only English Native:
42.5% (649)Foreign-born:
4.4% (32)
Two or more races - Speak another language Native:
54.2% (829)Foreign-born:
92.9% (664)
White alone - Speak only English Native:
28.8% (2,404)Foreign-born:
5.5% (84)
White alone - Speak another language Native:
71.4% (5,953)Foreign-born:
92.3% (1,417)
Hispanic or Latino - Speak only English Native:
32.4% (1,656)Foreign-born:
5.1% (199)
Hispanic or Latino - Speak another language Native:
60.3% (3,087)Foreign-born:
95.0% (3,732)
Foreign-born residents in Spring Valley 11,768 residents are foreign born (28.5% Latin America , 3.8% Europe ).
This city:
35.5%New York:
22.6%
Marital status for residents in Spring Valley Marital status - White (Caucasian) population 15 years and over
Males 34.3% Never married55.9% Now married2.3% Separated0.3% Widowed7.3% DivorcedFemales 32.9% Never married52.4% Now married2.4% Separated6.1% Widowed6.3% DivorcedWomen who gave birth in the past 12 months Now married:
100.0% (293)Unmarried:
0.0% (0)
Women who did not give birth in the past 12 months Now married:
48.0% (1,151)Unmarried:
52.0% (1,246)
Marital status - Black or African American population 15 years and over
Males 40.6% Never married43.3% Now married8.6% Separated1.7% Widowed5.9% DivorcedFemales 48.1% Never married27.0% Now married5.0% Separated7.6% Widowed12.3% DivorcedWomen who gave birth in the past 12 months Now married:
34.4% (106)Unmarried:
65.6% (202)
Women who did not give birth in the past 12 months Now married:
39.0% (727)Unmarried:
61.0% (1,136)
Marital status - Asian population 15 years and over
Males 23.0% Never married73.2% Now married0.0% Separated3.8% Widowed0.0% DivorcedFemales 6.6% Never married76.1% Now married3.7% Separated7.4% Widowed6.2% DivorcedWomen who gave birth in the past 12 months Now married:
100.0% (8)Unmarried:
0.0% (0)
Women who did not give birth in the past 12 months Now married:
86.6% (116)Unmarried:
13.4% (18)
Marital status - Other race population 15 years and over
Males 49.4% Never married46.0% Now married0.7% Separated0.0% Widowed3.9% DivorcedFemales 31.1% Never married41.9% Now married7.3% Separated2.3% Widowed17.4% DivorcedWomen who gave birth in the past 12 months Now married:
100.0% (169)Unmarried:
0.0% (0)
Women who did not give birth in the past 12 months Now married:
46.3% (626)Unmarried:
53.7% (726)
Marital status - Two or more races population 15 years and over
Males 42.2% Never married51.9% Now married3.0% Separated0.0% Widowed3.0% DivorcedFemales 18.0% Never married68.0% Now married0.0% Separated12.2% Widowed1.8% DivorcedWomen who did not give birth in the past 12 months Now married:
76.9% (402)Unmarried:
23.1% (121)
Marital status - White alone, not Hispanic / Latino population 15 years and over
Males 34.1% Never married55.3% Now married2.7% Separated0.3% Widowed7.6% DivorcedFemales 26.8% Never married58.8% Now married0.8% Separated7.2% Widowed6.3% DivorcedWomen who gave birth in the past 12 months Now married:
100.0% (303)Unmarried:
0.0% (0)
Women who did not give birth in the past 12 months Now married:
54.7% (1,043)Unmarried:
45.3% (864)
Marital status - Hispanic or Latino population 15 years and over
Males 46.9% Never married48.6% Now married0.4% Separated0.0% Widowed4.1% DivorcedFemales 39.1% Never married38.3% Now married8.9% Separated1.5% Widowed12.2% DivorcedWomen who gave birth in the past 12 months Now married:
100.0% (172)Unmarried:
0.0% (0)
Women who did not give birth in the past 12 months Now married:
46.4% (1,074)Unmarried:
53.6% (1,239)
Ancestries in Spring Valley
4,784 25.9% Haitian2,210 12.0% American1,815 9.8% Hungarian705 3.8% Polish532 2.9% European307 1.7% Jamaican174 0.9% Eastern European159 0.9% Trinidadian and Tobagonian132 0.7% Russian105 0.6% Ukrainian97 0.5% African76 0.4% Israeli75 0.4% Ghanaian56 0.3% Estonian49 0.3% English48 0.3% Egyptian42 0.2% German37 0.2% Austrian33 0.2% Romanian32 0.2% Irish30 0.2% French27 0.1% Brazilian26 0.1% Belizean22 0.1% Italian21 0.1% Dutch21 0.1% West Indian18 0.10% Nigerian16 0.09% Norwegian16 0.09% Slovak12 0.06% Danish10 0.05% Turkish10 0.05% British West Indian9 0.05% Lithuanian3 0.02% French Canadian
Geographical mobility in Spring Valley Same house 1 year ago 11,620 91.9% White (Caucasian)8,238 85.7% Black or African American3 100.0% American Indian / Alaska Native717 83.5% Asian6,280 91.8% Other race1,871 85.0% Two or more races10,134 91.6% White alone, not Hispanic / Latino9,243 92.4% Hispanic or LatinoMoved within same county 423 3.3% White / Caucasian387 4.0% Black or African American12 1.4% Asian221 3.2% Other race4 0.2% Two or more races340 3.1% White alone, not Hispanic / Latino549 5.5% Hispanic or LatinoMoved within same state 355 2.8% White / Caucasian397 4.1% Black or African American337 4.9% Other race100 4.5% Two or more races317 2.9% White alone, not Hispanic / Latino277 2.8% Hispanic or LatinoMoved from different state 39 0.3% White / Caucasian141 1.5% Black or African American36 0.3% White alone, not Hispanic / Latino4 0.0% Hispanic or LatinoMoved from abroad 246 1.9% White297 3.1% Black or African American119 13.8% Asian151 2.2% Other race256 11.6% Two or more races225 2.0% White alone, not Hispanic / Latino377 3.8% Hispanic or Latino
Children Nativity (place of birth) in Spring Valley
Children under 6 years - Living with two parents Both parents native 1,413 99.9% Native2 0.1% Foreign-bornBoth parents foreign-born 1,090 92.7% Native86 7.3% Foreign-bornOne native, one foreign-born parent 336 100.0% NativeChildren under 6 years - Living with one parent Native parent 183 100.0% NativeForeign-born parent 622 79.2% Native163 20.8% Foreign-bornChildren 6 to 17 years - Living with two parents Both parents native 2,643 98.7% Native35 1.3% Foreign-bornBoth parents foreign-born 1,475 80.9% Native348 19.1% Foreign-bornOne native, one foreign-born parent 835 93.8% Native55 6.2% Foreign-bornChildren 6 to 17 years - Living with one parent Native parent 972 100.0% NativeForeign-born parent 660 55.7% Native525 44.3% Foreign-born
Grandparents responsible for own grandchildren in Spring Valley
Grandparents (30 to 59 years) White / Caucasian 24 100.0% Responsible for grandchildrenBlack or African American 120 60.4% Responsible for grandchildren78 39.6% Not responsible for grandchildrenAsian 10 100.0% Not responsible for grandchildrenOther race 83 100.0% Responsible for grandchildrenWhite alone, not Hispanic / Latino 25 100.0% Responsible for grandchildrenHispanic or Latino 71 100.0% Responsible for grandchildrenGrandparents (60 years and over) White / Caucasian 46 13.8% Responsible for grandchildren289 86.2% Not responsible for grandchildrenBlack or African American 46 29.2% Responsible for grandchildren111 70.8% Not responsible for grandchildrenAsian 8 23.0% Responsible for grandchildren26 77.0% Not responsible for grandchildrenOther race 27 48.5% Responsible for grandchildren28 51.5% Not responsible for grandchildrenWhite alone, not Hispanic / Latino 50 74.7% Responsible for grandchildren17 25.3% Not responsible for grandchildrenHispanic or Latino 28 7.6% Responsible for grandchildren343 92.4% Not responsible for grandchildren