Races in Tuckahoe, New York (NY) Detailed Stats
Data:
Races - White alone (%)
Races - White alone (% change since 2000)
Races - Black alone (%)
Races - Black alone (% change since 2000)
Races - American Indian alone (%)
Races - American Indian alone (% change since 2000)
Races - Asian alone (%)
Races - Asian alone (% change since 2000)
Races - Hispanic (%)
Races - Hispanic (% change since 2000)
Races - Native Hawaiian and Other Pacific Islander alone (%)
Races - Native Hawaiian and Other Pacific Islander alone (% change since 2000)
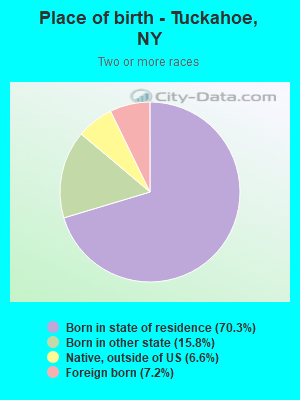
Races - Two or more races(%)
Races - Two or more races(% change since 2000)
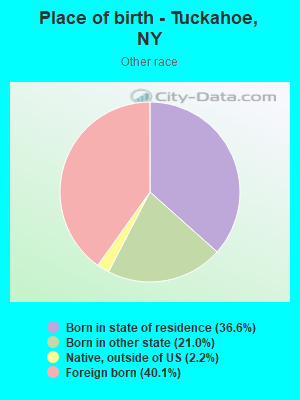
Races - Other race alone (%)
Races - Other race alone (% change since 2000)
Racial diversity
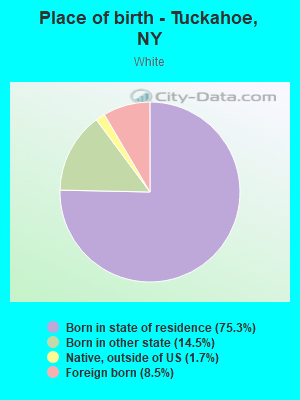
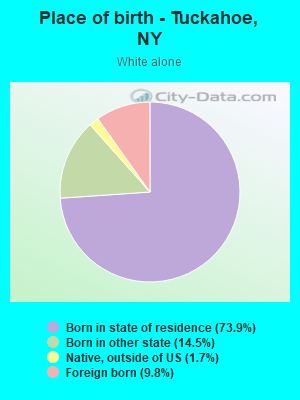
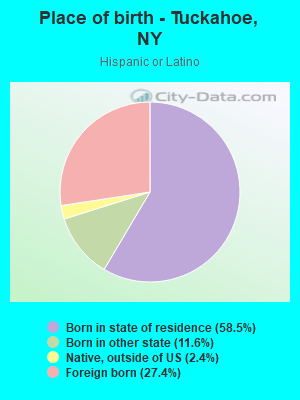
Place of birth - Born in state of residence (%)
Place of birth - Born in state of residence (%) - White
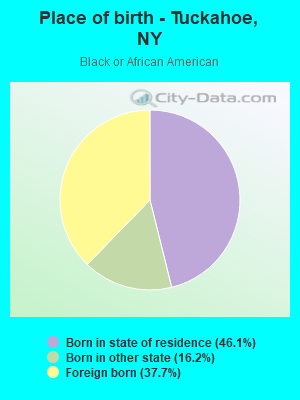
Place of birth - Born in state of residence (%) - Black or African American
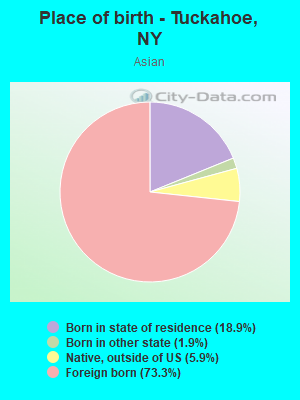
Place of birth - Born in state of residence (%) - Asian
Place of birth - Born in state of residence (%) - Hispanic or Latino
Place of birth - Born in state of residence (%) - American Indian and Alaska Native
Place of birth - Born in state of residence (%) - Multirace
Place of birth - Born in state of residence (%) - Other Race
Place of birth - Born in other state (%)
Place of birth - Born in other state (%) - White
Place of birth - Born in other state (%) - Black or African American
Place of birth - Born in other state (%) - Asian
Place of birth - Born in other state (%) - Hispanic or Latino
Place of birth - Born in other state (%) - American Indian and Alaska Native
Place of birth - Born in other state (%) - Multirace
Place of birth - Born in other state (%) - Other Race
Place of birth - Native, outside of US (%)
Place of birth - Native, outside of US (%) - White
Place of birth - Native, outside of US (%) - Black or African American
Place of birth - Native, outside of US (%) - Asian
Place of birth - Native, outside of US (%) - Hispanic or Latino
Place of birth - Native, outside of US (%) - American Indian and Alaska Native
Place of birth - Native, outside of US (%) - Multirace
Place of birth - Native, outside of US (%) - Other Race
Place of birth - Foreign born (%)
Place of birth - Foreign born (%) - White
Place of birth - Foreign born (%) - Black or African American
Place of birth - Foreign born (%) - Asian
Place of birth - Foreign born (%) - Hispanic or Latino
Place of birth - Foreign born (%) - American Indian and Alaska Native
Place of birth - Foreign born (%) - Multirace
Place of birth - Foreign born (%) - Other Race
Residents speaking English at home (%)
Residents speaking English at home - Born in the United States (%)
Residents speaking English at home - Native, born elsewhere (%)
Residents speaking English at home - Foreign born (%)
Residents speaking Spanish at home (%)
Residents speaking Spanish at home - Born in the United States (%)
Residents speaking Spanish at home - Native, born elsewhere (%)
Residents speaking Spanish at home - Foreign born (%)
Residents speaking other language at home (%)
Residents speaking other language at home - Born in the United States (%)
Residents speaking other language at home - Native, born elsewhere (%)
Residents speaking other language at home - Foreign born (%)
Marital status - Never married (%)
Marital status - Now married (%)
Marital status - Separated (%)
Marital status - Widowed (%)
Marital status - Divorced (%)
Ancestries Reported - Arab (%)
Ancestries Reported - Czech (%)
Ancestries Reported - Danish (%)
Ancestries Reported - Dutch (%)
Ancestries Reported - English (%)
Ancestries Reported - French (%)
Ancestries Reported - French Canadian (%)
Ancestries Reported - German (%)
Ancestries Reported - Greek (%)
Ancestries Reported - Hungarian (%)
Ancestries Reported - Irish (%)
Ancestries Reported - Italian (%)
Ancestries Reported - Lithuanian (%)
Ancestries Reported - Norwegian (%)
Ancestries Reported - Polish (%)
Ancestries Reported - Portuguese (%)
Ancestries Reported - Russian (%)
Ancestries Reported - Scotch-Irish (%)
Ancestries Reported - Scottish (%)
Ancestries Reported - Slovak (%)
Ancestries Reported - Subsaharan African (%)
Ancestries Reported - Swedish (%)
Ancestries Reported - Swiss (%)
Ancestries Reported - Ukrainian (%)
Ancestries Reported - United States (%)
Ancestries Reported - Welsh (%)
Ancestries Reported - West Indian (%)
Ancestries Reported - Other (%)
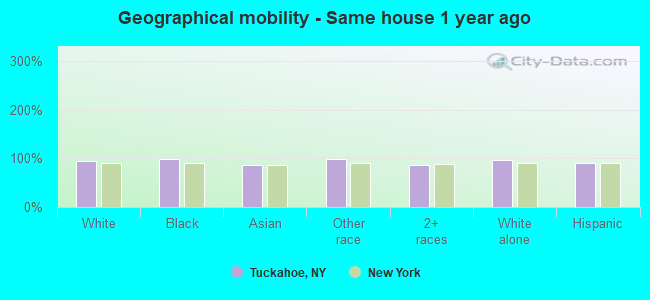
Geographical mobility - Same house 1 year ago (%)
Geographical mobility - Same house 1 year ago (%) - White
Geographical mobility - Same house 1 year ago (%) - Black or African American
Geographical mobility - Same house 1 year ago (%) - Asian
Geographical mobility - Same house 1 year ago (%) - Hispanic or Latino
Geographical mobility - Same house 1 year ago (%) - American Indian and Alaska Native
Geographical mobility - Same house 1 year ago (%) - Multirace
Geographical mobility - Same house 1 year ago (%) - Other Race
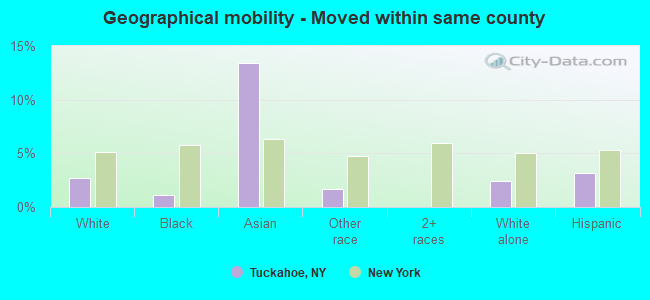
Geographical mobility - Moved within same county (%)
Geographical mobility - Moved within same county (%) - White
Geographical mobility - Moved within same county (%) - Black or African American
Geographical mobility - Moved within same county (%) - Asian
Geographical mobility - Moved within same county (%) - Hispanic or Latino
Geographical mobility - Moved within same county (%) - American Indian and Alaska Native
Geographical mobility - Moved within same county (%) - Multirace
Geographical mobility - Moved within same county (%) - Other Race
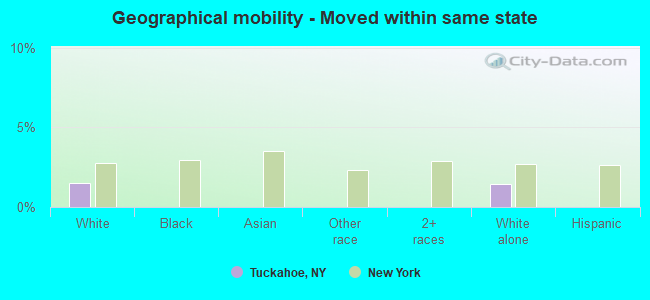
Geographical mobility - Moved from different county within same state (%)
Geographical mobility - Moved from different county within same state (%) - White
Geographical mobility - Moved from different county within same state (%) - Black or African American
Geographical mobility - Moved from different county within same state (%) - Asian
Geographical mobility - Moved from different county within same state (%) - Hispanic or Latino
Geographical mobility - Moved from different county within same state (%) - American Indian and Alaska Native
Geographical mobility - Moved from different county within same state (%) - Multirace
Geographical mobility - Moved from different county within same state (%) - Other Race
Geographical mobility - Moved from different state (%)
Geographical mobility - Moved from different state (%) - White
Geographical mobility - Moved from different state (%) - Black or African American
Geographical mobility - Moved from different state (%) - Asian
Geographical mobility - Moved from different state (%) - Hispanic or Latino
Geographical mobility - Moved from different state (%) - American Indian and Alaska Native
Geographical mobility - Moved from different state (%) - Multirace
Geographical mobility - Moved from different state (%) - Other Race
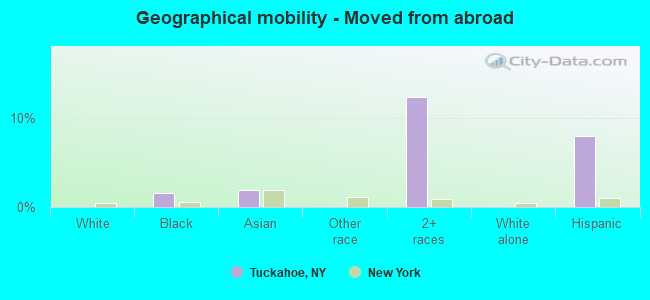
Geographical mobility - Moved from abroad (%)
Geographical mobility - Moved from abroad (%) - White
Geographical mobility - Moved from abroad (%) - Black or African American
Geographical mobility - Moved from abroad (%) - Asian
Geographical mobility - Moved from abroad (%) - Hispanic or Latino
Geographical mobility - Moved from abroad (%) - American Indian and Alaska Native
Geographical mobility - Moved from abroad (%) - Multirace
Geographical mobility - Moved from abroad (%) - Other Race
Place of birth for the foreign-born population - Ireland (%)
Place of birth for the foreign-born population - Denmark (%)
Place of birth for the foreign-born population - Norway (%)
Place of birth for the foreign-born population - Sweden (%)
Place of birth for the foreign-born population - United Kingdom (%)
Place of birth for the foreign-born population - England (%)
Place of birth for the foreign-born population - Scotland (%)
Place of birth for the foreign-born population - Other Northern Europe (%)
Place of birth for the foreign-born population - Austria (%)
Place of birth for the foreign-born population - Belgium (%)
Place of birth for the foreign-born population - France (%)
Place of birth for the foreign-born population - Germany (%)
Place of birth for the foreign-born population - Netherlands (%)
Place of birth for the foreign-born population - Switzerland (%)
Place of birth for the foreign-born population - Other Western Europe (%)
Place of birth for the foreign-born population - Greece (%)
Place of birth for the foreign-born population - Italy (%)
Place of birth for the foreign-born population - Portugal (%)
Place of birth for the foreign-born population - Spain (%)
Place of birth for the foreign-born population - Other Southern Europe (%)
Place of birth for the foreign-born population - Albania (%)
Place of birth for the foreign-born population - Belarus (%)
Place of birth for the foreign-born population - Bosnia and Herzegovina (%)
Place of birth for the foreign-born population - Bulgaria (%)
Place of birth for the foreign-born population - Croatia (%)
Place of birth for the foreign-born population - Czechoslovakia (%)
Place of birth for the foreign-born population - Hungary (%)
Place of birth for the foreign-born population - Latvia (%)
Place of birth for the foreign-born population - Lithuania (%)
Place of birth for the foreign-born population - North Macedonia (Macedonia) (%)
Place of birth for the foreign-born population - Moldova (%)
Place of birth for the foreign-born population - Poland (%)
Place of birth for the foreign-born population - Romania (%)
Place of birth for the foreign-born population - Russia (%)
Place of birth for the foreign-born population - Serbia (%)
Place of birth for the foreign-born population - Ukraine (%)
Place of birth for the foreign-born population - Other Eastern Europe (%)
Place of birth for the foreign-born population - China (%)
Place of birth for the foreign-born population - Hong Kong (%)
Place of birth for the foreign-born population - Taiwan (%)
Place of birth for the foreign-born population - Japan (%)
Place of birth for the foreign-born population - Korea (%)
Place of birth for the foreign-born population - Other Eastern Asia (%)
Place of birth for the foreign-born population - Afghanistan (%)
Place of birth for the foreign-born population - Bangladesh (%)
Place of birth for the foreign-born population - India (%)
Place of birth for the foreign-born population - Iran (%)
Place of birth for the foreign-born population - Kazakhstan (%)
Place of birth for the foreign-born population - Nepal (%)
Place of birth for the foreign-born population - Pakistan (%)
Place of birth for the foreign-born population - Sri Lanka (%)
Place of birth for the foreign-born population - Uzbekistan (%)
Place of birth for the foreign-born population - Other South Central Asia (%)
Place of birth for the foreign-born population - Burma (%)
Place of birth for the foreign-born population - Cambodia (%)
Place of birth for the foreign-born population - Indonesia (%)
Place of birth for the foreign-born population - Laos (%)
Place of birth for the foreign-born population - Malaysia (%)
Place of birth for the foreign-born population - Philippines (%)
Place of birth for the foreign-born population - Singapore (%)
Place of birth for the foreign-born population - Thailand (%)
Place of birth for the foreign-born population - Vietnam (%)
Place of birth for the foreign-born population - Other South Eastern Asia (%)
Place of birth for the foreign-born population - Armenia (%)
Place of birth for the foreign-born population - Iraq (%)
Place of birth for the foreign-born population - Israel (%)
Place of birth for the foreign-born population - Jordan (%)
Place of birth for the foreign-born population - Kuwait (%)
Place of birth for the foreign-born population - Lebanon (%)
Place of birth for the foreign-born population - Saudi Arabia (%)
Place of birth for the foreign-born population - Syria (%)
Place of birth for the foreign-born population - Turkey (%)
Place of birth for the foreign-born population - Yemen (%)
Place of birth for the foreign-born population - Other Western Asia (%)
Place of birth for the foreign-born population - Eritrea (%)
Place of birth for the foreign-born population - Ethiopia (%)
Place of birth for the foreign-born population - Kenya (%)
Place of birth for the foreign-born population - Somalia (%)
Place of birth for the foreign-born population - Uganda (%)
Place of birth for the foreign-born population - Zimbabwe (%)
Place of birth for the foreign-born population - Other Eastern Africa (%)
Place of birth for the foreign-born population - Cameroon (%)
Place of birth for the foreign-born population - Congo (%)
Place of birth for the foreign-born population - Democratic Republic of Congo (Zaire) (%)
Place of birth for the foreign-born population - Other Middle Africa (%)
Place of birth for the foreign-born population - Egypt (%)
Place of birth for the foreign-born population - Morocco (%)
Place of birth for the foreign-born population - Sudan (%)
Place of birth for the foreign-born population - Other Northern Africa (%)
Place of birth for the foreign-born population - South Africa (%)
Place of birth for the foreign-born population - Other Southern Africa (%)
Place of birth for the foreign-born population - Cabo Verde (%)
Place of birth for the foreign-born population - Ghana (%)
Place of birth for the foreign-born population - Liberia (%)
Place of birth for the foreign-born population - Nigeria (%)
Place of birth for the foreign-born population - Senegal (%)
Place of birth for the foreign-born population - Sierra Leone (%)
Place of birth for the foreign-born population - Other Western Africa (%)
Place of birth for the foreign-born population - Australia (%)
Place of birth for the foreign-born population - New Zealand (%)
Place of birth for the foreign-born population - Fiji (%)
Place of birth for the foreign-born population - Micronesia (%)
Place of birth for the foreign-born population - Bahamas (%)
Place of birth for the foreign-born population - Barbados (%)
Place of birth for the foreign-born population - Cuba (%)
Place of birth for the foreign-born population - Dominica (%)
Place of birth for the foreign-born population - Dominican Republic (%)
Place of birth for the foreign-born population - Grenada (%)
Place of birth for the foreign-born population - Haiti (%)
Place of birth for the foreign-born population - Jamaica (%)
Place of birth for the foreign-born population - St. Vincent and the Grenadines (%)
Place of birth for the foreign-born population - Trinidad and Tobago (%)
Place of birth for the foreign-born population - West Indies (%)
Place of birth for the foreign-born population - Other Caribbean (%)
Place of birth for the foreign-born population - Belize (%)
Place of birth for the foreign-born population - Costa Rica (%)
Place of birth for the foreign-born population - El Salvador (%)
Place of birth for the foreign-born population - Guatemala (%)
Place of birth for the foreign-born population - Honduras (%)
Place of birth for the foreign-born population - Mexico (%)
Place of birth for the foreign-born population - Nicaragua (%)
Place of birth for the foreign-born population - Panama (%)
Place of birth for the foreign-born population - Other Central America (%)
Place of birth for the foreign-born population - Argentina (%)
Place of birth for the foreign-born population - Bolivia (%)
Place of birth for the foreign-born population - Brazil (%)
Place of birth for the foreign-born population - Chile (%)
Place of birth for the foreign-born population - Colombia (%)
Place of birth for the foreign-born population - Ecuador (%)
Place of birth for the foreign-born population - Guyana (%)
Place of birth for the foreign-born population - Peru (%)
Place of birth for the foreign-born population - Uruguay (%)
Place of birth for the foreign-born population - Venezuela (%)
Place of birth for the foreign-born population - Other South America (%)
Place of birth for the foreign-born population - Canada (%)
Place of birth for the foreign-born population - Other Northern America (%)
Place of birth for the foreign-born population - Other (%)
Latest news about races in Tuckahoe, NY collected exclusively by city-data.com from local newspapers, TV, and radio stations
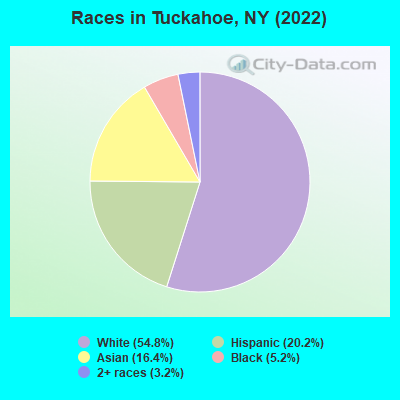
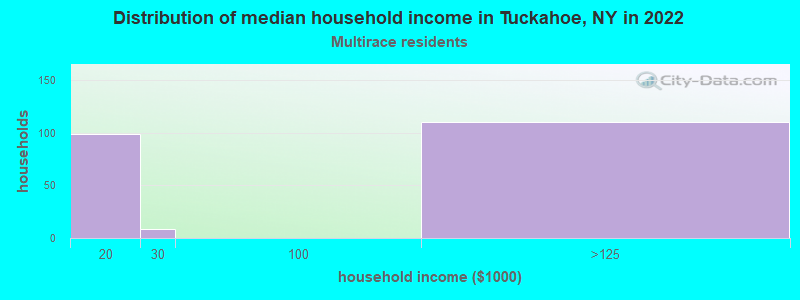
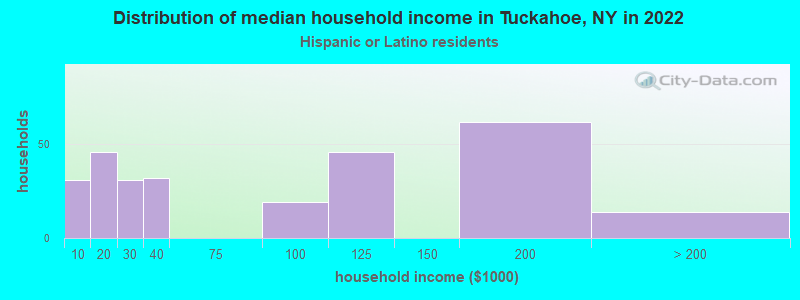
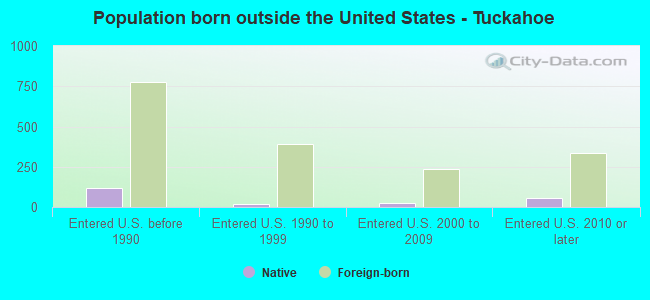
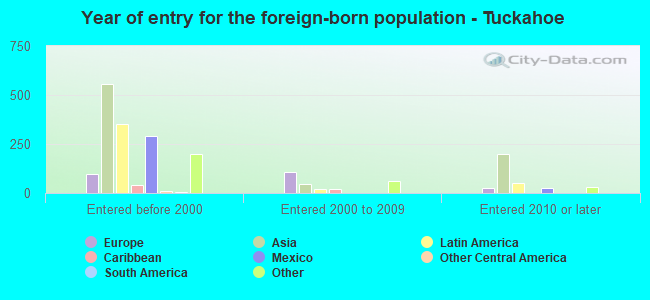
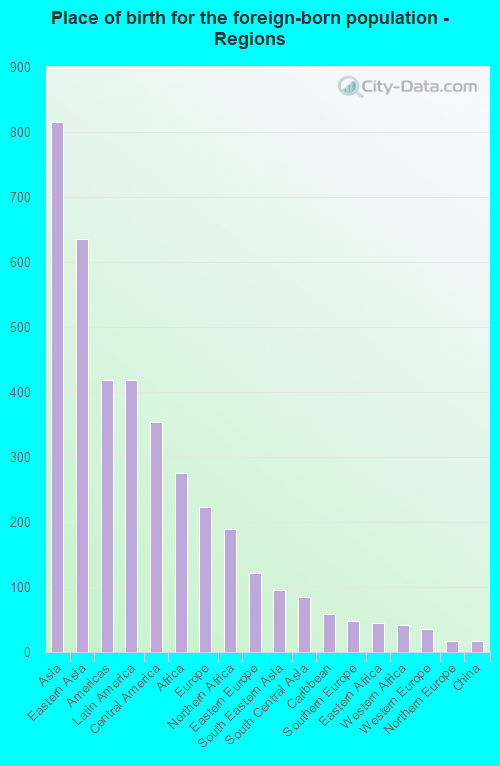
According to 2022 data, the most numerous races in Tuckahoe, NY are White alone (3,801 residents), Hispanic (1,400 residents), and Black alone (364 residents). 65.2% of Tuckahoe residents speak English at home. 25.0% of Tuckahoe, NY residents are foreign-born (11.8% born in Asia, 6.0% born in Latin America, 4.0% born in Africa, 3.2% born in Europe), which is 12.0% greater than the foreign-born rate of 22.0% across the entire state of New York.
Race distribution in Tuckahoe
2000 2022
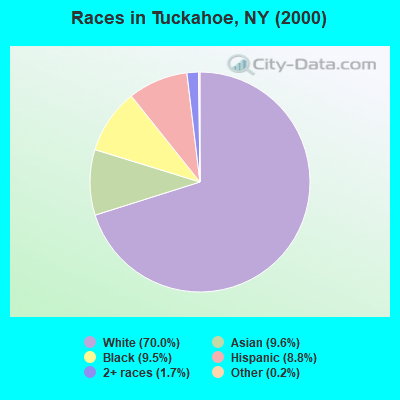
11,760,981 62.0% White alone 2,867,583 15.1% Hispanic 2,812,623 14.8% Black alone 1,035,926 5.5% Asian alone 366,116 1.9% Two or more races 75,499 0.4% Other race alone 52,499 0.3% American Indian alone 5,230 0.03% Native Hawaiian and Other
10,408,933 52.9% White alone 3,867,299 19.7% Hispanic 2,633,840 13.4% Black alone 1,776,286 9.0% Asian alone 732,670 3.7% Two or more races 216,110 1.1% Other race alone 35,082 0.2% American Indian alone 6,931 0.04% Native Hawaiian and Other
Income and house value in Tuckahoe Median household income in 2022 $129,432 White non-Hispanic householders$52,306 Asian householdersMedian 2022 house value $695,368 White Non-Hispanic householders$428,977 Black or African American householders $600,962 Asian householders$355,114 Some other race householders$717,439 Hispanic or Latino householders
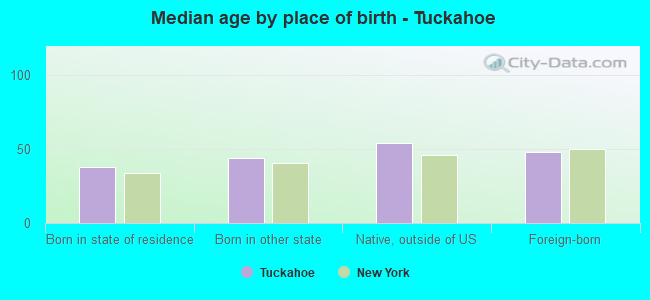
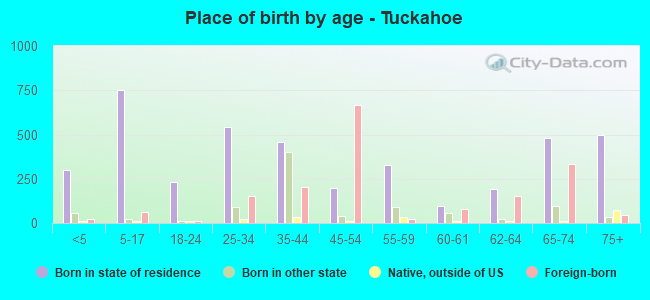
Median age by race in Tuckahoe
57.1 Median age for White residents45.9 60.1 39.8 Median age for Black or African American residents39.5 51.9 -641,441,440.8 Median age for American Indian / Alaska Native residents-664,804,468.6 -554,999,999.4 47.7 Median age for Asian residents38.4 47.7 -487,992,314.6 Median age for Native Hawaiian / Pacific Islander residents-477,502,295.2 -666,666,666.0 39.5 Median age for Other race residents48.5 37.0 8.6 Median age for Two or more races residents6.5 33.1 57.1 Median age for White alone residents47.4 60.0 37.6 Median age for Hispanic or Latino residents38.2 37.5
Owner/renter occupied households by race in Tuckahoe
House owners and renters - White residents 1,089 59.5% Owner occupied742 40.5% Renter occupiedHouse owners and renters - Black or African American residents 34 15.7% Owner occupied184 84.3% Renter occupiedHouse owners and renters - Asian residents 238 36.8% Owner occupied409 63.2% Renter occupiedHouse owners and renters - Other race residents 147 100.0% Renter occupiedHouse owners and renters - Two or more races residents 55 26.1% Owner occupied155 73.9% Renter occupiedHouse owners and renters - White alone residents 1,112 59.7% Owner occupied751 40.3% Renter occupiedHouse owners and renters - Hispanic or Latino residents 56 17.2% Owner occupied270 82.8% Renter occupied
Language usage in Tuckahoe
English speakers - Total 65.2% of residents of Tuckahoe speak English at home.
15.0% of residents speak Spanish at home 311 31.6% Speak English very well673 68.4% Speak English less than very well19.0% of residents speak other language at home 902 72.4% Speak English very well343 27.6% Speak English less than very well
English speakers - Born in the United States 82.6% of residents of Tuckahoe speak English at home.
11.4% of residents speak Spanish at home 10 10.3% Speak English very well87 89.7% Speak English less than very well
English speakers - Native, born elsewhere 66.8% of residents of Tuckahoe speak English at home.
14.6% of residents speak Spanish at home 19 57.6% Speak English very well14 42.4% Speak English less than very well2.2% of residents speak other language at home 5 100.0% Speak English less than very well
English speakers - Foreign-born 13.0% of residents of Tuckahoe speak English at home.
22.0% of residents speak Spanish at home 52 13.7% Speak English very well327 86.3% Speak English less than very well62.1% of residents speak other language at home 754 70.6% Speak English very well314 29.4% Speak English less than very well
White (Caucasian) - Speak only English Native:
99.4% (3,241)Foreign-born:
45.8% (144)
White (Caucasian) - Speak another language Native:
2.6% (86)Foreign-born:
57.3% (180)
Black or African American - Speak only English Native:
82.2% (186)Foreign-born:
39.0% (44)
Black or African American - Speak another language Native:
15.5% (35)Foreign-born:
58.1% (66)
Asian - Speak only English Native:
60.7% (190)Foreign-born:
2.2% (18)
Asian - Speak another language Native:
39.2% (122)Foreign-born:
96.7% (783)
Other race - Speak another language Native:
99.2% (540)Foreign-born:
96.8% (347)
Two or more races - Speak another language Native:
20.7% (110)Foreign-born:
100.0% (60)
White alone - Speak only English Native:
98.7% (3,222)Foreign-born:
38.8% (145)
White alone - Speak another language Native:
1.9% (62)Foreign-born:
61.1% (229)
Hispanic or Latino - Speak another language Native:
66.7% (613)Foreign-born:
98.3% (373)
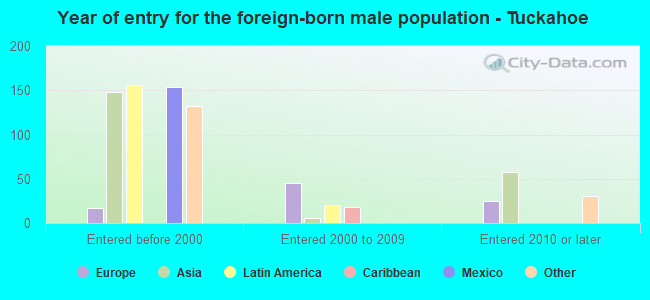
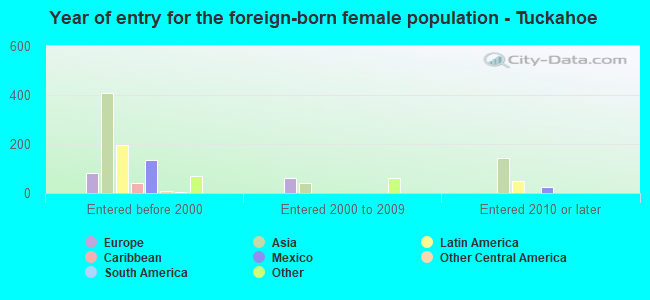
Foreign-born residents in Tuckahoe 1,735 residents are foreign born (11.8% Asia , 6.0% Latin America , 4.0% Africa , 3.2% Europe ).
This city:
25.0%New York:
22.6%
Marital status for residents in Tuckahoe Marital status - White (Caucasian) population 15 years and over
Males 36.0% Never married52.7% Now married0.0% Separated6.0% Widowed5.2% DivorcedFemales 20.6% Never married47.6% Now married1.5% Separated16.2% Widowed14.2% DivorcedWomen who gave birth in the past 12 months Now married:
100.0% (24)Unmarried:
0.0% (0)
Women who did not give birth in the past 12 months Now married:
43.3% (179)Unmarried:
56.7% (235)
Marital status - Black or African American population 15 years and over
Males 25.4% Never married74.6% Now married0.0% Separated0.0% Widowed0.0% DivorcedFemales 12.6% Never married49.2% Now married18.3% Separated0.0% Widowed19.9% DivorcedWomen who did not give birth in the past 12 months Now married:
63.0% (45)Unmarried:
37.0% (26)
Marital status - Asian population 15 years and over
Males 16.0% Never married84.0% Now married0.0% Separated0.0% Widowed0.0% DivorcedFemales 66.8% Never married32.0% Now married0.0% Separated1.2% Widowed0.0% DivorcedWomen who did not give birth in the past 12 months Now married:
27.3% (148)Unmarried:
72.7% (394)
Marital status - Other race population 15 years and over
Males 35.0% Never married29.4% Now married6.2% Separated0.0% Widowed29.4% DivorcedFemales 63.3% Never married33.9% Now married0.0% Separated0.0% Widowed2.9% DivorcedWomen who gave birth in the past 12 months Now married:
0.0% (0)Unmarried:
100.0% (25)
Women who did not give birth in the past 12 months Now married:
21.8% (69)Unmarried:
78.2% (248)
Marital status - Two or more races population 15 years and over
Males 100.0% Never married0.0% Now married0.0% Separated0.0% Widowed0.0% DivorcedFemales 26.3% Never married68.1% Now married0.0% Separated5.6% Widowed0.0% DivorcedWomen who did not give birth in the past 12 months Now married:
65.0% (132)Unmarried:
35.0% (71)
Marital status - White alone, not Hispanic / Latino population 15 years and over
Males 34.7% Never married53.8% Now married0.0% Separated6.2% Widowed5.3% DivorcedFemales 20.3% Never married47.3% Now married1.6% Separated16.9% Widowed14.0% DivorcedWomen who gave birth in the past 12 months Now married:
100.0% (26)Unmarried:
0.0% (0)
Women who did not give birth in the past 12 months Now married:
43.4% (167)Unmarried:
56.6% (218)
Marital status - Hispanic or Latino population 15 years and over
Males 45.5% Never married24.6% Now married5.2% Separated0.0% Widowed24.6% DivorcedFemales 48.3% Never married47.4% Now married0.0% Separated0.0% Widowed4.3% DivorcedWomen who gave birth in the past 12 months Now married:
0.0% (0)Unmarried:
100.0% (22)
Women who did not give birth in the past 12 months Now married:
35.7% (151)Unmarried:
64.3% (271)
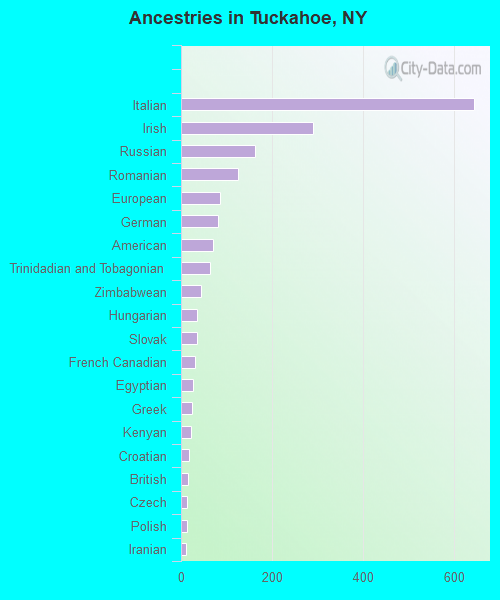
Ancestries in Tuckahoe
645 17.5% Italian290 7.9% Irish163 4.4% Russian125 3.4% Romanian85 2.3% European82 2.2% German70 1.9% American64 1.7% Trinidadian and Tobagonian45 1.2% Zimbabwean36 1.0% Hungarian35 0.9% Slovak31 0.8% French Canadian27 0.7% Egyptian25 0.7% Greek21 0.6% Kenyan18 0.5% Croatian16 0.4% British13 0.4% Czech13 0.4% Polish12 0.3% Iranian5 0.1% British West Indian
Children Nativity (place of birth) in Tuckahoe
Children under 6 years - Living with two parents Both parents native 237 100.0% NativeBoth parents foreign-born 39 100.0% Foreign-bornOne native, one foreign-born parent 104 81.9% Native23 18.1% Foreign-bornChildren under 6 years - Living with one parent Native parent 28 100.0% NativeChildren 6 to 17 years - Living with two parents Both parents native 367 100.0% NativeBoth parents foreign-born 183 86.9% Native27 13.1% Foreign-bornOne native, one foreign-born parent 38 100.0% NativeChildren 6 to 17 years - Living with one parent Native parent 121 100.0% NativeForeign-born parent 49 51.2% Native46 48.8% Foreign-born