Races in Watervliet, New York (NY) Detailed Stats
Data:
Races - White alone (%)
Races - White alone (% change since 2000)
Races - Black alone (%)
Races - Black alone (% change since 2000)
Races - American Indian alone (%)
Races - American Indian alone (% change since 2000)
Races - Asian alone (%)
Races - Asian alone (% change since 2000)
Races - Hispanic (%)
Races - Hispanic (% change since 2000)
Races - Native Hawaiian and Other Pacific Islander alone (%)
Races - Native Hawaiian and Other Pacific Islander alone (% change since 2000)
Races - Two or more races(%)
Races - Two or more races(% change since 2000)
Races - Other race alone (%)
Races - Other race alone (% change since 2000)
Racial diversity
Place of birth - Born in state of residence (%)
Place of birth - Born in state of residence (%) - White
Place of birth - Born in state of residence (%) - Black or African American
Place of birth - Born in state of residence (%) - Asian
Place of birth - Born in state of residence (%) - Hispanic or Latino
Place of birth - Born in state of residence (%) - American Indian and Alaska Native
Place of birth - Born in state of residence (%) - Multirace
Place of birth - Born in state of residence (%) - Other Race
Place of birth - Born in other state (%)
Place of birth - Born in other state (%) - White
Place of birth - Born in other state (%) - Black or African American
Place of birth - Born in other state (%) - Asian
Place of birth - Born in other state (%) - Hispanic or Latino
Place of birth - Born in other state (%) - American Indian and Alaska Native
Place of birth - Born in other state (%) - Multirace
Place of birth - Born in other state (%) - Other Race
Place of birth - Native, outside of US (%)
Place of birth - Native, outside of US (%) - White
Place of birth - Native, outside of US (%) - Black or African American
Place of birth - Native, outside of US (%) - Asian
Place of birth - Native, outside of US (%) - Hispanic or Latino
Place of birth - Native, outside of US (%) - American Indian and Alaska Native
Place of birth - Native, outside of US (%) - Multirace
Place of birth - Native, outside of US (%) - Other Race
Place of birth - Foreign born (%)
Place of birth - Foreign born (%) - White
Place of birth - Foreign born (%) - Black or African American
Place of birth - Foreign born (%) - Asian
Place of birth - Foreign born (%) - Hispanic or Latino
Place of birth - Foreign born (%) - American Indian and Alaska Native
Place of birth - Foreign born (%) - Multirace
Place of birth - Foreign born (%) - Other Race
Residents speaking English at home (%)
Residents speaking English at home - Born in the United States (%)
Residents speaking English at home - Native, born elsewhere (%)
Residents speaking English at home - Foreign born (%)
Residents speaking Spanish at home (%)
Residents speaking Spanish at home - Born in the United States (%)
Residents speaking Spanish at home - Native, born elsewhere (%)
Residents speaking Spanish at home - Foreign born (%)
Residents speaking other language at home (%)
Residents speaking other language at home - Born in the United States (%)
Residents speaking other language at home - Native, born elsewhere (%)
Residents speaking other language at home - Foreign born (%)
Marital status - Never married (%)
Marital status - Now married (%)
Marital status - Separated (%)
Marital status - Widowed (%)
Marital status - Divorced (%)
Ancestries Reported - Arab (%)
Ancestries Reported - Czech (%)
Ancestries Reported - Danish (%)
Ancestries Reported - Dutch (%)
Ancestries Reported - English (%)
Ancestries Reported - French (%)
Ancestries Reported - French Canadian (%)
Ancestries Reported - German (%)
Ancestries Reported - Greek (%)
Ancestries Reported - Hungarian (%)
Ancestries Reported - Irish (%)
Ancestries Reported - Italian (%)
Ancestries Reported - Lithuanian (%)
Ancestries Reported - Norwegian (%)
Ancestries Reported - Polish (%)
Ancestries Reported - Portuguese (%)
Ancestries Reported - Russian (%)
Ancestries Reported - Scotch-Irish (%)
Ancestries Reported - Scottish (%)
Ancestries Reported - Slovak (%)
Ancestries Reported - Subsaharan African (%)
Ancestries Reported - Swedish (%)
Ancestries Reported - Swiss (%)
Ancestries Reported - Ukrainian (%)
Ancestries Reported - United States (%)
Ancestries Reported - Welsh (%)
Ancestries Reported - West Indian (%)
Ancestries Reported - Other (%)
Geographical mobility - Same house 1 year ago (%)
Geographical mobility - Same house 1 year ago (%) - White
Geographical mobility - Same house 1 year ago (%) - Black or African American
Geographical mobility - Same house 1 year ago (%) - Asian
Geographical mobility - Same house 1 year ago (%) - Hispanic or Latino
Geographical mobility - Same house 1 year ago (%) - American Indian and Alaska Native
Geographical mobility - Same house 1 year ago (%) - Multirace
Geographical mobility - Same house 1 year ago (%) - Other Race
Geographical mobility - Moved within same county (%)
Geographical mobility - Moved within same county (%) - White
Geographical mobility - Moved within same county (%) - Black or African American
Geographical mobility - Moved within same county (%) - Asian
Geographical mobility - Moved within same county (%) - Hispanic or Latino
Geographical mobility - Moved within same county (%) - American Indian and Alaska Native
Geographical mobility - Moved within same county (%) - Multirace
Geographical mobility - Moved within same county (%) - Other Race
Geographical mobility - Moved from different county within same state (%)
Geographical mobility - Moved from different county within same state (%) - White
Geographical mobility - Moved from different county within same state (%) - Black or African American
Geographical mobility - Moved from different county within same state (%) - Asian
Geographical mobility - Moved from different county within same state (%) - Hispanic or Latino
Geographical mobility - Moved from different county within same state (%) - American Indian and Alaska Native
Geographical mobility - Moved from different county within same state (%) - Multirace
Geographical mobility - Moved from different county within same state (%) - Other Race
Geographical mobility - Moved from different state (%)
Geographical mobility - Moved from different state (%) - White
Geographical mobility - Moved from different state (%) - Black or African American
Geographical mobility - Moved from different state (%) - Asian
Geographical mobility - Moved from different state (%) - Hispanic or Latino
Geographical mobility - Moved from different state (%) - American Indian and Alaska Native
Geographical mobility - Moved from different state (%) - Multirace
Geographical mobility - Moved from different state (%) - Other Race
Geographical mobility - Moved from abroad (%)
Geographical mobility - Moved from abroad (%) - White
Geographical mobility - Moved from abroad (%) - Black or African American
Geographical mobility - Moved from abroad (%) - Asian
Geographical mobility - Moved from abroad (%) - Hispanic or Latino
Geographical mobility - Moved from abroad (%) - American Indian and Alaska Native
Geographical mobility - Moved from abroad (%) - Multirace
Geographical mobility - Moved from abroad (%) - Other Race
Place of birth for the foreign-born population - Ireland (%)
Place of birth for the foreign-born population - Denmark (%)
Place of birth for the foreign-born population - Norway (%)
Place of birth for the foreign-born population - Sweden (%)
Place of birth for the foreign-born population - United Kingdom (%)
Place of birth for the foreign-born population - England (%)
Place of birth for the foreign-born population - Scotland (%)
Place of birth for the foreign-born population - Other Northern Europe (%)
Place of birth for the foreign-born population - Austria (%)
Place of birth for the foreign-born population - Belgium (%)
Place of birth for the foreign-born population - France (%)
Place of birth for the foreign-born population - Germany (%)
Place of birth for the foreign-born population - Netherlands (%)
Place of birth for the foreign-born population - Switzerland (%)
Place of birth for the foreign-born population - Other Western Europe (%)
Place of birth for the foreign-born population - Greece (%)
Place of birth for the foreign-born population - Italy (%)
Place of birth for the foreign-born population - Portugal (%)
Place of birth for the foreign-born population - Spain (%)
Place of birth for the foreign-born population - Other Southern Europe (%)
Place of birth for the foreign-born population - Albania (%)
Place of birth for the foreign-born population - Belarus (%)
Place of birth for the foreign-born population - Bosnia and Herzegovina (%)
Place of birth for the foreign-born population - Bulgaria (%)
Place of birth for the foreign-born population - Croatia (%)
Place of birth for the foreign-born population - Czechoslovakia (%)
Place of birth for the foreign-born population - Hungary (%)
Place of birth for the foreign-born population - Latvia (%)
Place of birth for the foreign-born population - Lithuania (%)
Place of birth for the foreign-born population - North Macedonia (Macedonia) (%)
Place of birth for the foreign-born population - Moldova (%)
Place of birth for the foreign-born population - Poland (%)
Place of birth for the foreign-born population - Romania (%)
Place of birth for the foreign-born population - Russia (%)
Place of birth for the foreign-born population - Serbia (%)
Place of birth for the foreign-born population - Ukraine (%)
Place of birth for the foreign-born population - Other Eastern Europe (%)
Place of birth for the foreign-born population - China (%)
Place of birth for the foreign-born population - Hong Kong (%)
Place of birth for the foreign-born population - Taiwan (%)
Place of birth for the foreign-born population - Japan (%)
Place of birth for the foreign-born population - Korea (%)
Place of birth for the foreign-born population - Other Eastern Asia (%)
Place of birth for the foreign-born population - Afghanistan (%)
Place of birth for the foreign-born population - Bangladesh (%)
Place of birth for the foreign-born population - India (%)
Place of birth for the foreign-born population - Iran (%)
Place of birth for the foreign-born population - Kazakhstan (%)
Place of birth for the foreign-born population - Nepal (%)
Place of birth for the foreign-born population - Pakistan (%)
Place of birth for the foreign-born population - Sri Lanka (%)
Place of birth for the foreign-born population - Uzbekistan (%)
Place of birth for the foreign-born population - Other South Central Asia (%)
Place of birth for the foreign-born population - Burma (%)
Place of birth for the foreign-born population - Cambodia (%)
Place of birth for the foreign-born population - Indonesia (%)
Place of birth for the foreign-born population - Laos (%)
Place of birth for the foreign-born population - Malaysia (%)
Place of birth for the foreign-born population - Philippines (%)
Place of birth for the foreign-born population - Singapore (%)
Place of birth for the foreign-born population - Thailand (%)
Place of birth for the foreign-born population - Vietnam (%)
Place of birth for the foreign-born population - Other South Eastern Asia (%)
Place of birth for the foreign-born population - Armenia (%)
Place of birth for the foreign-born population - Iraq (%)
Place of birth for the foreign-born population - Israel (%)
Place of birth for the foreign-born population - Jordan (%)
Place of birth for the foreign-born population - Kuwait (%)
Place of birth for the foreign-born population - Lebanon (%)
Place of birth for the foreign-born population - Saudi Arabia (%)
Place of birth for the foreign-born population - Syria (%)
Place of birth for the foreign-born population - Turkey (%)
Place of birth for the foreign-born population - Yemen (%)
Place of birth for the foreign-born population - Other Western Asia (%)
Place of birth for the foreign-born population - Eritrea (%)
Place of birth for the foreign-born population - Ethiopia (%)
Place of birth for the foreign-born population - Kenya (%)
Place of birth for the foreign-born population - Somalia (%)
Place of birth for the foreign-born population - Uganda (%)
Place of birth for the foreign-born population - Zimbabwe (%)
Place of birth for the foreign-born population - Other Eastern Africa (%)
Place of birth for the foreign-born population - Cameroon (%)
Place of birth for the foreign-born population - Congo (%)
Place of birth for the foreign-born population - Democratic Republic of Congo (Zaire) (%)
Place of birth for the foreign-born population - Other Middle Africa (%)
Place of birth for the foreign-born population - Egypt (%)
Place of birth for the foreign-born population - Morocco (%)
Place of birth for the foreign-born population - Sudan (%)
Place of birth for the foreign-born population - Other Northern Africa (%)
Place of birth for the foreign-born population - South Africa (%)
Place of birth for the foreign-born population - Other Southern Africa (%)
Place of birth for the foreign-born population - Cabo Verde (%)
Place of birth for the foreign-born population - Ghana (%)
Place of birth for the foreign-born population - Liberia (%)
Place of birth for the foreign-born population - Nigeria (%)
Place of birth for the foreign-born population - Senegal (%)
Place of birth for the foreign-born population - Sierra Leone (%)
Place of birth for the foreign-born population - Other Western Africa (%)
Place of birth for the foreign-born population - Australia (%)
Place of birth for the foreign-born population - New Zealand (%)
Place of birth for the foreign-born population - Fiji (%)
Place of birth for the foreign-born population - Micronesia (%)
Place of birth for the foreign-born population - Bahamas (%)
Place of birth for the foreign-born population - Barbados (%)
Place of birth for the foreign-born population - Cuba (%)
Place of birth for the foreign-born population - Dominica (%)
Place of birth for the foreign-born population - Dominican Republic (%)
Place of birth for the foreign-born population - Grenada (%)
Place of birth for the foreign-born population - Haiti (%)
Place of birth for the foreign-born population - Jamaica (%)
Place of birth for the foreign-born population - St. Vincent and the Grenadines (%)
Place of birth for the foreign-born population - Trinidad and Tobago (%)
Place of birth for the foreign-born population - West Indies (%)
Place of birth for the foreign-born population - Other Caribbean (%)
Place of birth for the foreign-born population - Belize (%)
Place of birth for the foreign-born population - Costa Rica (%)
Place of birth for the foreign-born population - El Salvador (%)
Place of birth for the foreign-born population - Guatemala (%)
Place of birth for the foreign-born population - Honduras (%)
Place of birth for the foreign-born population - Mexico (%)
Place of birth for the foreign-born population - Nicaragua (%)
Place of birth for the foreign-born population - Panama (%)
Place of birth for the foreign-born population - Other Central America (%)
Place of birth for the foreign-born population - Argentina (%)
Place of birth for the foreign-born population - Bolivia (%)
Place of birth for the foreign-born population - Brazil (%)
Place of birth for the foreign-born population - Chile (%)
Place of birth for the foreign-born population - Colombia (%)
Place of birth for the foreign-born population - Ecuador (%)
Place of birth for the foreign-born population - Guyana (%)
Place of birth for the foreign-born population - Peru (%)
Place of birth for the foreign-born population - Uruguay (%)
Place of birth for the foreign-born population - Venezuela (%)
Place of birth for the foreign-born population - Other South America (%)
Place of birth for the foreign-born population - Canada (%)
Place of birth for the foreign-born population - Other Northern America (%)
Place of birth for the foreign-born population - Other (%)
Latest news about races in Watervliet, NY collected exclusively by city-data.com from local newspapers, TV, and radio stations
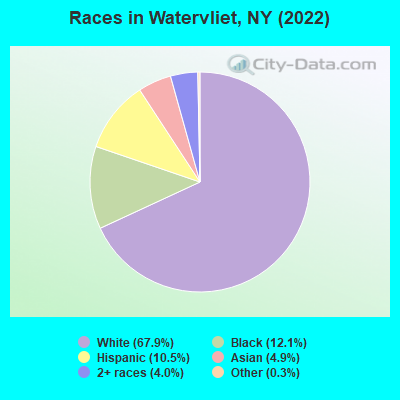
According to 2022 data, the most numerous races in Watervliet, NY are White alone (7,023 residents), Hispanic (1,084 residents), and Black alone (1,249 residents). 89.1% of Watervliet residents speak English at home. 8.3% of Watervliet, NY residents are foreign-born (4.3% born in Asia, 2.2% born in Latin America, 1.3% born in Africa), which is 164.8% less than the foreign-born rate of 22.0% across the entire state of New York.
Race distribution in Watervliet
2000 2022
11,760,981 62.0% White alone 2,867,583 15.1% Hispanic 2,812,623 14.8% Black alone 1,035,926 5.5% Asian alone 366,116 1.9% Two or more races 75,499 0.4% Other race alone 52,499 0.3% American Indian alone 5,230 0.03% Native Hawaiian and Other
10,408,933 52.9% White alone 3,867,299 19.7% Hispanic 2,633,840 13.4% Black alone 1,776,286 9.0% Asian alone 732,670 3.7% Two or more races 216,110 1.1% Other race alone 35,082 0.2% American Indian alone 6,931 0.04% Native Hawaiian and Other
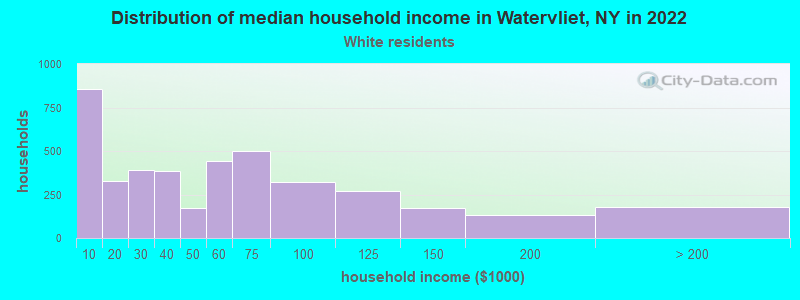
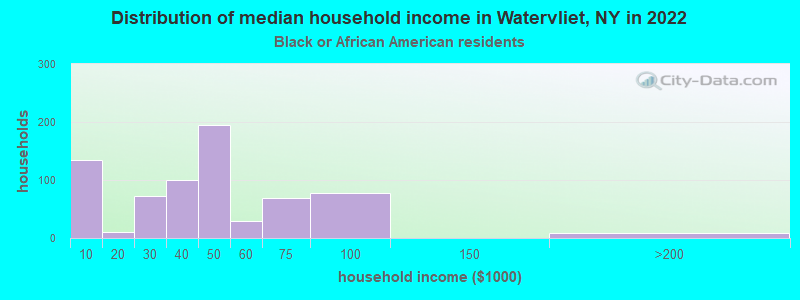
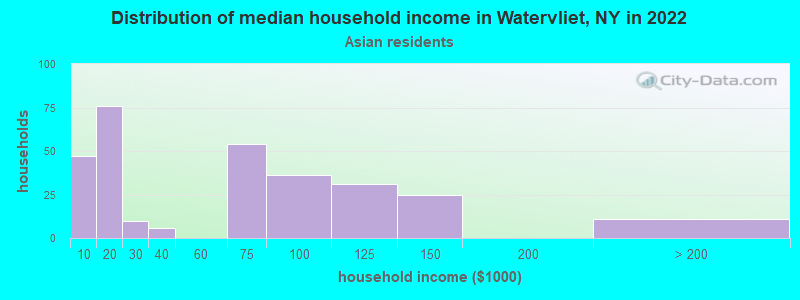
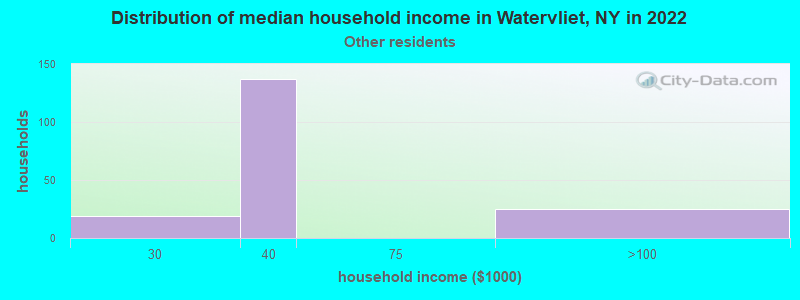
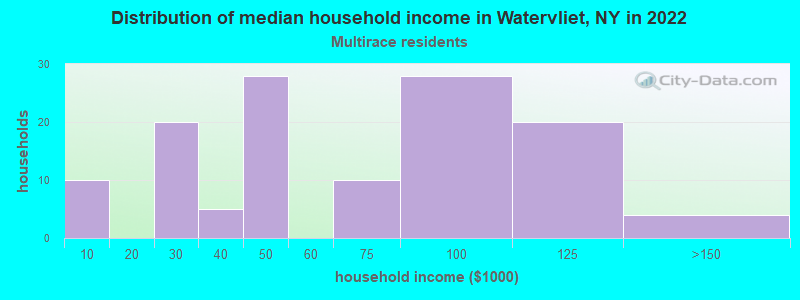
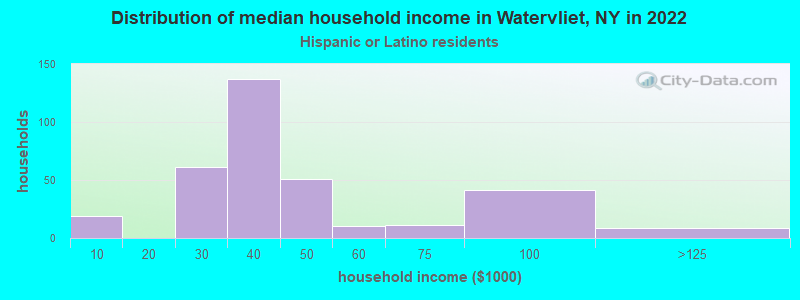
Income and house value in Watervliet Median household income in 2022 $52,017 White non-Hispanic householders$43,824 Black householders$34,260 Some other race householders$26,591 Hispanic or Latino race householdersMedian 2022 house value $171,055 White Non-Hispanic householders$172,271 Black or African American householders$184,026 American Indian or Alaska Native householders$65,868 Two or more races householders
Median age by race in Watervliet
42.5 Median age for White residents46.4 41.6 36.4 Median age for Black or African American residents29.0 44.6 -721,435,315.6 Median age for American Indian / Alaska Native residents-645,669,290.7 -642,115,202.4 25.5 Median age for Asian residents24.3 29.1 -487,992,314.6 Median age for Native Hawaiian / Pacific Islander residents-477,502,295.2 -497,387,669.3 10.3 Median age for Other race residents2.8 16.2 24.0 Median age for Two or more races residents27.7 14.9 44.4 Median age for White alone residents46.8 41.5 23.2 Median age for Hispanic or Latino residents17.6 34.1
Owner/renter occupied households by race in Watervliet
House owners and renters - White residents 1,399 34.5% Owner occupied2,655 65.5% Renter occupiedHouse owners and renters - Black or African American residents 40 5.5% Owner occupied697 94.5% Renter occupiedHouse owners and renters - Asian residents 61 22.1% Owner occupied215 77.9% Renter occupiedHouse owners and renters - Other race residents 26 11.9% Owner occupied196 88.1% Renter occupiedHouse owners and renters - Two or more races residents 91 53.3% Owner occupied80 46.7% Renter occupiedHouse owners and renters - White alone residents 1,413 35.2% Owner occupied2,598 64.8% Renter occupiedHouse owners and renters - Hispanic or Latino residents 48 13.8% Owner occupied300 86.2% Renter occupied
Language usage in Watervliet
English speakers - Total 89.1% of residents of Watervliet speak English at home.
4.1% of residents speak Spanish at home 282 70.7% Speak English very well117 29.3% Speak English less than very well6.3% of residents speak other language at home 266 43.4% Speak English very well347 56.6% Speak English less than very well
English speakers - Born in the United States 91.9% of residents of Watervliet speak English at home.
3.9% of residents speak Spanish at home 40 100.0% Speak English very well4.4% of residents speak other language at home 45 100.0% Speak English very well
English speakers - Native, born elsewhere 0.0% of residents of Watervliet speak English at home.
75.9% of residents speak Spanish at home 63 100.0% Speak English less than very well
English speakers - Foreign-born 23.0% of residents of Watervliet speak English at home.
12.9% of residents speak Spanish at home 74 70.5% Speak English very well31 29.5% Speak English less than very well58.0% of residents speak other language at home 152 32.3% Speak English very well319 67.7% Speak English less than very well
White (Caucasian) - Speak only English Native:
99.1% (6,694)Foreign-born:
39.3% (53)
White (Caucasian) - Speak another language Native:
1.0% (65)Foreign-born:
62.3% (84)
Black or African American - Speak only English Native:
97.2% (1,080)Foreign-born:
62.6% (82)
Black or African American - Speak another language Native:
1.9% (22)Foreign-born:
84.1% (109)
Asian - Speak only English Native:
37.0% (17)Foreign-born:
11.0% (44)
Asian - Speak another language Native:
63.5% (30)Foreign-born:
82.2% (332)
Other race - Speak only English Native:
56.6% (349)Foreign-born:
13.6% (4)
Other race - Speak another language Native:
43.7% (269)Foreign-born:
83.9% (27)
Two or more races - Speak another language Native:
18.8% (78)Foreign-born:
100.0% (78)
White alone - Speak only English Native:
99.1% (6,504)Foreign-born:
37.4% (55)
White alone - Speak another language Native:
0.7% (47)Foreign-born:
63.4% (93)
Hispanic or Latino - Speak only English Native:
69.2% (592)Foreign-born:
6.4% (6)
Hispanic or Latino - Speak another language Native:
30.9% (264)Foreign-born:
100.0% (100)
Foreign-born residents in Watervliet 860 residents are foreign born (4.3% Asia , 2.2% Latin America , 1.3% Africa ).
This city:
8.3%New York:
22.6%
Marital status for residents in Watervliet Marital status - White (Caucasian) population 15 years and over
Males 43.9% Never married36.0% Now married2.9% Separated6.8% Widowed10.5% DivorcedFemales 44.3% Never married33.3% Now married1.9% Separated9.5% Widowed11.0% DivorcedWomen who gave birth in the past 12 months Now married:
0.0% (0)Unmarried:
100.0% (83)
Women who did not give birth in the past 12 months Now married:
24.1% (358)Unmarried:
75.9% (1,126)
Marital status - Black or African American population 15 years and over
Males 53.4% Never married25.6% Now married0.0% Separated0.0% Widowed21.1% DivorcedFemales 57.0% Never married18.9% Now married1.3% Separated5.0% Widowed17.9% DivorcedWomen who gave birth in the past 12 months Now married:
0.0% (0)Unmarried:
100.0% (45)
Women who did not give birth in the past 12 months Now married:
27.5% (90)Unmarried:
72.5% (238)
Marital status - Asian population 15 years and over
Males 83.6% Never married16.4% Now married0.0% Separated0.0% Widowed0.0% DivorcedFemales 60.7% Never married34.3% Now married0.0% Separated0.0% Widowed5.0% DivorcedWomen who gave birth in the past 12 months Now married:
100.0% (17)Unmarried:
0.0% (0)
Women who did not give birth in the past 12 months Now married:
3.3% (2)Unmarried:
96.7% (60)
Marital status - Other race population 15 years and over
Males 18.0% Never married44.0% Now married0.0% Separated0.0% Widowed38.0% DivorcedFemales 76.8% Never married23.2% Now married0.0% Separated0.0% Widowed0.0% DivorcedWomen who did not give birth in the past 12 months Now married:
7.9% (13)Unmarried:
92.1% (153)
Marital status - Two or more races population 15 years and over
Males 67.4% Never married0.0% Now married0.0% Separated4.7% Widowed27.9% DivorcedFemales 54.5% Never married10.0% Now married5.0% Separated23.0% Widowed7.5% DivorcedWomen who did not give birth in the past 12 months Now married:
25.6% (33)Unmarried:
74.4% (95)
Marital status - White alone, not Hispanic / Latino population 15 years and over
Males 43.3% Never married35.9% Now married3.0% Separated7.0% Widowed10.8% DivorcedFemales 42.1% Never married34.4% Now married2.0% Separated10.0% Widowed11.5% DivorcedWomen who gave birth in the past 12 months Now married:
0.0% (0)Unmarried:
100.0% (84)
Women who did not give birth in the past 12 months Now married:
25.6% (364)Unmarried:
74.4% (1,056)
Marital status - Hispanic or Latino population 15 years and over
Males 62.9% Never married23.4% Now married0.0% Separated0.0% Widowed13.7% DivorcedFemales 73.5% Never married12.5% Now married2.2% Separated8.5% Widowed3.3% DivorcedWomen who did not give birth in the past 12 months Now married:
7.4% (24)Unmarried:
92.6% (308)
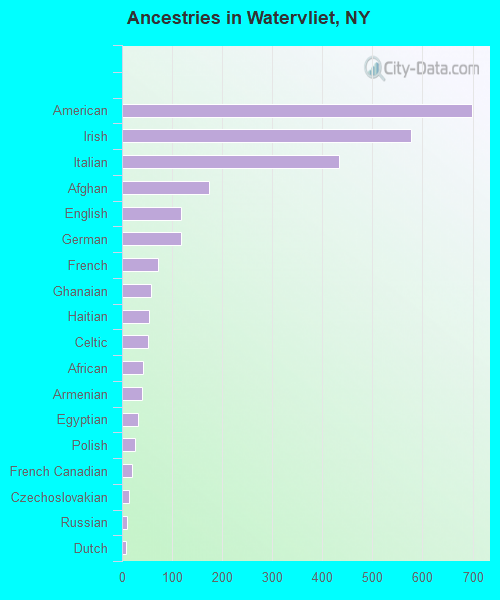
Ancestries in Watervliet
698 17.0% American578 14.1% Irish433 10.6% Italian173 4.2% Afghan118 2.9% English117 2.9% German71 1.7% French57 1.4% Ghanaian54 1.3% Haitian52 1.3% Celtic41 1.0% African39 1.0% Armenian32 0.8% Egyptian25 0.6% Polish19 0.5% French Canadian13 0.3% Czechoslovakian9 0.2% Russian8 0.2% Dutch4 0.10% Norwegian
Children Nativity (place of birth) in Watervliet
Children under 6 years - Living with two parents Both parents native 87 100.0% NativeBoth parents foreign-born 35 100.0% NativeChildren under 6 years - Living with one parent Native parent 538 100.0% NativeChildren 6 to 17 years - Living with two parents Both parents native 283 100.0% NativeBoth parents foreign-born 66 68.1% Native31 31.9% Foreign-bornOne native, one foreign-born parent 44 100.0% NativeChildren 6 to 17 years - Living with one parent Native parent 589 100.0% Native
Grandparents responsible for own grandchildren in Watervliet
Grandparents (30 to 59 years) White / Caucasian 3 100.0% Not responsible for grandchildrenWhite alone, not Hispanic / Latino 4 100.0% Not responsible for grandchildrenGrandparents (60 years and over) White / Caucasian 24 34.9% Responsible for grandchildren45 65.1% Not responsible for grandchildrenWhite alone, not Hispanic / Latino 26 35.1% Responsible for grandchildren48 64.9% Not responsible for grandchildren