Berkeley County, South Carolina (SC)
County owner-occupied free and clear houses and condos in 2010: 12,922
County owner-occupied houses and condos in 2000: 37,042
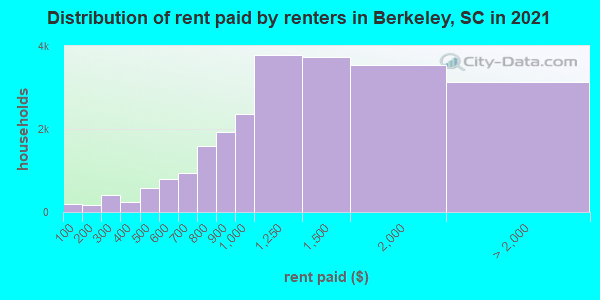
Renter-occupied apartments: 18,038 (it was 12,880 in 2000)
| % of renters here: | 26% |
| State: | 31% |
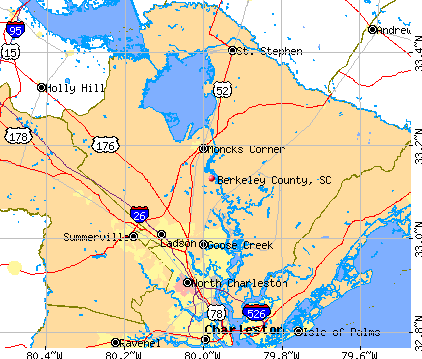
Land area: 1098 sq. mi.
Water area: 130.4 sq. mi.
Population density: 223 people per square mile (high).
Industries providing employment: Educational, health and social services (18.1%), Professional, scientific, management, administrative, and waste management services (13.4%), Manufacturing (12.5%), Retail trade (11.1%).
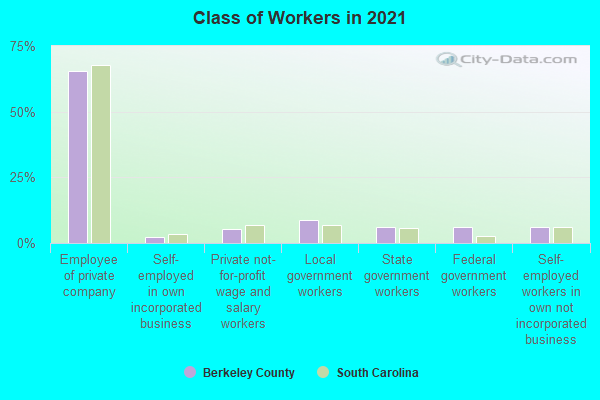
Type of workers:
- Private wage or salary: 72%
- Government: 23%
- Self-employed, not incorporated: 5%
- Unpaid family work: 0%
- OSM Map
- General Map
- Google Map
- MSN Map

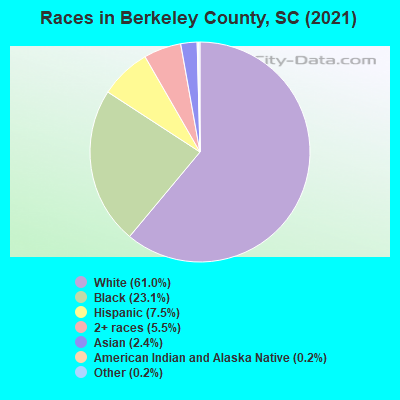
- 149,53261.0%White Non-Hispanic Alone
- 55,96022.8%Black Non-Hispanic Alone
- 18,9627.7%Hispanic or Latino
- 13,8875.7%Two or more races
- 5,1602.1%Asian alone
- 9510.4%Some other race alone
- 4200.2%American Indian and Alaska Native alone
- 2450.10%Native Hawaiian and Other
Pacific Islander alone
| Median resident age: | 37.1 years |
| South Carolina median age: | 40.5 years |
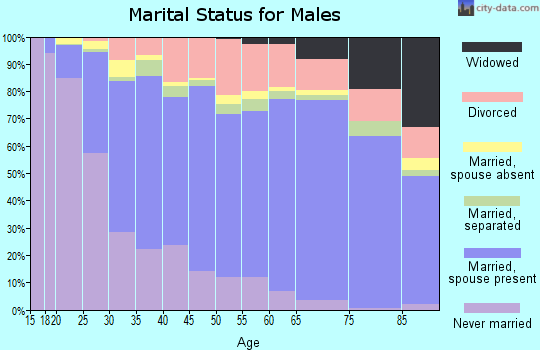
| Males: 122,077 | |
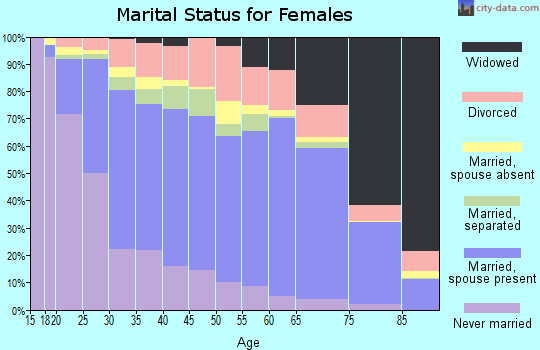
| Females: 123,040 |

 | Charleston Metro Area Construction (5175 replies) |
| U.S. Census Bureau’s Estimates of Increases in SC’s MSA Population 2022-2023 (48 replies) |
| 2020 SC Census Number (360 replies) |
| SC was the fastest growing state in 2023 (by %) (33 replies) |
| South Carolina 10 year growth changes (157 replies) |
| 2019 Berkeley County SC Tax Assessments HUGE increase (7 replies) |
| Berkeley County: | 2.0 people |
| South Carolina: | 2 people |
Estimated median household income in 2022: $80,185 ($39,908 in 1999)
| This county: | $80,185 |
| South Carolina: | $64,115 |
Median contract rent in 2022 for apartments: $1,400 (lower quartile is $1,114, upper quartile is $1,820)
| This county: | $1400 |
| State: | $893 |
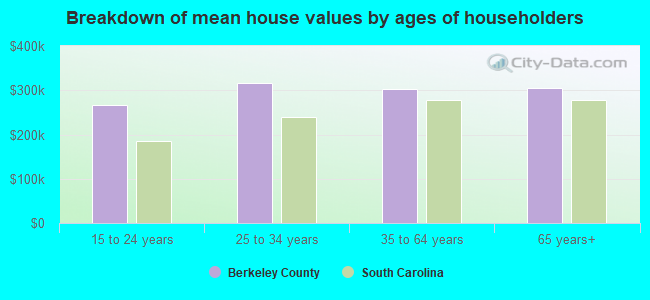
Estimated median house or condo value in 2022: $303,900 (it was $79,900 in 2000)
| Berkeley: | $303,900 |
| South Carolina: | $254,600 |
Mean price in 2022:
Median monthly housing costs for homes and condos with a mortgage: $1,482Detached houses: $400,929
Here: $400,929 State: $368,255 Townhouses or other attached units: $296,022
Here: $296,022 State: $292,023 In 2-unit structures: $254,636
Here: $254,636 State: $358,283 In 3-to-4-unit structures: $205,372
Here: $205,372 State: $230,702 In 5-or-more-unit structures: $444,542
Here: $444,542 State: $326,361 Mobile homes: $145,256
Here: $145,256 State: $102,531 Occupied boats, RVs, vans, etc.: $835,407
Here: $835,407 State: $132,484
Median monthly housing costs for units without a mortgage: $447
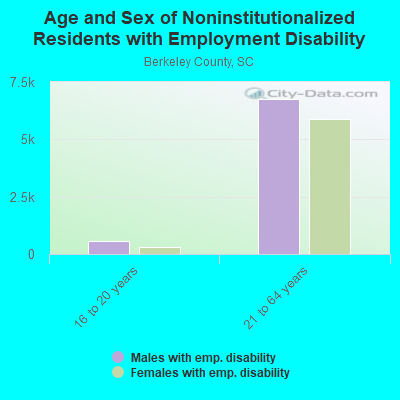
Institutionalized population: 1,347
Crime in 2021 (reported by the sheriff's office or county police, not the county total):
- Murders: 11
- Rapes: 38
- Robberies: 31
- Assaults: 359
- Burglaries: 350
- Thefts: 1374
- Auto thefts: 261
Crime in 2020 (reported by the sheriff's office or county police, not the county total):
- Murders: 13
- Rapes: 40
- Robberies: 63
- Assaults: 343
- Burglaries: 481
- Thefts: 1663
- Auto thefts: 299
Health of residents in Berkeley County based on CDC Behavioral Risk Factor Surveillance System Survey Questionnaires from 2013 to 2021:
General health status score of residents in this county from 1 (poor) to 5 (excellent) is 3.5. This is about average.73.6% of residents exercised in the past month. This is about average.
44.8% of residents smoked 100+ cigarettes in their lives. This is about average.
54.1% of adult residents drank alcohol in the past 30 days. This is less than average.
66.7% of residents visited a dentist within the past year. This is less than average.
Average weight of males is 198 pounds. This is about average.
Average weight of females is 165 pounds. This is about average.
Health of residents in Berkeley County based on CDC Behavioral Risk Factor Surveillance System Survey Questionnaires from 2003 to 2012:
General health status score of residents in this county from 1 (poor) to 5 (excellent) is 3.3. This is worse than average.69.7% of residents exercised in the past month. This is less than average.
47.2% of residents smoked 100+ cigarettes in their lives. This is about average.
98.5% of adult residents drank alcohol in the past 30 days. This is more than average.
63.1% of residents visited a dentist within the past year. This is less than average.
Average weight of males is 200 pounds. This is more than average.
Average weight of females is 169 pounds. This is more than average.
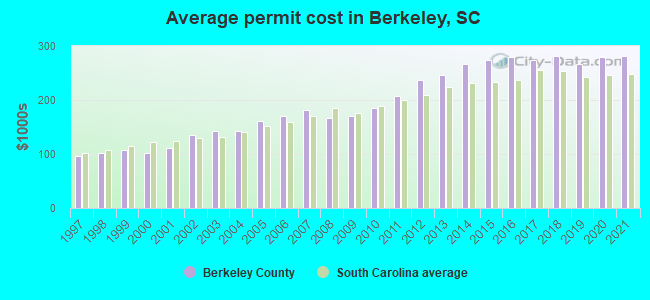
Single-family new house construction building permits:
- 2022: 2035 buildings, average cost: $324,000
- 2021: 1989 buildings, average cost: $280,900
- 2020: 1892 buildings, average cost: $279,400
- 2019: 1605 buildings, average cost: $266,600
- 2018: 1606 buildings, average cost: $282,000
- 2017: 1429 buildings, average cost: $274,900
- 2016: 1445 buildings, average cost: $280,000
- 2015: 1377 buildings, average cost: $274,700
- 2014: 1262 buildings, average cost: $266,200
- 2013: 1099 buildings, average cost: $245,500
- 2012: 877 buildings, average cost: $236,600
- 2011: 870 buildings, average cost: $207,400
- 2010: 1086 buildings, average cost: $185,800
- 2009: 1130 buildings, average cost: $169,900
- 2008: 1328 buildings, average cost: $166,300
- 2007: 1738 buildings, average cost: $181,800
- 2006: 1976 buildings, average cost: $170,300
- 2005: 1786 buildings, average cost: $160,900
- 2004: 1530 buildings, average cost: $142,900
- 2003: 1049 buildings, average cost: $142,000
- 2002: 935 buildings, average cost: $136,000
- 2001: 720 buildings, average cost: $112,400
- 2000: 556 buildings, average cost: $100,700
- 1999: 682 buildings, average cost: $107,500
- 1998: 531 buildings, average cost: $100,500
- 1997: 470 buildings, average cost: $96,500

Median real estate property taxes paid for housing units with mortgages in 2022: $1,448 (0.4%)
Median real estate property taxes paid for housing units with no mortgage in 2022: $974 (0.4%)


| Berkeley County: | 7.8% |
| South Carolina: | 14.0% |
Median age of residents in 2022: 37.1 years old
(Males: 36.2 years old, Females: 38.2 years old)
(Median age for: White residents: 39.6 years old, Black residents: 36.1 years old, American Indian residents: 46.7 years old, Asian residents: 42.1 years old, Hispanic or Latino residents: 24.0 years old, Other race residents: 21.7 years old)
Area name: Charleston-North Charleston, SC MSA
Fair market rent in 2006 for a 1-bedroom apartment in Berkeley County is $586 a month.
Fair market rent for a 2-bedroom apartment is $663 a month.
Fair market rent for a 3-bedroom apartment is $864 a month.
Cities in this county include: Goose Creek, Hanahan, Sangaree, Cross, Moncks Corner, Wando, Cordesville, Bonneau Beach, St. Stephen, Pinopolis.
Neighboring counties: McCormick County  , Cooke County, Texas
  , Wise County, Texas .
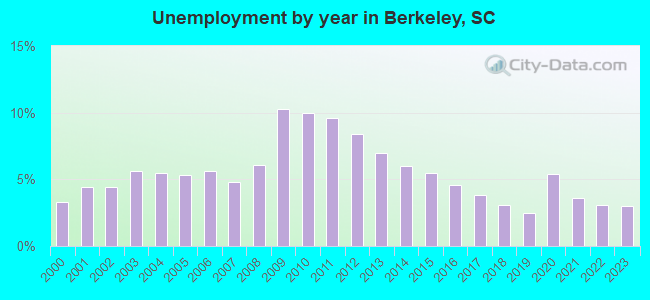
| Here: | 2.7% |
| South Carolina: | 3.1% |

Current college students: 6,897
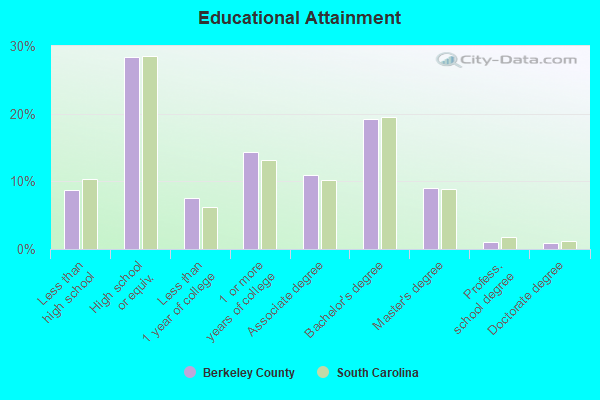
People 25 years of age or older with a high school degree or higher: 92.5%
People 25 years of age or older with a bachelor's degree or higher: 32.3%
Number of foreign born residents: 11,673 (53.4% naturalized citizens)
| Berkeley County: | 4.8% |
| Whole state: | 5.2% |
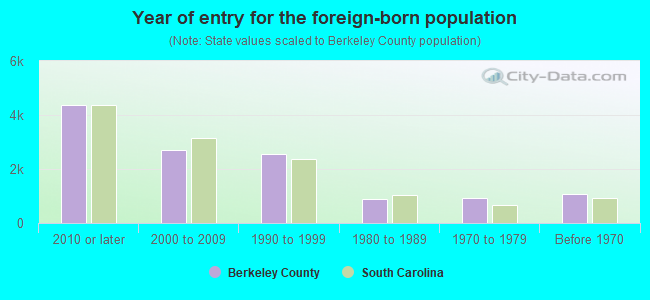
- Year of entry for the foreign-born population
- 4,6402010 or later
- 3,3882000 to 2009
- 2,0041990 to 1999
- 9051980 to 1989
- 9101970 to 1979
- 1,086Before 1970
Mean travel time to work (commute): minutes
Percentage of county residents living and working in this county: 98.8%
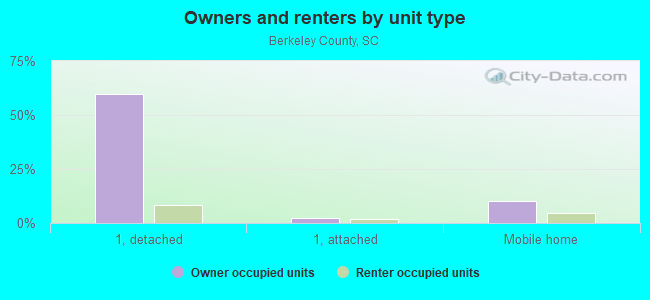
Housing units in structures:
- One, detached: 66,124
- One, attached: 5,124
- Two: 1,632
- 3 or 4: 1,712
- 5 to 9: 2,423
- 10 to 19: 3,709
- 20 to 49: 2,651
- 50 or more: 3,185
- Mobile homes: 14,142
- Boats, RVs, vans, etc.: 14
Housing units in Berkeley County with a mortgage: 49,349 (1,548 second mortgage, 63 home equity loan, 1,283 both second mortgage and home equity loan)
Houses without a mortgage: 1,318
| Here: | 98.0% with mortgage |
| State: | 97.3% with mortgage |
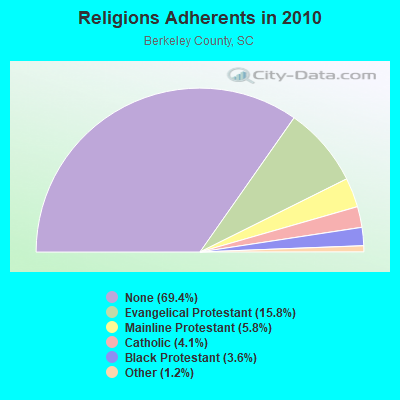
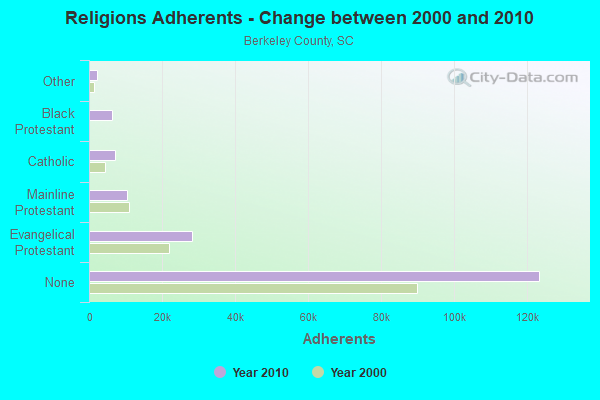
Religion statistics for Berkeley County
| Religion | Adherents | Congregations |
|---|---|---|
| Evangelical Protestant | 28,148 | 126 |
| Mainline Protestant | 10,346 | 51 |
| Catholic | 7,244 | 4 |
| Black Protestant | 6,388 | 37 |
| Other | 2,215 | 7 |
| None | 123,502 | - |
Source: Clifford Grammich, Kirk Hadaway, Richard Houseal, Dale E.Jones, Alexei Krindatch, Richie Stanley and Richard H.Taylor. 2012. 2010 U.S.Religion Census: Religious Congregations & Membership Study. Association of Statisticians of American Religious Bodies. Jones, Dale E., et al. 2002. Congregations and Membership in the United States 2000. Nashville, TN: Glenmary Research Center.
Food Environment Statistics:
| Berkeley County: | 1.04 / 10,000 pop. |
| State: | 1.99 / 10,000 pop. |
| Here: | 0.12 / 10,000 pop. |
| South Carolina: | 0.15 / 10,000 pop. |
| This county: | 0.73 / 10,000 pop. |
| South Carolina: | 0.85 / 10,000 pop. |
| Berkeley County: | 3.55 / 10,000 pop. |
| South Carolina: | 5.38 / 10,000 pop. |
| This county: | 4.22 / 10,000 pop. |
| State: | 7.75 / 10,000 pop. |
| Berkeley County: | 11.3% |
| South Carolina: | 10.6% |
| Berkeley County: | 33.5% |
| State: | 29.4% |
| Here: | 11.8% |
| State: | 13.4% |
Agriculture in Berkeley County:
Average size of farms: 143 acresAverage value of agricultural products sold per farm: $65,241
Average value of crops sold per acre for harvested cropland: $3168.16
The value of livestock, poultry, and their products as a percentage of the total market value of agricultural products sold: 4.16%
Average total farm production expenses per farm: $67,346
Harvested cropland as a percentage of land in farms: 13.83%
Irrigated harvested cropland as a percentage of land in farms: 6.38%
Average market value of all machinery and equipment per farm: $45,446
The percentage of farms operated by a family or individual: 92.46%
Average age of principal farm operators: 58 years
Average number of cattle and calves per 100 acres of all land in farms: 3.76
Milk cows as a percentage of all cattle and calves: 1.26%
Corn for grain: 2368 harvested acres
All wheat for grain: 536 harvested acres
Soybeans for beans: 931 harvested acres
Vegetables: 56 harvested acres
Land in orchards: 129 acres
Earthquake activity:
Berkeley County-area historical earthquake activity is significantly above South Carolina state average. It is 49% smaller than the overall U.S. average.On 11/22/1974 at 05:25:55, a magnitude 4.7 (4.7 MB, Class: Light, Intensity: IV - V) earthquake occurred 18.4 miles away from Berkeley County center
On 8/21/1992 at 16:31:55, a magnitude 4.4 (4.1 MB, 4.1 LG, 4.4 LG, Depth: 6.2 mi) earthquake occurred 9.5 miles away from the county center
On 8/2/1974 at 08:52:09, a magnitude 4.9 (4.3 MB, 4.9 LG) earthquake occurred 153.5 miles away from the county center
On 8/23/2011 at 17:51:04, a magnitude 5.8 (5.8 MW, Depth: 3.7 mi, Class: Moderate, Intensity: VI - VII) earthquake occurred 350.2 miles away from the county center
On 8/9/2020 at 12:07:37, a magnitude 5.1 (5.1 MW, Depth: 4.7 mi) earthquake occurred 240.1 miles away from Berkeley County center
On 4/17/1995 at 13:45:57, a magnitude 3.9 (3.9 LG, Depth: 6.2 mi, Class: Light, Intensity: II - III) earthquake occurred 13.4 miles away from the county center
Magnitude types: regional Lg-wave magnitude (LG), body-wave magnitude (MB), moment magnitude (MW)
Most recent natural disasters:
- South Carolina Severe Storms, Tornadoes, And Straight-line Winds, Incident Period: April 12, 2020 - April 13, 2020, FEMA Id: 4542, Natural disaster type: Storm, Tornado, Wind
- South Carolina Covid-19 Pandemic, Incident Period: January 20, 2020, FEMA Id: 4492, Natural disaster type: Other
- South Carolina Hurricane Dorian, Incident Period: August 31, 2019 - September 6, 2019, FEMA Id: 4464, Natural disaster type: Hurricane
- South Carolina Hurricane Florence, Incident Period: September 8, 2018 - October 8, 2018, FEMA Id: 4394, Natural disaster type: Hurricane
- South Carolina Hurricane Irma, Incident Period: September 6, 2017 - September 13, 2017, FEMA Id: 4346, Natural disaster type: Hurricane
- South Carolina Hurricane Matthew, Incident Period: October 04, 2016 to October 30, 2016, Emergency Declared EM-3378: October 06, 2016, FEMA Id: 3378, Natural disaster type: Hurricane
- South Carolina Hurricane Matthew, Incident Period: October 04, 2016 to October 30, 2016, Major Disaster (Presidential) Declared DR-4286: October 11, 2016, FEMA Id: 4286, Natural disaster type: Hurricane
- South Carolina Severe Storms and Flooding, Incident Period: October 01, 2015 to October 23, 2015, Emergency Declared EM-3373: October 03, 2015, FEMA Id: 3373, Natural disaster type: Storm, Flood
- South Carolina Severe Storms and Flooding, Incident Period: October 01, 2015 to October 23, 2015, Major Disaster (Presidential) Declared DR-4241: October 05, 2015, FEMA Id: 4241, Natural disaster type: Storm, Flood
- South Carolina Severe Winter Storm, Incident Period: February 10, 2014 to February 19, 2014, Emergency Declared EM-3369: February 12, 2014, FEMA Id: 3369, Natural disaster type: Winter Storm
- 8 other natural disasters have been reported since 1953.
The number of natural disasters in Berkeley County (18) is near the US average (15).
Major Disasters (Presidential) Declared: 8
Emergencies Declared: 5
Causes of natural disasters: Hurricanes: 9, Storms: 3, Winter Storms: 3, Floods: 2, Tropical Storms: 2, Tornado: 1, Wind: 1, Other: 1 (Note: some incidents may be assigned to more than one category).
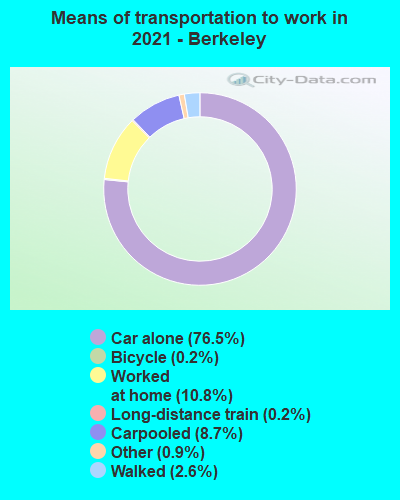
Means of transportation to work:
- Drove a car alone: 61,080 (72.9%)
- Carpooled: 7,107 (8.5%)
- Bus: 86 (0.1%)
- Long-distance train or commuter rail: 164 (0.2%)
- Light rail, streetcar or trolley: 9 (0.0%)
- Ferryboat: 9 (0.0%)
- Taxicab, motorcycle, or other means: 884 (1.1%)
- Bicycle: 89 (0.1%)
- Walked: 1,834 (2.2%)
- Worked at home: 13,555 (16.2%)
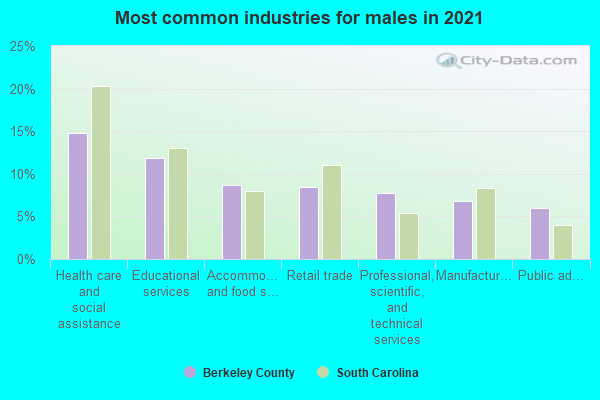
- Health care and social assistance (20%)
- Retail trade (16%)
- Educational services (11%)
- Professional, scientific, and technical services (7%)
- Other services, except public administration (7%)
- Finance and insurance (6%)
- Manufacturing (6%)
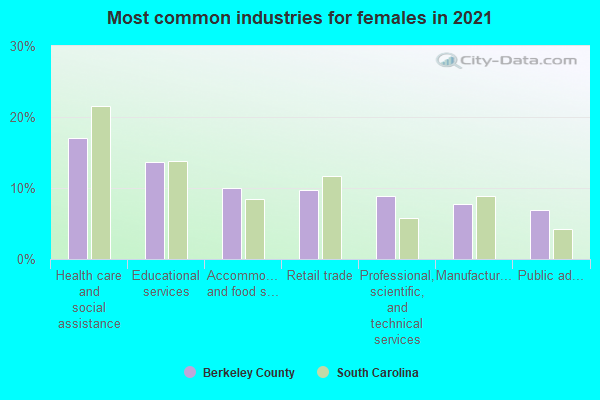
- Health care and social assistance (21%)
- Retail trade (16%)
- Educational services (12%)
- Professional, scientific, and technical services (8%)
- Other services, except public administration (7%)
- Finance and insurance (6%)
- Manufacturing (6%)
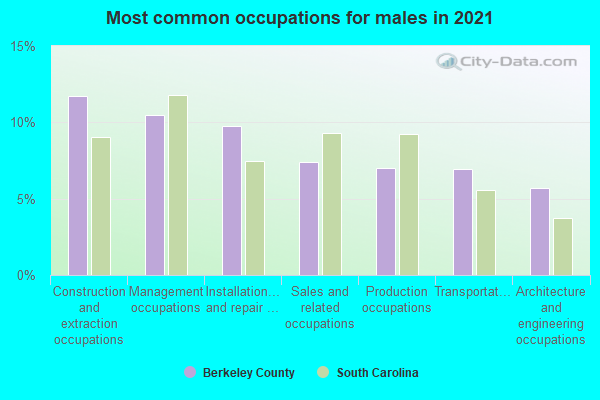
- Management occupations (12%)
- Sales and related occupations (10%)
- Transportation occupations (9%)
- Production occupations (9%)
- Construction and extraction occupations (9%)
- Installation, maintenance, and repair occupations (7%)
- Material moving occupations (6%)
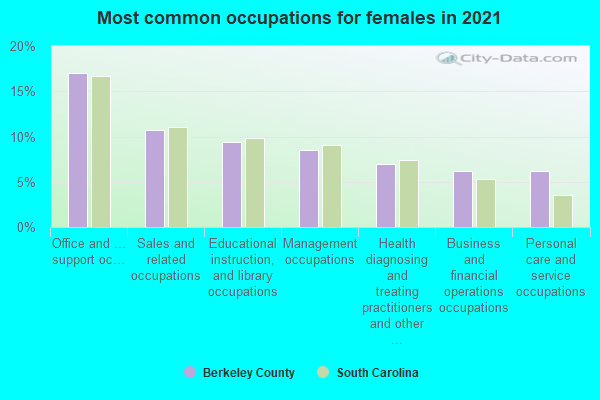
- Office and administrative support occupations (17%)
- Sales and related occupations (15%)
- Educational instruction, and library occupations (11%)
- Management occupations (8%)
- Personal care and service occupations (6%)
- Health diagnosing and treating practitioners and other technical occupations (5%)
- Production occupations (5%)

- Philippines (19%)
- Mexico (13%)
- Honduras (6%)
- Brazil (6%)
- Germany (6%)
- Venezuela (4%)
- El Salvador (3%)
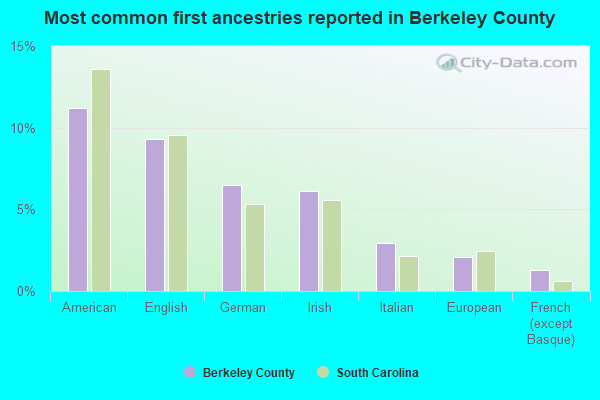
- American (13%)
- English (11%)
- German (7%)
- Irish (6%)
- Italian (3%)
- European (2%)
- Scotch-Irish (1%)
People in group quarters in Berkeley County, South Carolina in 2010:
- 2,322 people in military barracks and dormitories (nondisciplinary)
- 563 people in state prisons
- 336 people in local jails and other municipal confinement facilities
- 265 people in nursing facilities/skilled-nursing facilities
- 160 people in military disciplinary barracks and jails
- 32 people in other noninstitutional facilities
- 16 people in group homes for juveniles (non-correctional)
- 16 people in residential treatment centers for adults
- 15 people in group homes intended for adults
- 10 people in workers' group living quarters and job corps centers
- 7 people in residential treatment centers for juveniles (non-correctional)
People in group quarters in Berkeley County, South Carolina in 2000:
- 2,738 people in military barracks, etc.
- 1,153 people in state prisons
- 685 people in military disciplinary barracks
- 332 people in nursing homes
- 233 people in local jails and other confinement facilities (including police lockups)
- 79 people in homes for the mentally retarded
- 69 people in military transient quarters for temporary residents
- 58 people in other nonhousehold living situations
- 49 people in other group homes
- 23 people in religious group quarters
- 14 people in other noninstitutional group quarters
- 9 people in homes for abused, dependent, and neglected children
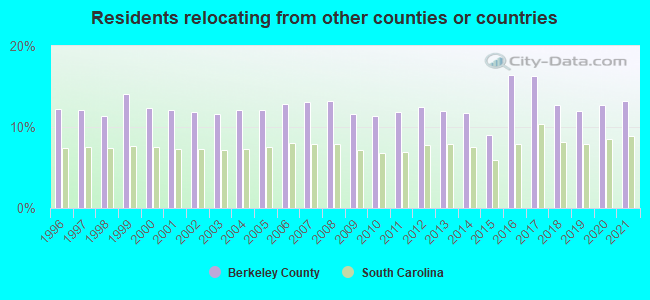
13.27% of this county's 2021 resident taxpayers lived in other counties in 2020 ($69,278 average adjusted gross income)
| Here: | 13.27% |
| South Carolina average: | 8.89% |
0.09% of residents moved from foreign countries ($375 average AGI)
Berkeley County: 0.09% South Carolina average: 0.04%
7.14% relocated from other counties in South Carolina ($30,179 average AGI)
6.05% relocated from other states ($38,724 average AGI)
Berkeley County: 6.05% South Carolina average: 4.96%
Top counties from which taxpayers relocated into this county between 2020 and 2021:
| from Charleston County, SC | |
| from Dorchester County, SC | |
| from Richland County, SC | |
| from Orangeburg County, SC | |
| from San Diego County, CA | |
| from Horry County, SC | |
| from Greenville County, SC |
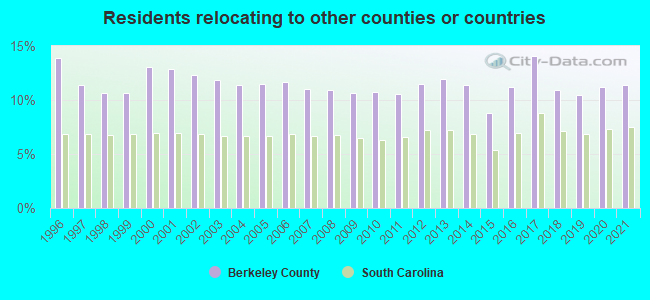
11.39% of this county's 2020 resident taxpayers moved to other counties in 2021 ($61,922 average adjusted gross income)
| Here: | 11.39% |
| South Carolina average: | 7.46% |
0.12% of residents moved to foreign countries ($615 average AGI)
Berkeley County: 0.12% South Carolina average: 0.03%
5.97% relocated to other counties in South Carolina ($30,884 average AGI)
5.30% relocated to other states ($30,423 average AGI)
Berkeley County: 5.30% South Carolina average: 3.47%
Top counties to which taxpayers relocated from this county between 2020 and 2021:
| to Charleston County, SC | |
| to Dorchester County, SC | |
| to Kitsap County, WA | |
| to Orangeburg County, SC | |
| to San Diego County, CA | |
| to Greenville County, SC | |
| to Richland County, SC |
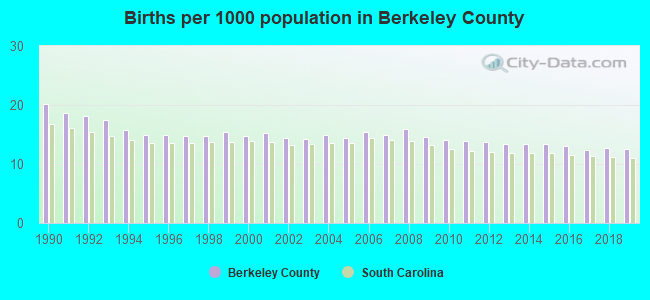
Births per 1000 population from 1990 to 1999: 16.5
Births per 1000 population from 2000 to 2009: 14.9
Births per 1000 population from 2010 to 2022: 11.1
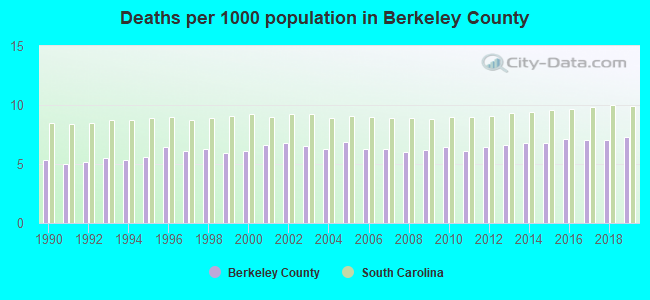
Deaths per 1000 population from 1990 to 1999: 5.7
Deaths per 1000 population from 2000 to 2009: 6.4
Deaths per 1000 population from 2010 to 2020: 6.9
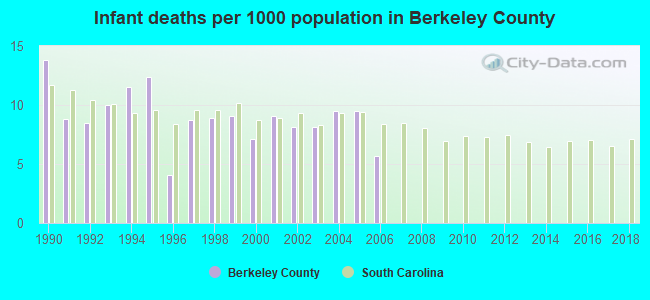
Infant deaths per 1000 live births from 1990 to 1999: 9.6
Infant deaths per 1000 live births from 2000 to 2006: 8.2
Persons under 19 years old without health insurance coverage in 2018: 4.8%


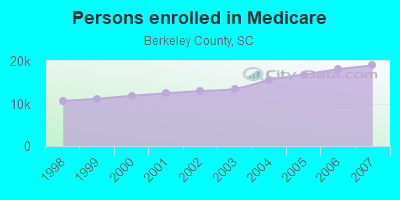
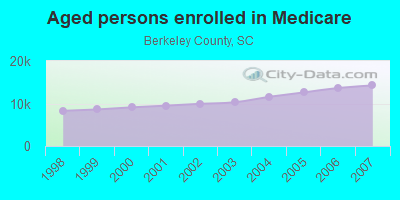
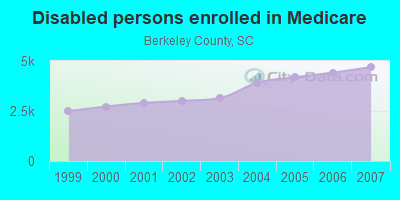
Persons enrolled in hospital insurance and/or supplemental medical insurance (Medicare) in July 1, 2007: 18,944 (14,253 aged, 4,691 disabled)
Children under 18 without health insurance coverage in 2007: 6,511 (14%)
Most common underlying causes of death in Berkeley County, South Carolina in 1999 - 2019:
- Bronchus or lung, unspecified - Malignant neoplasms (1,826)
- Acute myocardial infarction, unspecified (1,449)
- Chronic obstructive pulmonary disease, unspecified (1,316)
- Atherosclerotic heart disease (839)
- Alzheimer disease, unspecified (797)
- Congestive heart failure (755)
- Stroke, not specified as haemorrhage or infarction (631)
- Unspecified dementia (620)
- Unspecified diabetes mellitus, without complications (513)
- Breast, unspecified - Malignant neoplasms (365)
Population without health insurance coverage in 2000: 15%
Children under 18 without health insurance coverage in 2000: 12%
Medical specialist MDs per 100,000 population in 2005: 645
Dentists per 100,000 population in 1998: 7
Total births per 100,000 population, July 2005 - July 2006 : 18
Total deaths per 100,000 population, July 2005 - July 2006: 68
Limited-service eating places per 100,000 population in 2005 : 6
Homicides per 1,000,000 population from 2000 to 2006: 77.8. This is less than state average.
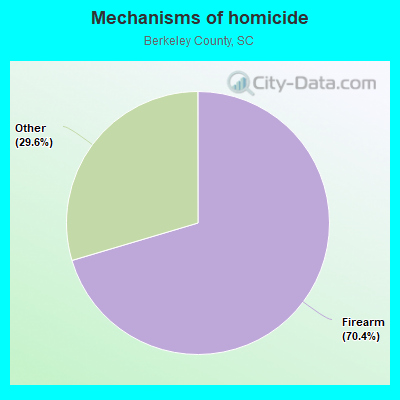
- Firearm - 54.7
- Other - 23.0
Suicides per 1,000,000 population from 2000 to 2006: 114.2. This is less than state average.

- Firearm - 71.0
- Suffocation - 25.9
- Other - 17.3
Household type by relationship:
Households: 245,117- Male householders: 46,394 (11,230 living alone), Female householders: 47,893 (11,487 living alone)
51,260 spouses (50,776 opposite-sex spouses), 4,403 unmarried partners, (3,764 opposite-sex unmarried partners), 65,874 children (60,610 natural, 2,145 adopted, 3,119 stepchildren), 9,235 grandchildren, 1,826 brothers or sisters, 2,295 parents, 1,190 foster children, 3,465 other relatives, 6,353 non-relatives
- In group quarters: 4,929
Size of family households: 30,710 2-persons, 12,764 3-persons, 13,342 4-persons, 5,011 5-persons, 2,770 6-persons, 952 7-or-more-persons.
Size of nonfamily households: 22,717 1-person, 4,807 2-persons, 819 3-persons, 395 4-persons.
37,697 married couples with children.
8,728 single-parent households (1,228 men, 7,500 women).
90.8% of residents of Berkeley speak English at home.
5.2% of residents speak Spanish at home (65% speak English very well, 20% speak English well, 10% speak English not well, 4% don't speak English at all).
2.1% of residents speak other Indo-European language at home (75% speak English very well, 13% speak English well, 9% speak English not well, 3% don't speak English at all).
1.5% of residents speak Asian or Pacific Island language at home (70% speak English very well, 24% speak English well, 7% speak English not well).
0.2% of residents speak other language at home (93% speak English very well, 5% speak English well, 3% speak English not well).
In fiscal year 2004:
Federal Government expenditure: $619,324,000 ($4,138 per capita)
Department of Defense expenditure: $97,325,000
Federal direct payments to individuals for retirement and disability: $339,518,000
Federal other direct payments to individuals: $97,158,000
Federal direct payments not to individuals: $1,650,000
Federal grants: $125,478,000
Federal procurement contracts: $18,074,000 ($15,340,000 Department of Defense)
Federal salaries and wages: $37,446,000 ($16,644,000 Department of Defense)
Federal Government direct loans: $1,778,000
Federal guaranteed/insured loans: $115,096,000
Federal Government insurance: $444,390,000
Population change from April 1, 2000 to July 1, 2005:
Births: 11,202| Here: | 74 per 1000 residents |
| State: | 69 per 1000 residents |
Deaths: 5,092
| Here: | 34 per 1000 residents |
| State: | 46 per 1000 residents |
Net international migration: +721
| Here: | +5 per 1000 residents |
| State: | +9 per 1000 residents |
Net internal migration: +2,416
| Here: | +16 per 1000 residents |
| State: | +27 per 1000 residents |

Total withdrawal of fresh water for public supply: 65.46 millions of gallons per day (2% from ground, 98% from surface)
| Here: | 6.6 |
| State: | 6.4 |
| Here: | 4.7 |
| State: | 4.5 |
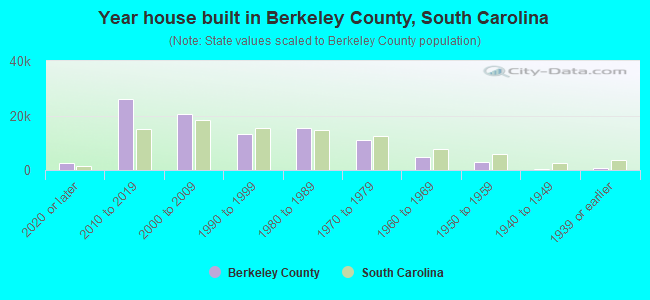
- Year house built in Berkeley County, South Carolina
- 8,7902020 or later
- 23,4632010 to 2019
- 23,8482000 to 2009
- 13,3641990 to 1999
- 13,3511980 to 1989
- 8,3631970 to 1979
- 6,7691960 to 1969
- 1,7681950 to 1959
- 5381940 to 1949
- 4621939 or earlier
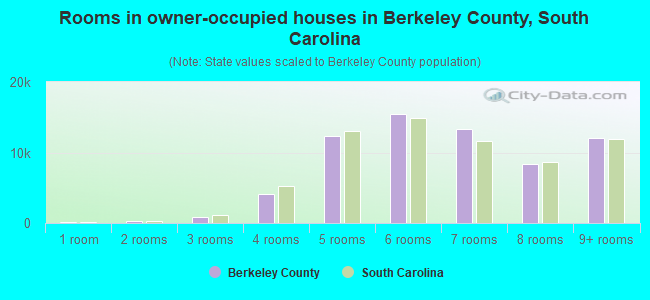
- Rooms in owner-occupied houses in Berkeley County, South Carolina
- 1561 room
- 1272 rooms
- 1,4613 rooms
- 4,7134 rooms
- 14,0865 rooms
- 14,2676 rooms
- 12,5297 rooms
- 11,5538 rooms
- 13,3199+ rooms
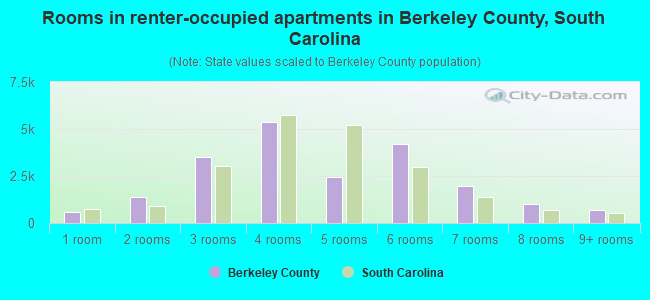
- Rooms in renter-occupied apartments in Berkeley County, South Carolina
- 8451 room
- 8482 rooms
- 3,5843 rooms
- 4,9784 rooms
- 5,1415 rooms
- 3,0186 rooms
- 1,2737 rooms
- 1,4778 rooms
- 9129+ rooms

- Bedrooms in owner-occupied houses in Berkeley County, South Carolina
- 156no bedroom
- 4091 bedroom
- 7,2602 bedrooms
- 37,5673 bedrooms
- 21,6604 bedrooms
- 5,1595+ bedrooms
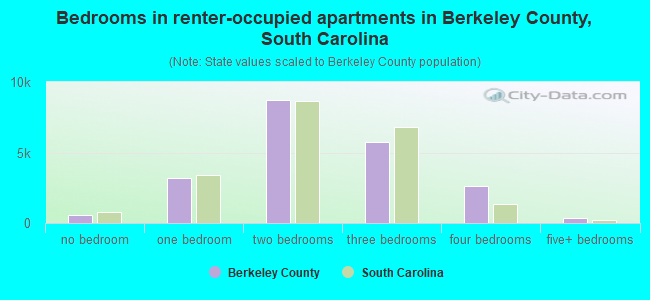
- Bedrooms in renter-occupied apartments in Berkeley County, South Carolina
- 851no bedroom
- 4,1251 bedroom
- 7,3832 bedrooms
- 7,1333 bedrooms
- 2,3914 bedrooms
- 1935+ bedrooms

- Cars and other vehicles available in Berkeley County in owner-occupied houses/condos
- 1,540no vehicle
- 16,8141 vehicle
- 32,3182 vehicles
- 15,9813 vehicles
- 4,0784 vehicles
- 1,4805+ vehicles
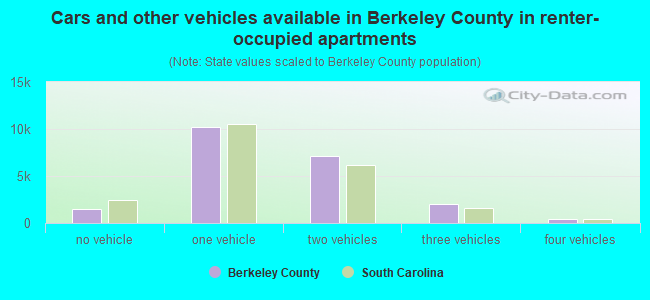
- Cars and other vehicles available in Berkeley County in renter-occupied apartments
- 1,461no vehicle
- 9,7601 vehicle
- 7,6062 vehicles
- 2,6943 vehicles
- 3774 vehicles
- 1785+ vehicles
84.2% of Berkeley County residents lived in the same house 1 years ago.
Out of people who lived in different houses, 29% lived in this county.
Out of people who lived in different counties, 40% lived in South Carolina.
| Berkeley County: | 84.2% |
| State average: | 86.5% |
Place of birth for U.S.-born residents:
- This state: 123,123
- Other state: 105,494
- Northeast: 31,716
- Midwest: 20,389
- South: 42,479
- West: 10,910

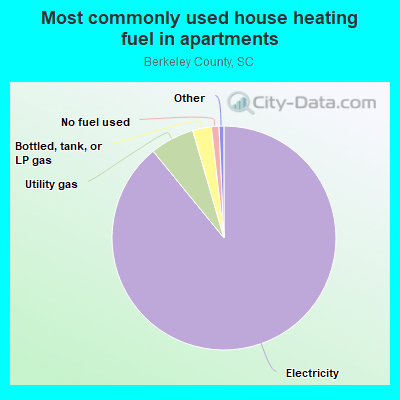
- 75.9%Electricity
- 20.3%Utility gas
- 2.4%Bottled, tank, or LP gas
- 0.5%No fuel used
- 0.4%Solar energy
- 0.2%Fuel oil, kerosene, etc.
- 0.1%Wood
- 88.8%Electricity
- 7.4%Utility gas
- 2.4%Bottled, tank, or LP gas
- 1.0%No fuel used
- 0.2%Fuel oil, kerosene, etc.
- 0.2%Wood
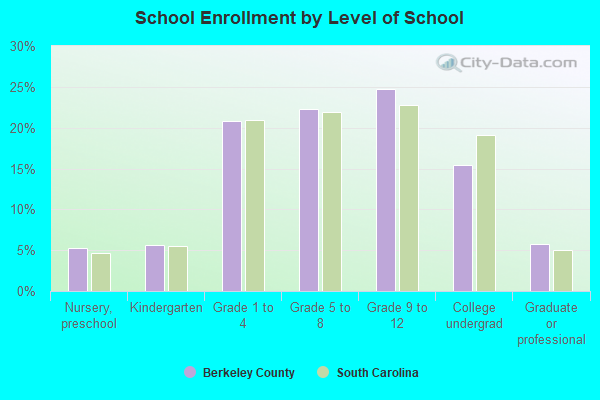
Private vs. public school enrollment:
| Here: | 9.8% |
| South Carolina: | 14.4% |
| Here: | 11.4% |
| South Carolina: | 11.1% |
| Here: | 36.0% |
| South Carolina: | 21.9% |
Berkeley County government finances - Expenditure in 2018:
- Charges - Sewerage: $21,343,000
Sewerage: $20,755,000
Solid Waste Management: $13,303,000
Solid Waste Management: $12,936,000
- Construction - Sewerage: $13,074,000
Sewerage: $11,459,000
Solid Waste Management: $2,314,000
Solid Waste Management: $2,028,000
General - Other: $1,058,000
General - Other: $928,000
Police Protection: $673,000
Police Protection: $589,000
Air Transportation: $235,000
Air Transportation: $206,000
Parks and Recreation: $49,000
Parks and Recreation: $43,000
- Current Operations - Police Protection: $20,507,000
Financial Administration: $19,237,000
Police Protection: $18,437,000
Financial Administration: $17,295,000
Sewerage: $16,671,000
Sewerage: $14,988,000
Health - Other: $11,084,000
Correctional Institutions: $10,621,000
Solid Waste Management: $10,301,000
Health - Other: $9,965,000
Corrections - Other: $9,549,000
Correctional Institutions: $9,549,000
Solid Waste Management: $9,261,000
Judicial and Legal Services: $9,009,000
Regular Highways: $8,732,000
Judicial and Legal Services: $8,099,000
Regular Highways: $7,850,000
General - Other: $5,765,000
General - Other: $5,183,000
Libraries: $3,999,000
Libraries: $3,595,000
Central Staff Services: $2,827,000
Central Staff Services: $2,542,000
Natural Resources - Other: $1,795,000
Natural Resources - Other: $1,614,000
Public Welfare - Other: $1,280,000
Public Welfare - Other: $1,151,000
Parks and Recreation: $828,000
Parks and Recreation: $745,000
Air Transportation: $11,000
Air Transportation: $10,000
- Federal Intergovernmental - Other: $2,397,000
Other: $2,397,000
- Local Intergovernmental - Other: $71,000
Other: $71,000
- Long Term Debt - Beginning Outstanding - Public Debt for Private Purpose: $1,100,000,000
Outstanding Nonguaranteed - Industrial Revenue: $1,069,000,000
Beginning Outstanding - Public Debt for Private Purpose: $1,038,000,000
Outstanding Nonguaranteed - Industrial Revenue: $1,007,000,000
Beginning Outstanding - Unspecified Public Purpose: $232,224,000
Outstanding Unspecified Public Purpose: $188,310,000
Beginning Outstanding - Unspecified Public Purpose: $144,396,000
Outstanding Unspecified Public Purpose: $100,482,000
Retired Unspecified Public Purpose: $43,914,000
Retired Unspecified Public Purpose: $43,914,000
Retired Nonguaranteed - Public Debt for Private Purpose: $31,000,000
Retired Nonguaranteed - Public Debt for Private Purpose: $31,000,000
- Miscellaneous - Fines and Forfeits: $25,469,000
Fines and Forfeits: $21,363,000
General Revenue - Other: $1,851,000
General Revenue - Other: $1,553,000
Interest Earnings: $14,000
Interest Earnings: $12,000
- Other Funds - Cash and Securities: $206,475,000
Cash and Securities: $163,462,000
- Sinking Funds - Cash and Securities: $1,352,262,000
Cash and Securities: $1,070,560,000
- State Intergovernmental - Other: $10,533,000
Other: $10,061,000
Highways: $1,551,000
Highways: $1,482,000
- Tax - Other Selective Sales: $33,569,000
Other Selective Sales: $31,060,000
Property: $27,416,000
Property: $25,366,000
General Sales and Gross Receipts: $15,623,000
General Sales and Gross Receipts: $14,455,000
Other License: $4,753,000
Other License: $4,398,000
Berkeley County government finances - Revenue in 2018:
- Charges - Sewerage: $21,343,000
Sewerage: $20,755,000
Solid Waste Management: $13,303,000
Solid Waste Management: $12,936,000
- Construction - Sewerage: $13,074,000
Sewerage: $11,459,000
Solid Waste Management: $2,314,000
Solid Waste Management: $2,028,000
General - Other: $1,058,000
General - Other: $928,000
Police Protection: $673,000
Police Protection: $589,000
Air Transportation: $235,000
Air Transportation: $206,000
Parks and Recreation: $49,000
Parks and Recreation: $43,000
- Current Operations - Police Protection: $20,507,000
Financial Administration: $19,237,000
Police Protection: $18,437,000
Financial Administration: $17,295,000
Sewerage: $16,671,000
Sewerage: $14,988,000
Health - Other: $11,084,000
Correctional Institutions: $10,621,000
Solid Waste Management: $10,301,000
Health - Other: $9,965,000
Corrections - Other: $9,549,000
Correctional Institutions: $9,549,000
Solid Waste Management: $9,261,000
Judicial and Legal Services: $9,009,000
Regular Highways: $8,732,000
Judicial and Legal Services: $8,099,000
Regular Highways: $7,850,000
General - Other: $5,765,000
General - Other: $5,183,000
Libraries: $3,999,000
Libraries: $3,595,000
Central Staff Services: $2,827,000
Central Staff Services: $2,542,000
Natural Resources - Other: $1,795,000
Natural Resources - Other: $1,614,000
Public Welfare - Other: $1,280,000
Public Welfare - Other: $1,151,000
Parks and Recreation: $828,000
Parks and Recreation: $745,000
Air Transportation: $11,000
Air Transportation: $10,000
- Federal Intergovernmental - Other: $2,397,000
Other: $2,397,000
- Local Intergovernmental - Other: $71,000
Other: $71,000
- Long Term Debt - Beginning Outstanding - Public Debt for Private Purpose: $1,100,000,000
Outstanding Nonguaranteed - Industrial Revenue: $1,069,000,000
Beginning Outstanding - Public Debt for Private Purpose: $1,038,000,000
Outstanding Nonguaranteed - Industrial Revenue: $1,007,000,000
Beginning Outstanding - Unspecified Public Purpose: $232,224,000
Outstanding Unspecified Public Purpose: $188,310,000
Beginning Outstanding - Unspecified Public Purpose: $144,396,000
Outstanding Unspecified Public Purpose: $100,482,000
Retired Unspecified Public Purpose: $43,914,000
Retired Unspecified Public Purpose: $43,914,000
Retired Nonguaranteed - Public Debt for Private Purpose: $31,000,000
Retired Nonguaranteed - Public Debt for Private Purpose: $31,000,000
- Miscellaneous - Fines and Forfeits: $25,469,000
Fines and Forfeits: $21,363,000
General Revenue - Other: $1,851,000
General Revenue - Other: $1,553,000
Interest Earnings: $14,000
Interest Earnings: $12,000
- Other Funds - Cash and Securities: $206,475,000
Cash and Securities: $163,462,000
- Sinking Funds - Cash and Securities: $1,352,262,000
Cash and Securities: $1,070,560,000
- State Intergovernmental - Other: $10,533,000
Other: $10,061,000
Highways: $1,551,000
Highways: $1,482,000
- Tax - Other Selective Sales: $33,569,000
Other Selective Sales: $31,060,000
Property: $27,416,000
Property: $25,366,000
General Sales and Gross Receipts: $15,623,000
General Sales and Gross Receipts: $14,455,000
Other License: $4,753,000
Other License: $4,398,000
Berkeley County government finances - Debt in 2018:
- Charges - Sewerage: $21,343,000
Sewerage: $20,755,000
Solid Waste Management: $13,303,000
Solid Waste Management: $12,936,000
- Construction - Sewerage: $13,074,000
Sewerage: $11,459,000
Solid Waste Management: $2,314,000
Solid Waste Management: $2,028,000
General - Other: $1,058,000
General - Other: $928,000
Police Protection: $673,000
Police Protection: $589,000
Air Transportation: $235,000
Air Transportation: $206,000
Parks and Recreation: $49,000
Parks and Recreation: $43,000
- Current Operations - Police Protection: $20,507,000
Financial Administration: $19,237,000
Police Protection: $18,437,000
Financial Administration: $17,295,000
Sewerage: $16,671,000
Sewerage: $14,988,000
Health - Other: $11,084,000
Correctional Institutions: $10,621,000
Solid Waste Management: $10,301,000
Health - Other: $9,965,000
Corrections - Other: $9,549,000
Correctional Institutions: $9,549,000
Solid Waste Management: $9,261,000
Judicial and Legal Services: $9,009,000
Regular Highways: $8,732,000
Judicial and Legal Services: $8,099,000
Regular Highways: $7,850,000
General - Other: $5,765,000
General - Other: $5,183,000
Libraries: $3,999,000
Libraries: $3,595,000
Central Staff Services: $2,827,000
Central Staff Services: $2,542,000
Natural Resources - Other: $1,795,000
Natural Resources - Other: $1,614,000
Public Welfare - Other: $1,280,000
Public Welfare - Other: $1,151,000
Parks and Recreation: $828,000
Parks and Recreation: $745,000
Air Transportation: $11,000
Air Transportation: $10,000
- Federal Intergovernmental - Other: $2,397,000
Other: $2,397,000
- Local Intergovernmental - Other: $71,000
Other: $71,000
- Long Term Debt - Beginning Outstanding - Public Debt for Private Purpose: $1,100,000,000
Outstanding Nonguaranteed - Industrial Revenue: $1,069,000,000
Beginning Outstanding - Public Debt for Private Purpose: $1,038,000,000
Outstanding Nonguaranteed - Industrial Revenue: $1,007,000,000
Beginning Outstanding - Unspecified Public Purpose: $232,224,000
Outstanding Unspecified Public Purpose: $188,310,000
Beginning Outstanding - Unspecified Public Purpose: $144,396,000
Outstanding Unspecified Public Purpose: $100,482,000
Retired Unspecified Public Purpose: $43,914,000
Retired Unspecified Public Purpose: $43,914,000
Retired Nonguaranteed - Public Debt for Private Purpose: $31,000,000
Retired Nonguaranteed - Public Debt for Private Purpose: $31,000,000
- Miscellaneous - Fines and Forfeits: $25,469,000
Fines and Forfeits: $21,363,000
General Revenue - Other: $1,851,000
General Revenue - Other: $1,553,000
Interest Earnings: $14,000
Interest Earnings: $12,000
- Other Funds - Cash and Securities: $206,475,000
Cash and Securities: $163,462,000
- Sinking Funds - Cash and Securities: $1,352,262,000
Cash and Securities: $1,070,560,000
- State Intergovernmental - Other: $10,533,000
Other: $10,061,000
Highways: $1,551,000
Highways: $1,482,000
- Tax - Other Selective Sales: $33,569,000
Other Selective Sales: $31,060,000
Property: $27,416,000
Property: $25,366,000
General Sales and Gross Receipts: $15,623,000
General Sales and Gross Receipts: $14,455,000
Other License: $4,753,000
Other License: $4,398,000
Berkeley County government finances - Cash and Securities in 2018:
- Charges - Sewerage: $21,343,000
Sewerage: $20,755,000
Solid Waste Management: $13,303,000
Solid Waste Management: $12,936,000
- Construction - Sewerage: $13,074,000
Sewerage: $11,459,000
Solid Waste Management: $2,314,000
Solid Waste Management: $2,028,000
General - Other: $1,058,000
General - Other: $928,000
Police Protection: $673,000
Police Protection: $589,000
Air Transportation: $235,000
Air Transportation: $206,000
Parks and Recreation: $49,000
Parks and Recreation: $43,000
- Current Operations - Police Protection: $20,507,000
Financial Administration: $19,237,000
Police Protection: $18,437,000
Financial Administration: $17,295,000
Sewerage: $16,671,000
Sewerage: $14,988,000
Health - Other: $11,084,000
Correctional Institutions: $10,621,000
Solid Waste Management: $10,301,000
Health - Other: $9,965,000
Corrections - Other: $9,549,000
Correctional Institutions: $9,549,000
Solid Waste Management: $9,261,000
Judicial and Legal Services: $9,009,000
Regular Highways: $8,732,000
Judicial and Legal Services: $8,099,000
Regular Highways: $7,850,000
General - Other: $5,765,000
General - Other: $5,183,000
Libraries: $3,999,000
Libraries: $3,595,000
Central Staff Services: $2,827,000
Central Staff Services: $2,542,000
Natural Resources - Other: $1,795,000
Natural Resources - Other: $1,614,000
Public Welfare - Other: $1,280,000
Public Welfare - Other: $1,151,000
Parks and Recreation: $828,000
Parks and Recreation: $745,000
Air Transportation: $11,000
Air Transportation: $10,000
- Federal Intergovernmental - Other: $2,397,000
Other: $2,397,000
- Local Intergovernmental - Other: $71,000
Other: $71,000
- Long Term Debt - Beginning Outstanding - Public Debt for Private Purpose: $1,100,000,000
Outstanding Nonguaranteed - Industrial Revenue: $1,069,000,000
Beginning Outstanding - Public Debt for Private Purpose: $1,038,000,000
Outstanding Nonguaranteed - Industrial Revenue: $1,007,000,000
Beginning Outstanding - Unspecified Public Purpose: $232,224,000
Outstanding Unspecified Public Purpose: $188,310,000
Beginning Outstanding - Unspecified Public Purpose: $144,396,000
Outstanding Unspecified Public Purpose: $100,482,000
Retired Unspecified Public Purpose: $43,914,000
Retired Unspecified Public Purpose: $43,914,000
Retired Nonguaranteed - Public Debt for Private Purpose: $31,000,000
Retired Nonguaranteed - Public Debt for Private Purpose: $31,000,000
- Miscellaneous - Fines and Forfeits: $25,469,000
Fines and Forfeits: $21,363,000
General Revenue - Other: $1,851,000
General Revenue - Other: $1,553,000
Interest Earnings: $14,000
Interest Earnings: $12,000
- Other Funds - Cash and Securities: $206,475,000
Cash and Securities: $163,462,000
- Sinking Funds - Cash and Securities: $1,352,262,000
Cash and Securities: $1,070,560,000
- State Intergovernmental - Other: $10,533,000
Other: $10,061,000
Highways: $1,551,000
Highways: $1,482,000
- Tax - Other Selective Sales: $33,569,000
Other Selective Sales: $31,060,000
Property: $27,416,000
Property: $25,366,000
General Sales and Gross Receipts: $15,623,000
General Sales and Gross Receipts: $14,455,000
Other License: $4,753,000
Other License: $4,398,000
Supplemental Security Income (SSI) in 2006:
- Total number of recipients: 2,954
- Number of aged recipients: 325
- Number of blind and disabled recipients: 2,629
- Number of recipients under 18: 514
- Number of recipients between 18 and 64: 1,808
- Number of recipients older than 64: 632
- Number of recipients also receiving OASDI: 1,111
- Amount of payments (thousands of dollars): 1,270
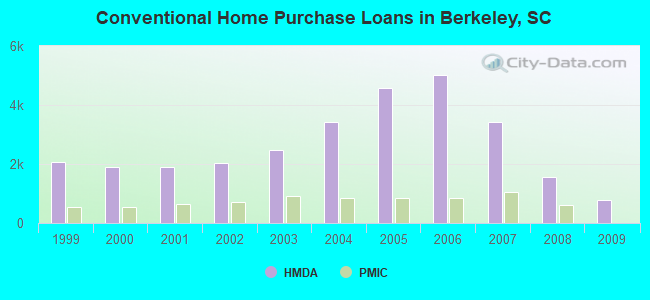
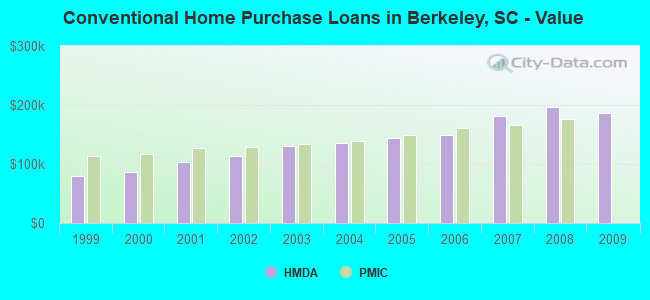
| Home Mortgage Disclosure Act Aggregated Statistics For Year 2009 (Based on 22 full tracts) | ||||||||||||||
| A) FHA, FSA/RHS & VA Home Purchase Loans | B) Conventional Home Purchase Loans | C) Refinancings | D) Home Improvement Loans | E) Loans on Dwellings For 5+ Families | F) Non-occupant Loans on < 5 Family Dwellings (A B C & D) | G) Loans On Manufactured Home Dwelling (A B C & D) | ||||||||
|---|---|---|---|---|---|---|---|---|---|---|---|---|---|---|
| Number | Average Value | Number | Average Value | Number | Average Value | Number | Average Value | Number | Average Value | Number | Average Value | Number | Average Value | |
| LOANS ORIGINATED | 1,286 | $163,006 | 780 | $185,828 | 3,492 | $186,588 | 372 | $27,556 | 4 | $1,645,000 | 354 | $153,379 | 268 | $54,683 |
| APPLICATIONS APPROVED, NOT ACCEPTED | 61 | $158,590 | 67 | $139,119 | 312 | $171,673 | 15 | $267,333 | 0 | $0 | 25 | $172,000 | 41 | $61,707 |
| APPLICATIONS DENIED | 281 | $160,509 | 243 | $154,136 | 1,664 | $191,696 | 123 | $45,146 | 2 | $2,212,500 | 118 | $171,500 | 186 | $65,081 |
| APPLICATIONS WITHDRAWN | 159 | $163,434 | 119 | $212,563 | 984 | $188,218 | 27 | $96,148 | 2 | $13,344,500 | 64 | $159,297 | 40 | $90,700 |
| FILES CLOSED FOR INCOMPLETENESS | 32 | $160,188 | 34 | $279,971 | 250 | $186,492 | 3 | $91,333 | 0 | $0 | 8 | $235,625 | 20 | $69,550 |
| Private Mortgage Insurance Companies Aggregated Statistics For Year 2008 (Based on 21 full tracts) | ||||||||
| A) Conventional Home Purchase Loans | B) Refinancings | C) Non-occupant Loans on < 5 Family Dwellings (A & B) | D) Loans On Manufactured Home Dwelling (A & B) | |||||
|---|---|---|---|---|---|---|---|---|
| Number | Average Value | Number | Average Value | Number | Average Value | Number | Average Value | |
| LOANS ORIGINATED | 594 | $176,513 | 235 | $175,664 | 91 | $158,275 | 3 | $138,667 |
| APPLICATIONS APPROVED, NOT ACCEPTED | 216 | $190,569 | 105 | $186,257 | 32 | $178,688 | 2 | $91,000 |
| APPLICATIONS DENIED | 32 | $204,594 | 19 | $161,368 | 11 | $261,545 | 1 | $98,000 |
| APPLICATIONS WITHDRAWN | 28 | $154,250 | 14 | $190,786 | 6 | $153,000 | 2 | $89,000 |
| FILES CLOSED FOR INCOMPLETENESS | 20 | $196,750 | 6 | $158,167 | 7 | $193,571 | 0 | $0 |
| Most common first names in Berkeley County, SC among deceased individuals | ||
| Name | Count | Lived (average) |
|---|---|---|
| James | 518 | 69.0 years |
| William | 449 | 70.2 years |
| John | 426 | 69.8 years |
| Mary | 383 | 74.4 years |
| Robert | 318 | 67.4 years |
| Charles | 234 | 69.7 years |
| George | 185 | 71.9 years |
| Henry | 160 | 73.9 years |
| Joseph | 159 | 72.2 years |
| Thomas | 154 | 70.5 years |
| Most common last names in Berkeley County, SC among deceased individuals | ||
| Last name | Count | Lived (average) |
|---|---|---|
| Brown | 220 | 73.3 years |
| Smith | 218 | 73.3 years |
| Williams | 188 | 71.7 years |
| Johnson | 153 | 70.0 years |
| Davis | 125 | 72.1 years |
| Wright | 115 | 69.6 years |
| Jones | 115 | 73.3 years |
| Simmons | 114 | 70.2 years |
| Wilson | 105 | 68.8 years |
| Clark | 90 | 67.4 years |
| Businesses in Berkeley County, SC | ||||
| Name | Count | Name | Count | |
|---|---|---|---|---|
| AT&T | 2 | Lowe's | 2 | |
| Advance Auto Parts | 4 | Marriott | 2 | |
| Aeropostale | 1 | Marshalls | 1 | |
| American Eagle Outfitters | 1 | MasterBrand Cabinets | 1 | |
| Applebee's | 3 | McDonald's | 7 | |
| Arby's | 4 | Men's Wearhouse | 1 | |
| AutoZone | 3 | Motherhood Maternity | 1 | |
| Barnes & Noble | 1 | New York & Co | 1 | |
| Bath & Body Works | 1 | Nike | 15 | |
| Bed Bath & Beyond | 1 | Nissan | 1 | |
| Best Western | 1 | Office Depot | 1 | |
| Blockbuster | 3 | OfficeMax | 1 | |
| Buffalo Wild Wings | 1 | Old Navy | 1 | |
| Burger King | 4 | Olive Garden | 1 | |
| CVS | 6 | Outback | 1 | |
| Casual Male XL | 1 | Outback Steakhouse | 1 | |
| Catherines | 1 | Pac Sun | 1 | |
| Charlotte Russe | 1 | Panera Bread | 1 | |
| Chevrolet | 2 | Papa John's Pizza | 2 | |
| Chick-Fil-A | 3 | Payless | 2 | |
| Chuck E. Cheese's | 1 | Penske | 2 | |
| Church's Chicken | 2 | PetSmart | 1 | |
| Circle K | 2 | Pier 1 Imports | 2 | |
| Cold Stone Creamery | 1 | Pizza Hut | 5 | |
| Comfort Inn | 1 | Popeyes | 1 | |
| Comfort Suites | 1 | Publix Super Markets | 1 | |
| Cracker Barrel | 2 | Quiznos | 1 | |
| Cricket Wireless | 3 | RadioShack | 2 | |
| Curves | 2 | Ramada | 1 | |
| Dairy Queen | 1 | Red Lobster | 1 | |
| Deb | 1 | Red Roof Inn | 1 | |
| Dennys | 1 | Rite Aid | 1 | |
| Domino's Pizza | 1 | Rooms To Go | 1 | |
| DressBarn | 1 | Ruby Tuesday | 1 | |
| Dressbarn | 1 | Rue21 | 1 | |
| Dunkin Donuts | 3 | Ryan's Grill | 2 | |
| Econo Lodge | 2 | SAS Shoes | 1 | |
| Express | 1 | SONIC Drive-In | 5 | |
| FedEx | 26 | Sears | 4 | |
| Finish Line | 1 | Sephora | 1 | |
| Firestone Complete Auto Care | 1 | Sheraton | 1 | |
| Foot Locker | 1 | Shoe Carnival | 2 | |
| Ford | 2 | Sleep Inn | 1 | |
| Fredericks Of Hollywood | 1 | Spencer Gifts | 1 | |
| GNC | 3 | Sprint Nextel | 4 | |
| GameStop | 5 | Staples | 1 | |
| Gymboree | 1 | Starbucks | 3 | |
| H&R Block | 6 | Studio Plus Deluxe Studios | 1 | |
| Hardee's | 5 | Subaru | 1 | |
| Havertys Furniture | 1 | Suburban | 1 | |
| Hilton | 2 | Subway | 12 | |
| Holiday Inn | 6 | T-Mobile | 5 | |
| Hollister Co. | 1 | T.J.Maxx | 1 | |
| Home Depot | 2 | Taco Bell | 4 | |
| Honda | 1 | Target | 2 | |
| Hot Topic | 1 | The Room Place | 1 | |
| Hyatt | 1 | Tire Kingdom | 2 | |
| Hyundai | 1 | Toyota | 1 | |
| IHOP | 2 | Toys"R"Us | 1 | |
| InTown Suites | 2 | True Value | 2 | |
| JCPenney | 1 | U-Haul | 10 | |
| Jones New York | 4 | UPS | 27 | |
| Journeys | 1 | Vans | 1 | |
| KFC | 5 | Verizon Wireless | 3 | |
| Kmart | 1 | Victoria's Secret | 1 | |
| Kohl's | 1 | Waffle House | 5 | |
| La-Z-Boy | 2 | Walgreens | 4 | |
| Lane Bryant | 1 | Walmart | 3 | |
| LensCrafters | 1 | Wingate | 1 | |
| Little Caesars Pizza | 3 | YMCA | 2 | |
Berkeley County on our top lists:
- #23 on the list of "Top 101 counties with the highest percentage of residents relocating from other counties between 2010 and 2011 (pop. 50,000+)"
- #38 on the list of "Top 101 counties with the lowest percentage of residents that visited a dentist within the past year"
- #38 on the list of "Top 101 counties with the highest average weight of females"
- #42 on the list of "Top 101 counties with the smallest number of people without health insurance coverage in 2000 (pop. 50,000+)"
- #43 on the list of "Top 101 counties with the highest percentage of residents relocating to other counties in 2011 (pop. 50,000+)"
- #62 on the list of "Top 101 counties with the worst general health status score of residents (1-5), 3 years of data"
- #64 on the list of "Top 101 counties with the highest percentage of residents relocating from other counties between 2010 and 2011"
- #70 on the list of "Top 101 counties with the highest percentage of residents relocating to foreign countries in 2011 (pop. 50,000+)"
- #84 on the list of "Top 101 counties with the largest number of people moving in compared to moving out (pop. 50,000+)"
- #89 on the list of "Top 101 counties with the lowest percentage of residents that exercised in the past month"
- #91 on the list of "Top 101 counties with the highest surface withdrawal of fresh water for public supply (pop. 50,000+)"
- #96 on the list of "Top 101 counties with the highest surface withdrawal of fresh water for public supply"
- #97 on the list of "Top 101 counties with the most Black Protestant congregations (pop. 50,000+)"
- #98 on the list of "Top 101 counties with the most Black Protestant congregations"